

Extrapolating Sentinel Surveillance Information to Estimate National COVID Hospital Admission Rates: A Bayesian Modeling Approach
- PMID: 39440677
- PMCID: PMC11497105
- DOI: 10.1111/irv.70026
Extrapolating Sentinel Surveillance Information to Estimate National COVID Hospital Admission Rates: A Bayesian Modeling Approach
Abstract
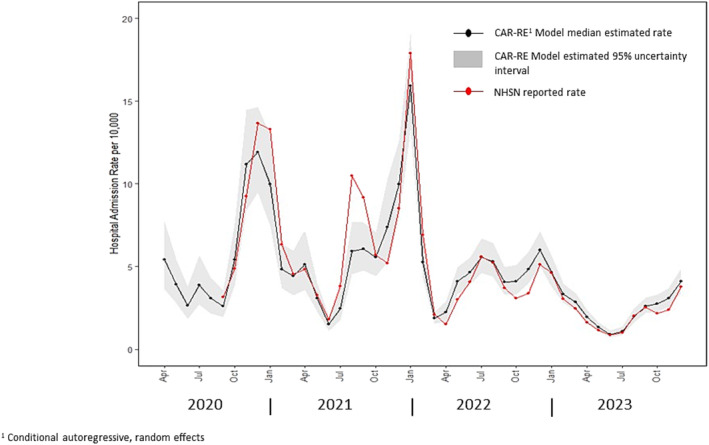
The COVID-19-Associated Hospitalization Surveillance Network (COVID-NET) was established in March 2020 to monitor trends in hospitalizations associated with SARS-CoV-2 infection. COVID-NET is a geographically diverse population-based surveillance system for laboratory-confirmed COVID-19-associated hospitalizations with a combined catchment area covering approximately 10% of the US population. Data collected in COVID-NET includes monthly counts of hospitalizations for persons with confirmed SARS-CoV-2 infection who reside within the defined catchment area. A Bayesian modeling approach is proposed to estimate US national COVID-associated hospital admission rates based on information reported in the COVID-NET system. A key component of the approach is the ability to estimate uncertainty resulting from extrapolation of hospitalization rates observed within COVID-NET to the US population. In addition, the proposed model enables estimation of other contributors to uncertainty including temporal dependence among reported COVID-NET admission counts, the impact of unmeasured site-specific factors, and the frequency and accuracy of testing for SARS-CoV-2 infection. Based on the proposed model, an estimated 6.3 million (95% uncertainty interval (UI) 5.4-7.3 million) COVID-19-associated hospital admissions occurred in the United States from September 2020 through December 2023. Between April 2020 and December 2023, model-based monthly admission rate estimates ranged from a minimum of 1 per 10,000 population (95% UI 0.7-1.2) in June of 2023 to a highest monthly level of 16 per 10,000 (95% UI 13-19) in January 2022.
Keywords: Bayesian modeling; COVID‐19; Population‐based surviellance; hospitalization; sentinel surviellance.
Published 2024. This article is a U.S. Government work and is in the public domain in the USA. Influenza and Other Respiratory Viruses published by John Wiley & Sons Ltd.
Conflict of interest statement
The findings and conclusions in this manuscript are those of the author(s) and do not necessarily represent the official position of the Centers for Disease Control and Prevention (CDC).
Meek J declares CDC funding for Connecticut Emerging Infections Program, Ryan PA declares salary support from an Emerging Infections program cooperative agreement with CDC, Reeg L declares funding from a CSTE/CDC federal grant, and Resini B declares receipt of honoraria from Merck for editorial board membership.
Figures


References
-
- CDC , “COVID‐NET Overview and Methods,” https://www.cdc.gov/coronavirus/2019‐ncov/covid‐data/covid‐net/purpose‐m....
-
- Couture A., Iuliano D., Chang H., et al., “Estimating COVID‐19 Hospitalizations in the United States With Surveillance Data Using a Bayesian Hierarchical Model: Modeling Study,” JMIR Public Health and Surveillance 8, no. 6 (2022): e34296, https://publichealth.jmir/org/2022/6/e34296. - PMC - PubMed
-
- Respiratory Virus Response (RVR) United States Hospitalization Metrics by Jurisdiction, Timeseries (n.d.), https://data.cdc.gov/Public‐Health‐Surveillance/Respiratory‐Virus‐Respon....
Publication types
MeSH terms
LinkOut - more resources
Full Text Sources
Medical
Miscellaneous
