. 2024 Dec 12;144(24):2546-2553.
doi: 10.1182/blood.2024025476.

Procoagulant platelet activation promotes venous thrombosis

Affiliations

Procoagulant platelet activation promotes venous thrombosis

Rainer Kaiser et al. Blood. .

Abstract

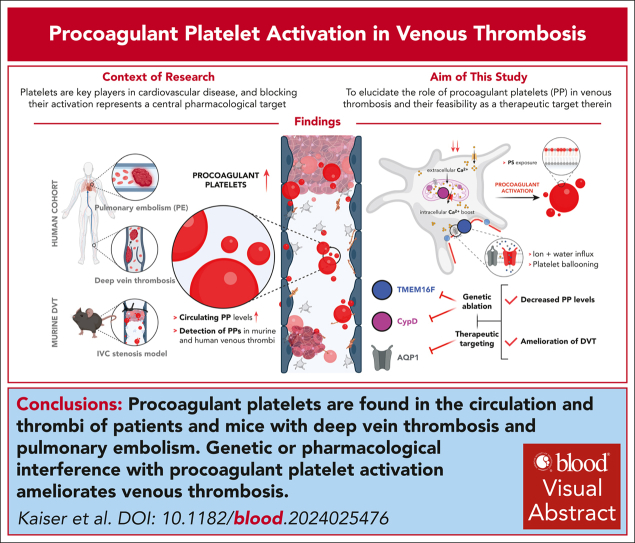
Platelets are key players in cardiovascular disease, and platelet aggregation represents a central pharmacologic target, particularly in secondary prevention. However, inhibition of adenosine diphosphate and thromboxane signaling has low efficacy in preventing venous thromboembolism, necessitating the inhibition of the plasmatic coagulation cascade in this disease entity. Anticoagulation carries a significantly higher risk of bleeding complications, highlighting the need of alternative therapeutic approaches. We hypothesized that procoagulant activation (PA) of platelets promotes venous thrombus formation and that targeting PA could alleviate venous thrombosis. Here, we found elevated levels of procoagulant platelets in the circulation and in thrombi of patients with deep vein thrombosis (DVT) and pulmonary embolism, and in mice developing DVT following inferior vena cava stenosis. Furthermore, we detected PA of recruited platelets within murine venous thrombi and human pulmonary emboli. Mice with platelet-specific deficiency in central pathways of PA-cyclophilin D and transmembrane protein 16F-were more resistant toward low flow-induced venous thrombosis. Finally, we found that a clinically approved carbonic anhydrase inhibitor, methazolamide, reduced platelet procoagulant activity and alleviated murine thrombus formation without affecting trauma-associated hemostasis. These findings identify an essential role of platelet procoagulant function in venous thrombosis and delineate novel pharmacologic strategies targeting platelets in the prevention of venous thromboembolism.


Conflict of interest statement

Conflict-of-interest disclosure: T.B. and J.K. have an exclusive licensing agreement with BioLegend, Inc, for the commercialization of mC1-multimer. The remaining authors declare no competing financial interests.

Figures

None
Graphical abstract
Figure 1.
Figure 1.
Procoagulant platelet activation is a hallmark of venous thrombosis in human individuals and mice. (A) Scheme of clinical cohort and performed imaging entities to confirm DVT or PE. (B) Quantification of systemic D-dimer levels, leukocyte counts, percentage neutrophils of leukocytes, percentage platelet-neutrophil aggregates (PNA) of circulating neutrophils, circulating procoagulant platelets (PPs), and platelet surface expression of activated GPIIBIIIA and P-selectin in patients with suspected DVT or PE, comparing those without (black) vs those with confirmed thrombosis or thromboembolism (red). Student t-test, 2-tailed, unpaired. Gray boxes indicate normal range. (C) Representative specimen of interventionally retrieved human pulmonary embolus (white line) that was retrieved using a transfemoral mechanical thrombectomy device. Scale bar = 5 cm. See supplemental Figure 2A and supplemental Video 1 for further imaging data on the same patient. (D) Representative IF staining of a human pulmonary embolus retrieved through interventional thrombectomy and stained for CD42b, fibrinogen, and phosphatidylserine (PS). Scale bar = 10 μm (left) and 3 μm (right panel). See supplemental Figure 2C-D for individual channels, further examples, and unstained controls. (E) Experimental scheme of inferior vena cava (IVC) stenosis model. (F) Quantification of circulating PPs in wild-type mice undergoing the stenosis-induced vena cava thrombosis model, comparing mice without vs those with evidence of caval thrombosis. Student t-test, 2-tailed, unpaired. (G) Linear regression analysis to correlate thrombus weight in mice with percentage circulating PPs or the indicated platelet surface markers. (H) Representative IF staining of a murine IVC thrombus stained for CD42b, fibrinogen, and PS. The highlighted, framed area is shown in split channels on the right-hand side. Scale bars = 25 μm (left panel), 15 μm (other panels). See supplemental Figure 2G for unstained controls. (I) Scheme of flow reduction–induced mesenteric vein thrombosis and live-imaging approach and representative confocal overview (generated through maximum intensity projection) of a ligated mesenteric vein; the white silk thread is visualized in the upper part of the image. Scale bar = 50 μm. (J) Representative confocal image of a developing thrombus in a mesenteric vein 1 hour after flow reduction. Right: split channels showing a procoagulant platelet derived from the highlighted area (white dashed line) of the developing thrombus. Scale bars = left 50, right 5 μm. See supplemental Video 2 for correlating live microscopy. (K) Scheme of flow reduction–induced IVC thrombosis and live-imaging approach as well as representative confocal overview of a developing thrombus. Right: split channels showing a procoagulant platelet derived from the highlighted area (white dashed line) of the developing thrombus. Micrographs below the CD42b channel highlight the colocalization of CD42b and PS along with local binding of fibrin(ogen). Pseudocolored image depicts areas of colocalization between CD42b and PS. Scale bars = left 50, right 10 μm. White arrow indicates the direction of blood flow. Scale bar = 50 μm. (L) Representative confocal image of a developing thrombus in an IVC ≈3 hours after flow reduction. Scale bar = 50 μm. See supplemental Video 3 for correlating live microscopy. Graph to right: normalized intensity profiles of CD41, fibrin(ogen), and PS, corresponding to red line in the image to the left. (M) Explanatory scheme and quantification of triple-positive areas vs Fbg/PS-only positive areas in IVC thrombi, representing fibrin(ogen) recruitment of procoagulant platelets vs fibrin(ogen) recruitment by leukocytes and/or endothelial cells. Individual data points correspond to randomly acquired images of IVC thrombi (n = 30) derived from n = 4 mice. Unless otherwise stated, all statistical tests were Student t-test, 2-tailed, unpaired. P values corresponding to asterisks: ∗P < .05, ∗∗P < .01, ∗∗∗P < .005.
Figure 1.
Figure 1.
Procoagulant platelet activation is a hallmark of venous thrombosis in human individuals and mice. (A) Scheme of clinical cohort and performed imaging entities to confirm DVT or PE. (B) Quantification of systemic D-dimer levels, leukocyte counts, percentage neutrophils of leukocytes, percentage platelet-neutrophil aggregates (PNA) of circulating neutrophils, circulating procoagulant platelets (PPs), and platelet surface expression of activated GPIIBIIIA and P-selectin in patients with suspected DVT or PE, comparing those without (black) vs those with confirmed thrombosis or thromboembolism (red). Student t-test, 2-tailed, unpaired. Gray boxes indicate normal range. (C) Representative specimen of interventionally retrieved human pulmonary embolus (white line) that was retrieved using a transfemoral mechanical thrombectomy device. Scale bar = 5 cm. See supplemental Figure 2A and supplemental Video 1 for further imaging data on the same patient. (D) Representative IF staining of a human pulmonary embolus retrieved through interventional thrombectomy and stained for CD42b, fibrinogen, and phosphatidylserine (PS). Scale bar = 10 μm (left) and 3 μm (right panel). See supplemental Figure 2C-D for individual channels, further examples, and unstained controls. (E) Experimental scheme of inferior vena cava (IVC) stenosis model. (F) Quantification of circulating PPs in wild-type mice undergoing the stenosis-induced vena cava thrombosis model, comparing mice without vs those with evidence of caval thrombosis. Student t-test, 2-tailed, unpaired. (G) Linear regression analysis to correlate thrombus weight in mice with percentage circulating PPs or the indicated platelet surface markers. (H) Representative IF staining of a murine IVC thrombus stained for CD42b, fibrinogen, and PS. The highlighted, framed area is shown in split channels on the right-hand side. Scale bars = 25 μm (left panel), 15 μm (other panels). See supplemental Figure 2G for unstained controls. (I) Scheme of flow reduction–induced mesenteric vein thrombosis and live-imaging approach and representative confocal overview (generated through maximum intensity projection) of a ligated mesenteric vein; the white silk thread is visualized in the upper part of the image. Scale bar = 50 μm. (J) Representative confocal image of a developing thrombus in a mesenteric vein 1 hour after flow reduction. Right: split channels showing a procoagulant platelet derived from the highlighted area (white dashed line) of the developing thrombus. Scale bars = left 50, right 5 μm. See supplemental Video 2 for correlating live microscopy. (K) Scheme of flow reduction–induced IVC thrombosis and live-imaging approach as well as representative confocal overview of a developing thrombus. Right: split channels showing a procoagulant platelet derived from the highlighted area (white dashed line) of the developing thrombus. Micrographs below the CD42b channel highlight the colocalization of CD42b and PS along with local binding of fibrin(ogen). Pseudocolored image depicts areas of colocalization between CD42b and PS. Scale bars = left 50, right 10 μm. White arrow indicates the direction of blood flow. Scale bar = 50 μm. (L) Representative confocal image of a developing thrombus in an IVC ≈3 hours after flow reduction. Scale bar = 50 μm. See supplemental Video 3 for correlating live microscopy. Graph to right: normalized intensity profiles of CD41, fibrin(ogen), and PS, corresponding to red line in the image to the left. (M) Explanatory scheme and quantification of triple-positive areas vs Fbg/PS-only positive areas in IVC thrombi, representing fibrin(ogen) recruitment of procoagulant platelets vs fibrin(ogen) recruitment by leukocytes and/or endothelial cells. Individual data points correspond to randomly acquired images of IVC thrombi (n = 30) derived from n = 4 mice. Unless otherwise stated, all statistical tests were Student t-test, 2-tailed, unpaired. P values corresponding to asterisks: ∗P < .05, ∗∗P < .01, ∗∗∗P < .005.
Figure 2.
Figure 2.
Genetic and pharmacologic inhibition of platelet PA alleviates venous thrombus formation. (A) Schematic of affected signaling pathways of platelet PA in PF4cre-TMEM16Ffl/fl mice. (B) Cell counts of peripheral blood for the indicated cell types and hematocrit quantification. Student t-test, 2-tailed, unpaired. (C) Experimental scheme of DVT in PF4cre-TMEM16Ffl/fl mice as well as thrombus weight (plotted) and incidence (percentage below graph) for n = 11 Cre and n = 14 Cre+ PF4cre-TMEM16F mice. (D) Representative confocal image of IVC thrombi retrieved from Cre or Cre+ mice. Scale bar = 100 μm. See supplemental Figure 5D-E for unstained examples of the same thrombi. (E) Quantification of PS-, CD41-, and Fbg-positive areas relative to total thrombus area. (F). Schematic of affected signaling pathways of platelet PA in PF4cre-CypDfl/fl mice. (G) Cell counts of peripheral blood for the indicated cell types and hematocrit quantification. (H) Experimental scheme of DVT in PF4cre-CypDfl/fl mice as well as thrombus weight (plotted) and incidence (percentage below graph) for n = 8 Cre and n = 13 Cre+ PF4cre-CypD mice. (I) Schematic of affected signaling pathways of platelet PA in wild-type mice treated with the CA inhibitor methazolamide (MZA), which blocks aquaporin-1 (AQP-1)–mediated water influx into the ballooning platelet. (J) Flow cytometry–based measurement of percentage of procoagulant platelets and platelet MFIs for surface PS (measured through annexin V) in peripheral blood samples. Right: hematocrit measurements for mice from both experimental groups. (K) Experimental scheme of DVT and pharmacologic ablation of platelet PA using repetitive intraperitoneal injections of MZA in wild-type mice. (L) Thrombus weight in n = 14 vehicle- and n = 15 MZA-treated Bl6 mice. (M) Representative confocal image of IVC thrombi retrieved from vehicle- or MZA-treated mice. Scale bar = 500 μm. See supplemental Figure 6C for unstained controls. (N) Quantification of CD41- and Fbg-positive areas relative to total thrombus area. (O) Quantification of bleeding times of Bl6 mice undergoing tail section after pretreatment with vehicle or 20 mg/kg BW MZA. Unless otherwise stated, all statistical tests were Student t-test, 2-tailed, unpaired. P values corresponding to asterisks: ∗P < .05, ∗∗P < .01, ∗∗∗P < .005. For the schemes shown in A, F, and I, supplemental Figure 4A-B depicts a more detailed representation of signaling cascades implicated in platelet PA.

References

    1. Martin SS, Aday AW, Almarzooq ZI, et al. 2024 Heart disease and stroke statistics: a report of US and global data from the American Heart Association. Circulation. 2024;149(8):e347–e913. - PubMed
    1. Jackson SP. Arterial thrombosis--insidious, unpredictable and deadly. Nat Med. 2011;17(11):1423–1436. - PubMed
    1. von Bruhl ML, Stark K, Steinhart A, et al. Monocytes, neutrophils, and platelets cooperate to initiate and propagate venous thrombosis in mice in vivo. J Exp Med. 2012;209(4):819–835. - PMC - PubMed
    1. Konstantinides SV, Meyer G, Becattini C, et al. 2019 ESC guidelines for the diagnosis and management of acute pulmonary embolism developed in collaboration with the European Respiratory Society (ERS) Eur Heart J. 2020;41(4):543–603. - PubMed
    1. O’Toole RV, Stein DM, O’Hara NN, et al. Major Extremity Trauma Research Consortium (METRC). Aspirin or low-molecular-weight heparin for thromboprophylaxis after a fracture. N Engl J Med. 2023;388(3):203–213. - PubMed

MeSH terms