. 2025 Jan 8;6(1):38-54.
doi: 10.1158/2643-3230.BCD-24-0118.

Bispecific Antibodies as Bridging to BCMA CAR-T Cell Therapy for Relapsed/Refractory Multiple Myeloma

Affiliations

Bispecific Antibodies as Bridging to BCMA CAR-T Cell Therapy for Relapsed/Refractory Multiple Myeloma

David Fandrei et al. Blood Cancer Discov. .

Abstract

Establishing a strategy for sequencing of T cell-redirecting therapies for relapsed/refractory multiple myeloma (RRMM) is a pressing clinical need. We longitudinally tracked the clinical and immunologic impact of bispecific T cell-engaging antibodies (BsAb) as bridging therapy (BT) to subsequent B-cell maturation antigen-directed chimeric antigen receptor T (CAR-T) cell therapies in 52 patients with RRMM. BsAbs were a potent and safe option for BT, achieving the highest overall response rate (100%) to BT compared with chemotherapy, anti-CD38, or anti-SLAMF7 antibody-based regimens (46%). We observed early CD4+CAR+ and delayed CD8+CAR+ T-cell expansion in patients receiving BsAbs as BT. In vitro cytotoxicity of CAR-T cells was comparable among BT options. Single-cell analyses revealed increased clonality in the CD4+ and CD8+ T-cell compartments in patients with previous exposure to BsAbs at leukapheresis and on day 30 after CAR-T cell infusion. This study demonstrates the feasibility and efficacy of BT with BsAbs for CAR-T cell therapy in RRMM. Significance: CAR-T cell therapy and BsAbs have revolutionized treatment of triple-class refractory multiple myeloma; however, optimal sequencing is unknown. We demonstrate that BT with BsAb before B-cell maturation antigen-directed CAR-T cell therapy is safe and effective, which might have implications for other hematologic malignancies as well. See related commentary by Bal and Costa, p. 10.


Conflict of interest statement

M. Rade reports grants from European Union (CERTAINTY project, Grant Agreement 101136379) during the conduct of the study. M. Kreuz reports grants from European Union (CERTAINTY project, Grant Agreement 101136379) during the conduct of the study. K.H. Metzeler reports grants and personal fees from AbbVie and personal fees from Bristol Myers Squibb, Astellas, Janssen, Novartis, Otsuka, Pfizer, Menarini StemLine, and Servier outside the submitted work. G.-N. Franke reports personal fees from Novartis Pharma GmbH, Germany, Incyte Biosciences GmbH, Germany, and Pfizer, Germany outside the submitted work. U. Köhl reports grants from EU grant imSAVAR, EU grant CERTAINTY, EU grant T2Evolve, BMBF grant SaxoCell, DAAD grant project 57616814, and German José-Carreras Leukemia Foundation during the conduct of the study, as well as grants from AstraZeneca GmbH, Affimed GmbH, ATMPS Ltd., Glycostem Therapeutics, Miltenyi Biotec GmbH, Novartis AG, Zelluna Immunotherapy, and Novo Nordisk Foundation Cellerator outside the submitted work. K. Reiche reports grants from European Union (CERTAINTY project, Grant Agreement 101136379) during the conduct of the study. U. Platzbecker reports grants and personal fees from Bristol Myers Squibb, Janssen, and Curis during the conduct of the study. V. Vucinic reports personal fees from Janssen Cillag, Bristol Myers Squibb, Celgene, Gilead Kite, and Novartis during the conduct of the study, as well as personal fees from MSD, Sobi, Elli Lilly and Company, Mallinckrodt, AstraZeneca, AbbVie, and BeiGene outside the submitted work. M. Merz reports grants from Janssen, SpringWorks, and Roche during the conduct of the study, as well as personal fees from Janssen, Bristol Myers Squibb, Amgen, Takeda, and Pfizer outside the submitted work. No disclosures were reported by the other authors.

Figures
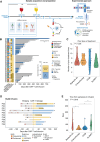
Figure 1.
Figure 1.
Treatment timeline. A, Overview of the sample collection workflow of this study. B, Swimmer plot illustrating individual patients’ type of BT regimen, refractoriness status, response to BT, and response to subsequent CAR-T cell therapy. The barplot shows the distribution of response groups to CAR-T cell therapy evaluated on day 30 after CAR-T infusion. ORR was 78% with a 38% CR rate. C, Violin plots of the numbers of prior lines of treatment in BT groups. D, Timeline of BsAb administration, leukapheresis, and CAR-T cell infusion. Vertical stripes represent each teclistamab and talquetamab infusion (step-up and full doses). Response to BT was evaluated immediately before CAR-T infusion, and subsequent response following CAR-T cell therapy was evaluated consecutively every 30 days after infusion. Arrows represent ongoing responses. E, Violin plots show days from apheresis to CAR-T infusion among the bridging groups. Statistical comparisons across multiple groups in (C) and (E) stated P values for the overall comparisons performed using the Kruskal–Wallis test; pairwise comparisons in (C) and (E) were performed using Wilcoxon rank-sum tests. *, P < 0.05. ASCT, autologous stem cell transplantation; PB, peripheral blood.
Figure 2.
Figure 2.
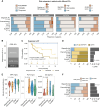
Remission status after BT influences outcome after CAR-T cell therapy. A, Bar plots showing refractoriness status, high-risk cytogenetics [amplification/gain1q, del17/17p, t(4;14), t(14;16)], MyCARe score (14), and R-ISS score (15) stratified by BT regimen. B, Barplot shows response assessed on the day of CAR-T cell infusion, which we defined as response to BT. C, Kaplan–Meier curve shows PFS stratified by response to BT (CR: n = 4, VGPR/PR: n = 26, SD/PD: n = 22; log-rank test; P = 0.035). D, Bar plots indicate distribution of response groups to BT among different types of BT. The P value was computed comparing bispecific antibody vs. other BT groups using Fisher’s exact test. E, Violin plots show maximal post-infusion CRP, IL6, and PCT levels. Daily measurements of IL6 [median: 3 days (range, 0–9)], PCT [median: 2 days (0–4)], and CRP [median: 13 days (7–26)] after CAR-T infusion were performed clinically. Multigroup comparisons using the Kruskal–Wallis test were performed. Pairwise Wilcoxon rank-sum tests did not show any significant differences. F, Proportions of cases in each BT group with CRS requiring tocilizumab administration (CRS + toci), CRS without requiring tocilizumab (CRS − toci), and without CRS (no CRS). In the BsAb group, there was a trend toward a lower rate of CRS; however, it was not statistically significant (bispecific antibody vs. other, 50% vs. 81%, Fisher’s exact test; P = 0.1). Ab, antibody; CRP, C-reactive protein; HR, high risk; PCT, procalcitonin; R-ISS, Revised International Staging System; TCexposed, triple class exposed.
Figure 3.
Figure 3.
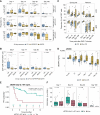
Expansion of infused CAR-T cells and their characteristics. A, Boxplots show expansion of CAR-T cells with CD3+CAR+/total CD3+, CD4+CAR+/CD3+CAR+, and CD8+CAR+/CD3+CAR+ fractions at leukapheresis and on days 7, 14, 30, and 100 after CAR-T cell infusion, stratified by response evaluated on day 30. B, Boxplots show CD4+CAR+/CD8+CAR+ ratio across all time points stratified by response evaluated on day 30. Median CD4+CAR+/CD8+CAR+ ratio was significantly elevated on day 7 in CR patients compared with VGPR/PR and PD patients (Kruskal-Wallis test; P = 0.02). C, Boxplots indicate proportions of CD4+CAR+ and CD8+CAR+ cells which express cytotoxic markers granzyme and perforin measured longitudinally by flow cytometry in 21 patients, comparing CR and non-CR patients. D, sBCMA levels (ng/mL) before BT, at the time of leukapheresis, on the day of CAR-T cell infusion (0), and on days 7, 30, and 100 after infusion, in CR vs. non-CR patients. E, Kaplan–Meier curve shows PFS stratified by sBCMA concentration larger vs. lower than 467 ng/mL on the day of CAR-T cell infusion. The cutpoint was determined through the maximally selected log-rank statistic. The P value was calculated using the log-rank test. F, Boxplots show expansion of CAR-T cells with CD3+CAR+/total CD3+ ratio in patients with larger vs. lower than 467 ng/mL sBCMA on the day of CAR-T cell infusion. Boxplots in (A–D), and (F) indicate median and IQR. Statistical comparisons across multiple groups in (A–D) stated P values for the overall comparisons performed using the Kruskal–Wallis test; pairwise comparisons in (A–D), and (F) were performed using Wilcoxon rank-sum tests. *, P < 0.05; **, P < 0.01 Grz, granzyme; Pfr, perforin.
Figure 4.
Figure 4.
Influence of BT on CAR-T cell expansion, in vitro cytotoxic capacity, and sBCMA levels. A, Boxplots show expansion of CAR-T cells with CD3+CAR+/total CD3+, CD4+CAR+/total CD3+CAR+, and CD8+CAR+/total CD3+CAR+ proportions at leukapheresis and on days 7, 14, 30, and 100 after CAR-T cell infusion, stratified by type of BT. Proportions of CD3+CAR+/total CD3+ cells were equal across all time points with different BT regimens. Early expansion of CD4+CAR+ and delayed expansion of CD8+CAR+ cells were observed in patients who received BT with BsAb. B, Boxplots show CD4+CAR+/CD8+CAR+ ratio across all time points in the BsAb vs. other BT groups. CD4+CAR+/CD8+CAR+ ratio was significantly elevated on day 7 in the BsAb group (Wilcoxon rank-sum test; P = 0.03). C, Boxplots of total CD4+/CD8+ ratio in BsAb vs. other BT regimens at leukapheresis and on days 0, 7, 14, 30, and 100 after CAR-T cell infusion. D,In vitro cytotoxic capacity was evaluated by incubating ex vivo expanded patient T cells obtained on day 0 and 7 after CAR-T infusion with the myeloma cell line U266. Boxplots show killing rates of U266 cells after incubation for 24 hours with T cells obtained on day 0 and day 7 after CAR-T infusion. Proportions of CAR-T cells in the cultures from day 7 among BT groups are depicted in Supplementary Fig. S6 and for individual patients in Supplementary Table S2. E, Boxplots of sBCMA levels in patients who received teclistamab (n = 5), talquetamab (n = 5) vs. other BT regimens (n = 36) at the time of leukapheresis, on the day of CAR-T cell infusion (0), and on days 30 and 100 after infusion. Boxplots in (A–E) indicate median and IQR. Statistical comparisons across multiple groups in (A, D, and E) stated P values for the overall comparisons performed using the Kruskal–Wallis test; pairwise comparisons in (A–E) were performed using Wilcoxon rank-sum tests. *, P < 0.05. Ab, antibody; LA, leukapheresis.
Figure 5.
Figure 5.
Differentiation of nontransduced T cells and T-cell exhaustion. A, Total numbers of Tregs across all time points in different BT groups. Statistical comparisons across multiple groups stated P values for the overall comparisons performed using the Kruskal–Wallis test. B, Heatmap showing relative abundance of T-cell subsets in patients who received BsAb vs. other types of BT. P values were computed using Wilcoxon rank-sum tests. C, Violin plots of proportions of CD4+CAR+ and CD8+CAR+ cells expressing immune checkpoint markers PD-1, TIGIT, TIM3, LAG-3, and VISTA in patients who received BsAb vs. other types of BT. For PD-1, data were available for n = 9 BsAb and n = 39 other BT patients. For all other checkpoint markers, data were available for n = 3 BsAb and n = 7 other BT patients. D, Longitudinal development of PD-1+CD4+ and PD-1+CD8+ in the BsAb group (n = 9) and other BT regimens (n = 39). Jonckheere–Terpstra test was used to test whether there was a significant trend across analysis time points. E, Exhaustion score in single-cell transcriptomic data of CD4+ and CD8+ T cell subsets in BsAb vs. other BT patients at leukapheresis and on days 30 and 100 after CAR-T cell infusion. Boxplots in (A) and (C) indicate median and IQR. Pairwise comparisons in (A–C) were performed using Wilcoxon rank-sum tests. *, P < 0.05; ***, P < 0.001. Ab, antibody; LA, leukapheresis; ns, not significant.
Figure 6.
Figure 6.
Expansion of T-cell receptor (TCR) clonotypes and BCMA expression in patients who received BT with teclistamab. A, Boxplots of Shannon diversity index in CD4+ and CD8+ T cells based on TCR clonotypes at leukapheresis, and on days 30 and 100 after CAR-T cell infusion in BsAb vs. other BT options. B, Boxplots of proportions of singleton CD4+ and CD8+ T-cell clones in BsAb vs. other BT options at leukapheresis and on days 30 and 100 after CAR-T cell infusion. C, Barplots revealing the proportions of different T-cell subsets in TCR clonotype groups in BsAb vs. other BT patients. D, Violin plots showing expression of TNFRSF17 in transcriptomic and (E) BCMA in surface protein data in patients who received BT with teclistamab vs. other BT. Boxplots in (A and B) indicate median and IQR. Pairwise comparisons in (A, B, D, and E) were performed using Wilcoxon rank-sum tests. Ab, antibody; ADT, antibody-derived tags; LA, leukapheresis.

References

    1. Mateos M-V, Weisel K, De Stefano V, Goldschmidt H, Delforge M, Mohty M, et al. LocoMMotion: a prospective, non-interventional, multinational study of real-life current standards of care in patients with relapsed and/or refractory multiple myeloma. Leukemia 2022;36:1371–6. - PMC - PubMed
    1. Gandhi UH, Cornell RF, Lakshman A, Gahvari ZJ, McGehee E, Jagosky MH, et al. Outcomes of patients with multiple myeloma refractory to CD38-targeted monoclonal antibody therapy. Leukemia 2019;33:2266–75. - PMC - PubMed
    1. Lesokhin AM, Tomasson MH, Arnulf B, Bahlis NJ, Miles Prince H, Niesvizky R, et al. Elranatamab in relapsed or refractory multiple myeloma: phase 2 MagnetisMM-3 trial results. Nat Med 2023;29:2259–67. - PMC - PubMed
    1. Chari A, Minnema MC, Berdeja JG, Oriol A, van de Donk NWCJ, Rodríguez-Otero P, et al. Talquetamab, a T-cell-redirecting GPRC5D bispecific antibody for multiple myeloma. N Engl J Med 2022;387:2232–44. - PubMed
    1. Moreau P, Garfall AL, van de Donk NWCJ, Nahi H, San-Miguel JF, Oriol A, et al. Teclistamab in relapsed or refractory multiple myeloma. N Engl J Med 2022;387:495–505. - PMC - PubMed

Substances