. 2025 Jan;99(1):309-332.
doi: 10.1007/s00204-024-03876-2. Epub 2024 Oct 23.

Evaluating the performance of multi-omics integration: a thyroid toxicity case study

Affiliations

Evaluating the performance of multi-omics integration: a thyroid toxicity case study

Sebastian Canzler et al. Arch Toxicol. 2025 Jan.

Abstract

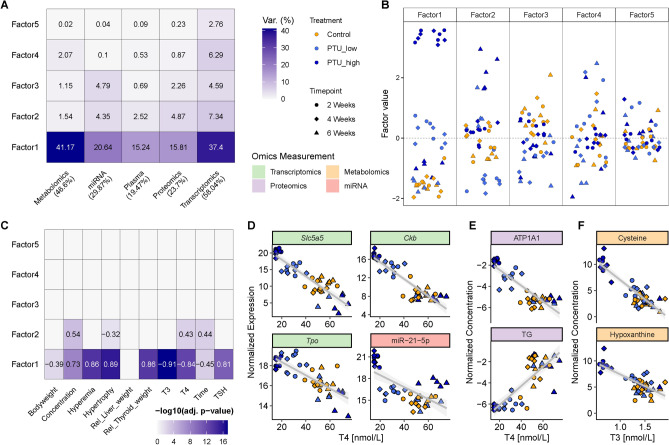
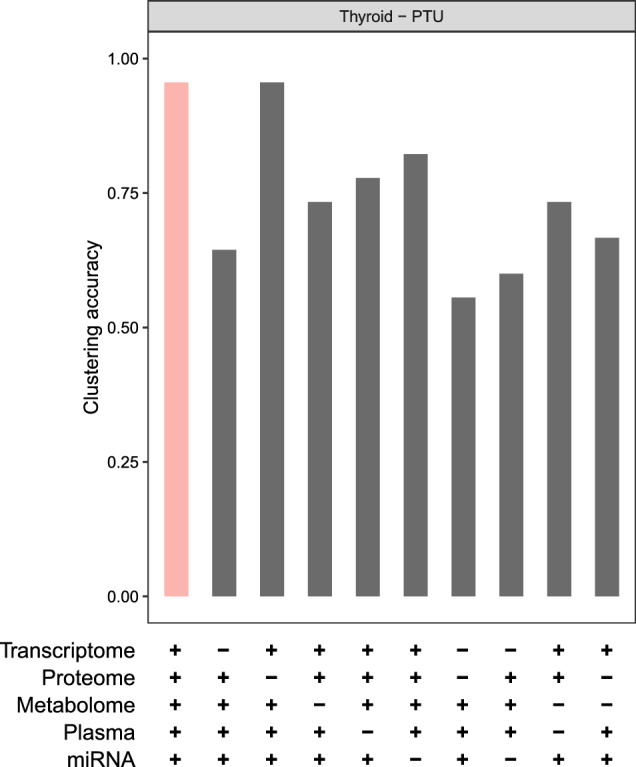
Multi-omics data integration has been repeatedly discussed as the way forward to more comprehensively cover the molecular responses of cells or organisms to chemical exposure in systems toxicology and regulatory risk assessment. In Canzler et al. (Arch Toxicol 94(2):371-388. https://doi.org/10.1007/s00204-020-02656-y ), we reviewed the state of the art in applying multi-omics approaches in toxicological research and chemical risk assessment. We developed best practices for the experimental design of multi-omics studies, omics data acquisition, and subsequent omics data integration. We found that multi-omics data sets for toxicological research questions were generally rare, with no data sets comprising more than two omics layers adhering to these best practices. Due to these limitations, we could not fully assess the benefits of different data integration approaches or quantitatively evaluate the contribution of various omics layers for toxicological research questions. Here, we report on a multi-omics study on thyroid toxicity that we conducted in compliance with these best practices. We induced direct and indirect thyroid toxicity through Propylthiouracil (PTU) and Phenytoin, respectively, in a 28-day plus 14-day recovery oral rat toxicity study. We collected clinical and histopathological data and six omics layers, including the long and short transcriptome, proteome, phosphoproteome, and metabolome from plasma, thyroid, and liver. We demonstrate that the multi-omics approach is superior to single-omics in detecting responses at the regulatory pathway level. We also show how combining omics data with clinical and histopathological parameters facilitates the interpretation of the data. Furthermore, we illustrate how multi-omics integration can hint at the involvement of non-coding RNAs in post-transcriptional regulation. Also, we show that multi-omics facilitates grouping, and we assess how much information individual and combinations of omics layers contribute to this approach.

Keywords: Chemical exposure; Data integration; Multi-omics; Risk assessment; Toxicology.


Conflict of interest statement

Declarations. Conflict of interest: The authors declare that they have no potential conflict of interest.

Figures

Fig. 1
Fig. 1
Clinical and histopathological readouts and single-omics data analysis of thyroid and liver samples. A Serum thyroid hormone levels, thyroid weight (relative to body weight), and histopathological findings in the thyroid for PTU-treated samples. The severity of hypertrophy and hyperemia is graded from 0 to 5, with 5 being the most severe. Ten animals per treatment group were summarized. Boxes and violins in all facets are grouped in the following order: controls, low-dose, and high-dose PTU. B Serum thyroid hormone levels, liver weight (relative to body weight), and histopathological findings in the liver for Phenytoin-treated samples. The severity is graded from 0 to 5, with 5 being the most severe. Ten animals per treatment group were summarized. Boxes and violins in all facets are grouped in the following order: controls, low-dose, and high-dose Phenytoin. C Proteomics PCA of all 75 liver samples. D Transcriptomics PCA of all 75 thyroid samples. E Summary of single-omics data analysis concerning tissue and treatment. Significantly altered features in the transcriptomics, proteomics, tissue metabolomics, and short RNA-Seq data are shown for liver and thyroid samples, while plasma metabolomics results are shown for plasma. The FDR threshold was set to 0.01. For simplicity, only a subset of contrasts is shown: low- and high-dose treatments of 2 and 4 weeks against their respective controls and recovery samples against their respective 4 week treatment. Phosphoproteomics yielded no differentially altered phosphorylation sites in the shown contrasts and hence was not considered here. F Comparison of differentially expressed genes of high-dose PTU treatment for 2 and 4 weeks in the thyroid samples. Log2 fold changes of both contrasts are plotted against each other for those genes that were differentially expressed in one (light and dark blue) or both contrasts (red). The Pearson correlation of log2 fold changes was calculated for DEGs found in both contrasts (red) and DEGs exclusively found in one contrast (black)
Fig. 2
Fig. 2
Multi-omics data integration with MEFISTO using clinical and histopathological covariates for the thyroid PTU samples. A Variance captured across omics layers and latent factors. The percentage of overall variance is color-coded. B Visualization of each factor capturing the global source of variability. C Heatmap showing the correlation of clinical and histopathological parameters with factor values. The Pearson correlation is written within the cell when the correlation is significant. The significance level is color-coded. DF Correlation of normalized expression or concentration of selected (short) transcripts (D), proteins (E), and metabolites (F) with high LF1 feature weight against serum T4 and T3 levels
Fig. 3
Fig. 3
Comparison of single- and multi-omics-based pathway enrichments. All enrichments were calculated using multiGSEA. Single-omics and the log2 fold change-based multi-omics enrichment (Multi-Seq) used results of the previous differential expression analysis. At the same time, the Multi-Sim approach utilized the MEFISTO-derived factor weights as a ranking metric. Subfigures AC indicate comparisons in the thyroid PTU model, while subfigure D is based on the liver Phenytoin model. A Comparison of the number of enriched pathways between single- and multi-omics pathway enrichments. B Boxplot indicating the significance level of all pathways that were significantly enriched with at least one enrichment approach (FDR < 0.05). C Comparing PTU-induced molecular target pathways in thyroid samples. D Comparing Phenytoin-induced molecular target pathways in liver samples
Fig. 4
Fig. 4
Clustering of PTU-treated samples based on the Euclidean distance of their MEFISTO-derived factor weights. A Cluster dendrogram of the multi-omics model. Bootstrap support for a subtree is written in red at each respective node. Samples colored in orange, blue, and coral indicate controls, PTU treatments, and recovery samples, respectively. The time and dose parameters were neglected in this clustering. B Comparison of cluster accuracy of single-omics and multi-omics MEFISTO models. For each model, the clustering was automatically split into the three largest subclusters (indicated by the dashed lines in A). Each subcluster was assigned to a particular treatment group based on the majority of its samples. The accuracy was then calculated separately for each treatment group against its respective cluster
Fig. 5
Fig. 5
Assessing the clustering contribution of omics layers in the multi-omics thyroid PTU model. The barplot indicates the clustering accuracy of each model, as described previously. ‘+’ and ‘−’ signs below the barplot indicate which particular omics layer is present in the multi-omics model

Similar articles

Cited by

  • An extended miRNA repertoire in Rattus norvegicus.
    Lehmann J, Yazbeck A, Hackermüller J, Canzler S. Lehmann J, et al. Front Bioinform. 2025 Mar 10;5:1545680. doi: 10.3389/fbinf.2025.1545680. eCollection 2025. Front Bioinform. 2025. PMID: 40130010 Free PMC article. No abstract available.

References

    1. Abdelkader Y, Perez-Davalos L, LeDuc R, Zahedi RP, Labouta HI (2023) Omics approaches for the assessment of biological responses to nanoparticles. Adv Drug Deliv Rev 200:114992. 10.1016/j.addr.2023.114992 - PubMed
    1. Amorim MJB, Peijnenburg W, Greco D, Saarimäki LA, Dumit VI, Bahl A, Haase A, Tran L, Hackermüller J, Canzler S, Scott-Fordsmand JJ (2023) Systems toxicology to advance human and environmental hazard assessment: a roadmap for advanced materials. Nano Today 48:101735. 10.1016/j.nantod.2022.101735 (https://www.sciencedirect.com/science/article/pii/S1748013222003632)
    1. Anders S, Pyl PT, Huber W (2015) HTSeq-a Python framework to work with high-throughput sequencing data. Bioinformatics 31(2):166–9. 10.1093/bioinformatics/btu638 - PMC - PubMed
    1. Argelaguet R, Velten B, Arnol D, Dietrich S, Zenz T, Marioni JC, Buettner F, Huber W, Stegle O (2018) Multi-Omics Factor Analysis-a framework for unsupervised integration of multi-omics data sets. Mol Syst Biol 14(6):e8124. 10.15252/msb.20178124 - PMC - PubMed
    1. Baek D, Villén J, Shin C, Camargo FD, Gygi SP, Bartel DP (2008) The impact of microRNAs on protein output. Nature 455(7209):64–71. 10.1038/nature07242 - PMC - PubMed

LinkOut - more resources