. 2024 Dec;120(5):1857-1879.
doi: 10.1111/tpj.17084. Epub 2024 Oct 23.

Daily glycome and transcriptome profiling reveals polysaccharide structures and correlated glycosyltransferases critical for cotton fiber growth

Affiliations

Daily glycome and transcriptome profiling reveals polysaccharide structures and correlated glycosyltransferases critical for cotton fiber growth

Sivakumar Swaminathan et al. Plant J. 2024 Dec.

Abstract

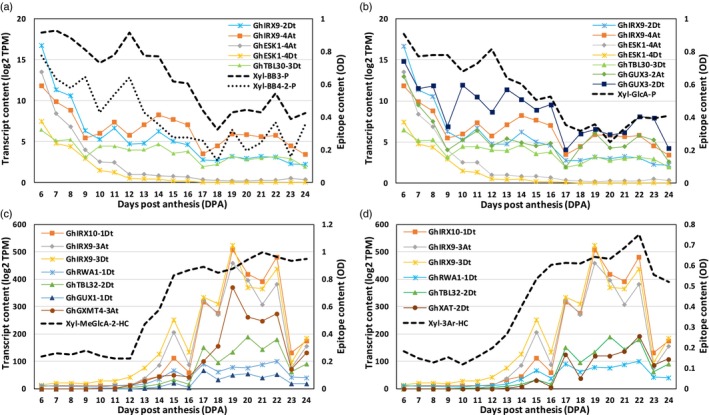
Cotton fiber is the most valuable naturally available material for the textile industry and the fiber length and strength are key determinants of its quality. Dynamic changes in the pectin, xyloglucan, xylan, and cellulose polysaccharide epitope content during fiber growth contribute to complex remodeling of fiber cell wall (CW) and quality. Detailed knowledge about polysaccharide compositional and structural alteration in the fiber during fiber elongation and strengthening is important to understand the molecular dynamics of fiber development and improve its quality. Here, large-scale glycome profiling coupled with fiber phenotype and transcriptome profiling was conducted on fiber collected daily covering the most critical window of fiber development. The profiling studies with high temporal resolution allowed us to identify specific polysaccharide epitopes associated with distinct fiber phenotypes that might contribute to fiber quality. This study revealed the critical role of highly branched RG-I pectin epitopes such as β-1,4-linked-galactans, β-1,6-linked-galactans, and arabinogalactans, in addition to earlier reported homogalacturonans and xyloglucans in the formation of cotton fiber middle lamella and contributing to fiber plasticity and elongation. We also propose the essential role of heteroxylans (Xyl-MeGlcA and Xyl-3Ar), as a guiding factor for secondary CW cellulose microfibril arrangement, thus contributing to fiber strength. Correlation analysis of profiles of polysaccharide epitopes from glycome data and expression profiles of glycosyltransferase-encoding genes from transcriptome data identified several key putative glycosyltransferases that are potentially involved in synthesizing the critical polysaccharide epitopes. The findings of this study provide a foundation to identify molecular factors that dictate important fiber traits.

Keywords: Gossypium hirsutum; cellulose; cotton fiber; glycome profiling; glycosyltransferases; pectin; polysaccharide epitopes; transcriptome profiling; xylan; xyloglucan.


Conflict of interest statement

The authors declare no conflict of interest.

Figures

Figure 1
Figure 1
Polysaccharide content and their monosaccharide composition of cotton fiber cell walls during development (6–25 DPA). (a) Polysaccharide content of cotton fibers cell wall (CW). Cotton fiber CW content was fractionated into pectin, hemicellulose, and cellulose polysaccharides, dried, and weighed. The graph represents the polysaccharides content in % and it is calculated by keeping the CW weight at 100%. The data are average from three biological replicates. (b) Monosaccharides content of the buffer soluble pectin‐enriched fractions (in mol%). The data are average from three biological replicates. (c) Monosaccharides content of the alkali‐soluble hemicellulose enriched fractions (in mol%). The data are average from three biological replicates.
Figure 2
Figure 2
Pictorial representation of structures of analyzed cell wall (CW) polysaccharides epitopes and glycosyltransferase enzymes involved in their synthesis. The schematic structure of Rhamnogalacturonan‐I (RG‐I) pectic polysaccharide displays different epitopes like backbones (RG‐I‐BB and Gal4‐BB), β‐1,6‐linked galactans (RG‐I‐Gal1, RG‐I‐Gal2, and RG‐I‐Gal3), and arabinogalactans (AG and AGP‐Ga). Cellulose and callose polysaccharides are made up of glucose molecules connected by β‐1,4‐ and β‐1,3‐linkages, respectively. Homogalacturonan (HG) pectic polysaccharide displays two different epitopes, methyl‐esterified HG (HG‐BBMe) and de‐esterified HG (HG‐BBde). Xyloglucan (XG) structure shows, xylosylated XG (XG‐XXXG), galactosylated XG (XG‐XLLG), and fucosylated XG (XG‐F) epitopes. The schematic structures of xylans show the backbone (Xyl‐BB), arabinoxylans (Xyl‐2Ar and Xyl‐3Ar), and methylated‐glucuronoxyaln (Xyl‐MeGlcA) epitopes. Refer to Table S3 for the details of the epitopes recognized by the antibodies used in this study. The known or putative Arabidopsis CW synthesizing glycosyltransferase enzymes are denoted by black dotted arrows.
Figure 3
Figure 3
Self‐organizing map (SOM) and heat map of the epitope patterns obtained from glycome profiling. (a, b) SOM grouping of the glycome epitope patterns of buffer soluble (50 mm CDTA–50 mm ammonium oxalate extract) polysaccharide fractions and the corresponding heat map, respectively. (c, d) SOM grouping of alkali‐soluble (4 m KOH extract) polysaccharide fractions and the corresponding heat map, respectively. SOM shows that there are 20 groups (G1–G20) within each fraction and the number in blue font denotes the number of epitopes fall within each SOM group. The data are average from three biological replicates. Epitopes from either buffer‐soluble pectin‐enriched (50 mm CDTA–50 mm ammonium oxalate extract) or alkali‐soluble hemicellulose‐enriched (4 m KOH extract) fractions are denoted by the suffix “‐P” and “‐HC”, respectively. Refer to Table S6 for the details of epitopes that fall within each SOM group. Heat maps were generated in Excel and the epitope abundances were standardized from 0 (blue) to 1 (red). Heat maps show the consistency of epitope content from 6 to 25 DPA between the three replicates sampled.
Figure 4
Figure 4
Glycome profile of polysaccharide epitopes that are highly abundant at early stages and reduced during Gossypium hirsutum fiber development (6–25 DPA). (a) Profile of representative pectin epitopes that decreased slowly (listed in Table 1). (b) Profile of representative xyloglucan (XG) or pectin epitopes that decreased drastically at 16 DPA (listed in Table 1). (c) Profile of representative xylan (xyl) epitopes that decreased at a faster rate gradually (listed in Table 1). The data are mean from three biological replications along with standard error bars. Epitopes from either buffer soluble (50 mm CDTA–50 mm ammonium oxalate extract) or alkali‐soluble (4 m KOH extract) fractions are denoted by the suffix “‐P” and “‐HC”, respectively. The pectin and hemicellulose epitope profiles are color‐coded by blue and green, respectively.
Figure 5
Figure 5
Glycome profile of polysaccharide epitopes that are low at early stages and increased during Gossypium hirsutum fiber development (6–25 DPA). (a) Profile of representative epitopes that increased drastically at 12 DPA (listed in Table 2). (b) Profile of the epitopes that increased gradually from the beginning (listed in Table 2). The data are mean from three biological replications along with standard error bars. Epitopes from alkali‐soluble (4 m KOH extract) fractions are denoted by the suffix “‐HC.” The pectin and hemicellulose epitopes‐profile are color‐coded by blue and green, respectively.
Figure 6
Figure 6
Glycome profile of polysaccharide epitopes that peaked high at mid‐stage of Gossypium hirsutum fiber development (6–25 DPA). (a) Profile of polysaccharide epitopes reached the peak at 12 DPA (listed in Table 3). (b) Profile of polysaccharide epitopes reached the peak at 16 DPA (listed in Table 3). The data are mean from three biological replications along with standard error bars. Epitopes from either buffer‐soluble (50 mm CDTA–50 mm ammonium oxalate extract) or alkali‐soluble (4 m KOH extract) fractions are denoted by the suffix “‐P” and “‐HC”, respectively. The pectin and hemicellulose epitopes‐profile are color‐coded by blue and green, respectively.
Figure 7
Figure 7
Glycome profile of polysaccharide epitopes having high abundance and horizontal pattern during Gossypium hirsutum fiber development (6–25 DPA). (a) Profile of the representative pectin (HG/RG‐I)/callose (Cal) polysaccharide epitopes listed in Table 4. (b) Profile of the representative xyloglucan (XG) polysaccharide epitopes listed in Table 4. (c) Profile of the representative xylan (Xyl) polysaccharide epitopes listed in Table 4. The data are mean from three biological replications along with standard error bars. Epitopes from alkali‐soluble hemicellulose‐enriched fractions are denoted by the suffix “‐HC.” The pectin and hemicellulose epitopes‐profile are color‐coded by blue and green, respectively.
Figure 8
Figure 8
Profiles of fiber phenotypes and the correlated polysaccharide epitopes. (a) Profile of percentage fiber growth rate and few of the representative correlated polysaccharide epitopes. (b) Profile of fiber turgor pressure and few of the representative correlated polysaccharide epitopes. (c) Profile of microfibril orientation and the correlated polysaccharide epitopes. (d) Profile of fiber cell wall crystalline cellulose and the correlated polysaccharide epitopes. Refer to Table S7 for the full list of correlated and non‐correlated epitopes.
Figure 9
Figure 9
Profiles of pectin epitopes and the correlated transcripts profiles of glycosyltransferases involved in synthesizing these epitopes. (a) Profile of homogalacturonan epitopes (HG‐Bbde‐P and HG‐BBMe‐P) and correlated representative transcripts. (b) Profile of RG‐I primary backbone epitopes (RG‐I‐BB1‐P and RG‐I‐BB2‐P) and correlated representative transcripts. (c) Profile of RG‐I secondary backbone β‐1,4 linked galactan epitopes (Gal4‐BB3‐HC and Gal4‐BB6‐HC) and correlated representative transcripts. (d) Profile of RG‐I‐β‐1,6 linked galactan epitopes (content going down) (RG‐I‐Gal1‐3‐P and RG‐I‐Gal3‐2‐P) and correlated representative transcripts. (e) Profile of RG‐I‐β‐1,6 linked galactan epitopes (content going up) (RG‐I‐Gal1‐2‐HC and RG‐I‐Gal3‐7‐HC) and correlated representative transcripts. (f) Profile of Arabinogalactan epitopes (AG‐3‐2‐P and AGP‐Ga‐P) and correlated representative transcripts. Refer to Table S8b–h for the full list of correlated and non‐correlated transcripts. Refer to Figure 2 for the details of epitope structures and the CW synthesizing enzymes involved.
Figure 10
Figure 10
Profiles of xylan epitopes and the correlated transcripts profiles of glycosyltransferases involved in synthesizing these epitopes. (a) Profile of xylan backbone epitopes (Xyl‐BB3‐P and Xyl‐BB4‐2‐P) and correlated representative transcripts. (b) Profile of glucuronoxylan epitope (Xyl‐GlcA‐P) and correlated representative transcripts. (c) Profile of methylated glucuronoxylan epitope (Xyl‐MeGlcA‐HC) and correlated representative transcripts. (d) Profile of arabinoxylan epitope (Xyl‐3Ar‐HC) and correlated representative transcripts. Refer to Table S8b,i–l for the full list of correlated and non‐correlated transcripts. Refer to Figure 2 for the details of epitope structures and the CW synthesizing enzymes involved.
Figure 11
Figure 11
Profiles of callose/xyloglucan epitopes and the correlated transcripts profiles of glycosyltransferases involved in synthesizing these epitopes. (a) Profile of callose epitope (Callose‐P) and correlated representative transcripts. (b) Profile of xylosylated xyloglucan epitopes [XG‐XX‐1‐P and XG‐(XXXG)2‐2‐P] and correlated representative transcripts. (c) Profile of galactosylated xyloglucan epitopes (XG‐XLX‐1‐P and XG‐L‐1‐P) and correlated representative transcripts. (d) Profile of fucosylated xyloglucan epitopes (Fuc‐P and XG‐FF‐1‐P) and correlated representative transcripts. Refer to Table S8b,m–p for the full list of correlated and non‐correlated transcripts. Refer to Figure 2 for the details of epitope structures and the CW synthesizing enzymes involved.

Similar articles

Cited by

References

    1. Abidi, N. , Cabrales, L. & Haigler, C.H. (2014) Changes in the cell wall and cellulose content of developing cotton fibers investigated by FTIR spectroscopy. Carbohydrate Polymers, 100, 9–16. - PubMed
    1. Amos, R.A. , Atmodjo, M.A. , Huang, C. , Gao, Z. , Venkat, A. , Taujale, R. et al. (2022) Polymerization of the backbone of the pectic polysaccharide rhamnogalacturonan I. Nature Plants, 8, 1289–1303. - PMC - PubMed
    1. An, C. , Saha, S. , Jenkins, J.N. , Scheffler, B.E. , Wilkins, T.A. & Stelly, D.M. (2007) Transcriptome profiling, sequence characterization, and SNP‐based chromosomal assignment of the EXPANSIN genes in cotton. Molecular Genetics and Genomics, 278, 539–553. - PubMed
    1. Applequist, W.L. , Cronn, R. & Wendel, J.F. (2001) Comparative development of fiber in wild and cultivated cotton. Evolution and Development, 3, 3–17. - PubMed
    1. Atalla, R.H. , Hackney, J.M. , Uhlin, I. & Thompson, N.S. (1993) Hemicelluloses as structure regulators in the aggregation of native cellulose. International Journal of Biological Macromolecules, 15, 109–112. - PubMed

LinkOut - more resources