. 2024 Oct 23;19(10):e0310845.
doi: 10.1371/journal.pone.0310845. eCollection 2024.

Portable X-ray fluorescence of zinc and selenium with nail clippings-Mother and Infant Nutrition Investigation (MINI)

Affiliations

Portable X-ray fluorescence of zinc and selenium with nail clippings-Mother and Infant Nutrition Investigation (MINI)

David E B Fleming et al. PLoS One. .

Abstract

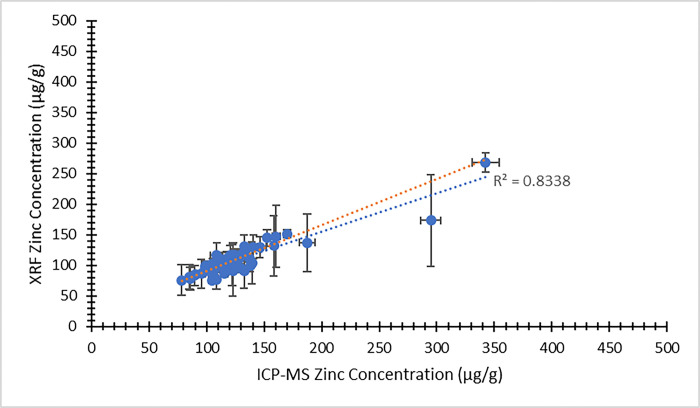
Zinc and selenium are essential minerals for human nutrition. Reliable biomarkers of zinc status and selenium status in humans are therefore important. This work investigates a novel portable X-ray fluorescence (XRF) method with the ability to rapidly assess zinc and selenium in nail clippings. This approach used a mono-energetic X-ray beam to excite characteristic X-rays from the clippings. Nail clippings were obtained from the Mother and Infant Nutrition Investigation (MINI), a study designed to assess nutrition in a population of women and their breastfed children in New Zealand. Twenty mother-infant pairings were selected to provide nail clippings at two time points (visit 1 at 3 months postpartum; visit 2 at 6 months postpartum). Nail clippings from each mother-infant pairing were divided into three groupings of clippings prior to analysis: those obtained from a big toe of the mother, those from the other toes of the mother, and those from the toes and fingers of the infant. Clippings were prepared and mounted prior to XRF measurement, providing four distinct fragments from each clipping grouping. These fragments were assessed by XRF using a measurement time of either 300 s (visit 1) or 180 s (visit 2). XRF results were determined through both an automated system output and an analysis of the X-ray energy spectrum. Following this assessment of zinc and selenium with the non-destructive XRF method, clippings were measured for zinc and selenium concentration using a "gold standard" technique of inductively coupled plasma mass spectrometry (ICP-MS). Mean ICP-MS concentrations ranged from 122 μg/g to 127 μg/g for zinc, and from 0.646 μg/g to 0.659 μg/g for selenium. Precision, assessed by a relative standard deviation of measurement, was superior for ICP-MS relative to XRF. For both zinc and selenium, XRF results were compared with ICP-MS concentrations. Linear equations of best fit were determined for each comparison between XRF and ICP-MS results. Coefficients of determination (r2) were stronger for zinc (from 0.74 to 0.95) than selenium (from 0.53 to 0.70). A decrease in XRF measurement time from 300 s to 180 s did not appear to adversely affect the correlation between XRF and ICP-MS results. Using the mono-energetic portable XRF method, the correlation of XRF zinc results with ICP-MS zinc concentrations was improved over previous findings, and selenium measurement was reported for the first time. The method may prove useful for future applications to trace element analysis using nail clippings as a biomarker.


Conflict of interest statement

The authors have declared that no competing interests exist.

Figures

Fig 1
Fig 1. Sample cells containing nail clipping fragments prepared for XRF analysis.
The three cells shown are from a single mother-infant pairing and contain, from left to right: fragments from a big toe of a mother, from other toes of a mother, and from toes and fingers of an infant. For each cell, the four fragments are labeled corresponding to the numerical order of their measurement.
Fig 2
Fig 2. Energy spectrum from XRF measurement of a nail clipping.
Counts are provided as a function of energy (keV). The red line indicates the PyMca fit for various elements, while the green line represents the background continuum. Observed data points are given in black and are mostly obscured by the red fit line.
Fig 3
Fig 3. XRF system output zinc concentration (μg/g) as a function of ICP-MS zinc concentration (μg/g) for nail clippings from visit 1 of the MINI study.
Uncertainty bars are provided for each data point. The unweighted best fit linear relationship between the variables is displayed as a blue dotted line and the weighted best fit linear relationship is displayed as an orange dotted line.
Fig 4
Fig 4. XRF system output zinc concentration (μg/g) as a function of ICP-MS zinc concentration (μg/g) for nail clippings from visit 2 of the MINI study.
Uncertainty bars are provided for each data point. The unweighted best fit linear relationship between the variables is displayed as a blue dotted line and the weighted best fit linear relationship is displayed as an orange dotted line.
Fig 5
Fig 5. Bland-Altman plot of the percentage difference between XRF and ICP-MS zinc concentration results as a function of ICP-MS zinc concentration from visit 1 of the MINI study.
The mean result is given as a bold horizontal line, with confidence interval limits given as lines above and below the mean.
Fig 6
Fig 6. Bland-Altman plot of the percentage difference between XRF and ICP-MS zinc concentration results as a function of ICP-MS zinc concentration from visit 2 of the MINI study.
The mean result is given as a bold horizontal line, with confidence interval limits given as lines above and below the mean.
Fig 7
Fig 7. XRF Total Area Ratio (TAR) zinc signal as a function of ICP-MS zinc concentration (μg/g) for nail clippings from visit 1 of the MINI study.
Uncertainty bars are provided for each data point. The unweighted best fit linear relationship between the variables is displayed as a blue dotted line and the weighted best fit linear relationship is displayed as an orange dotted line.
Fig 8
Fig 8. XRF Total Area Ratio (TAR) zinc signal as a function of ICP-MS zinc concentration (μg/g) for nail clippings from visit 2 of the MINI study.
Uncertainty bars are provided for each data point. The unweighted best fit linear relationship between the variables is displayed as a blue dotted line and the weighted best fit linear relationship is displayed as an orange dotted line.
Fig 9
Fig 9. XRF Total Area Ratio (TAR) selenium signal as a function of ICP-MS selenium concentration (μg/g) for nail clippings from visit 1 of the MINI study.
Uncertainty bars are provided for each data point. The unweighted best fit linear relationship between the variables is displayed as a blue dotted line and the weighted best fit linear relationship is displayed as an orange dotted line.
Fig 10
Fig 10. XRF Total Area Ratio (TAR) selenium signal as a function of ICP-MS selenium concentration (μg/g) for nail clippings from visit 2 of the MINI study.
Uncertainty bars are provided for each data point. The unweighted best fit linear relationship between the variables is displayed as a blue dotted line and the weighted best fit linear relationship is displayed as an orange dotted line.

Similar articles

Cited by

References

    1. Brown KH, Peerson JM, Rivera J, Allen LH. Effect of supplemental zinc on the growth and serum zinc concentrations of prepubertal children: a meta-analysis of randomized controlled trials. Am J Clin Nutr. 2002; 75: 1062–1071. doi: 10.1093/ajcn/75.6.1062 - DOI - PubMed
    1. Skrovanek S, DiGuilio K, Bailey R, Huntington W, Urbas R, Mayilvaganan B, et al.. Zinc and gastrointestinal disease. World J Gastrointest Pathophysiol. 2014; 5: 496–513. doi: 10.4291/wjgp.v5.i4.496 - DOI - PMC - PubMed
    1. Walker CF, Black RE. Zinc and the risk for infectious disease. Ann Rev Nutr. 2004; 24: 255–275. - PubMed
    1. Kawahara M, Tanaka K, Kato-Negishi M. Zinc, carnosine, and neurodegenerative diseases. Nutrients. 2018; 10: 147. doi: 10.3390/nu10020147 - DOI - PMC - PubMed
    1. Solovyev ND. Importance of selenium and selenoprotein for brain function: From antioxidant protection to neuronal signalling. J Inorg Biochem. 2015; 153: 1–12. doi: 10.1016/j.jinorgbio.2015.09.003 - DOI - PubMed

LinkOut - more resources