. 2024 Oct 23;16(770):eado2402.
doi: 10.1126/scitranslmed.ado2402. Epub 2024 Oct 23.

Stromal reprogramming overcomes resistance to RAS-MAPK inhibition to improve pancreas cancer responses to cytotoxic and immune therapy

Affiliations

Stromal reprogramming overcomes resistance to RAS-MAPK inhibition to improve pancreas cancer responses to cytotoxic and immune therapy

Xiuting Liu et al. Sci Transl Med. .

Abstract

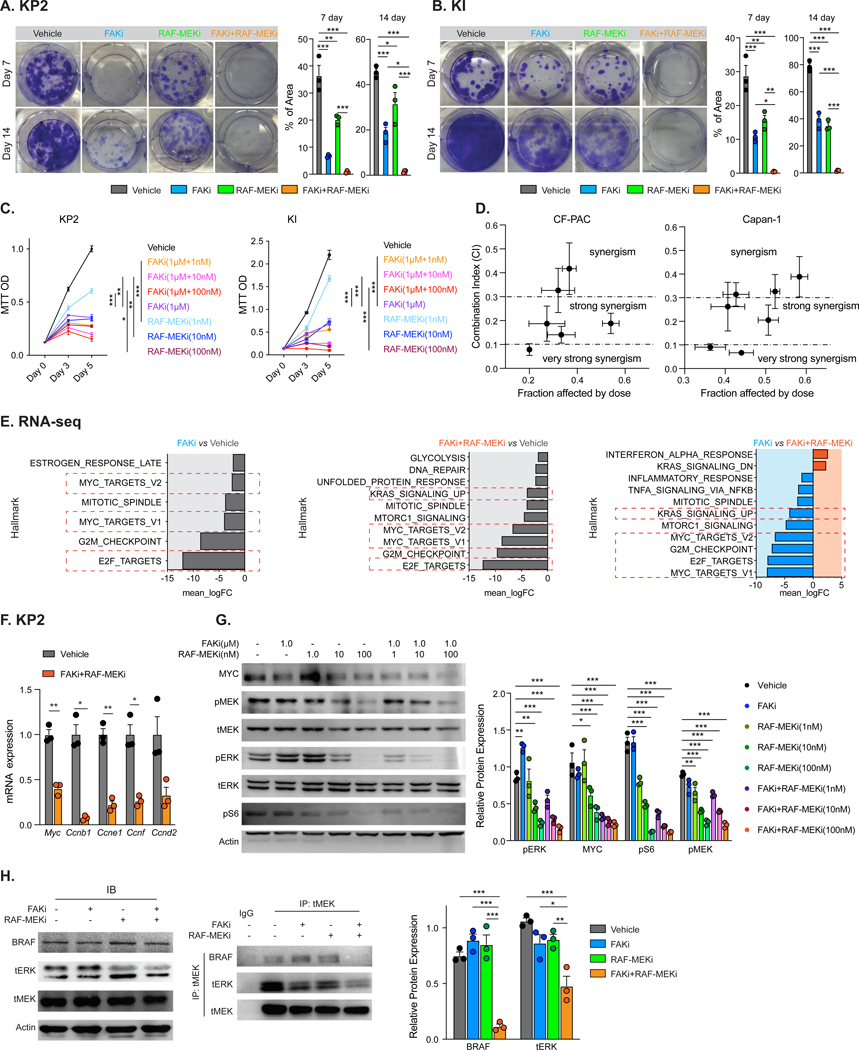
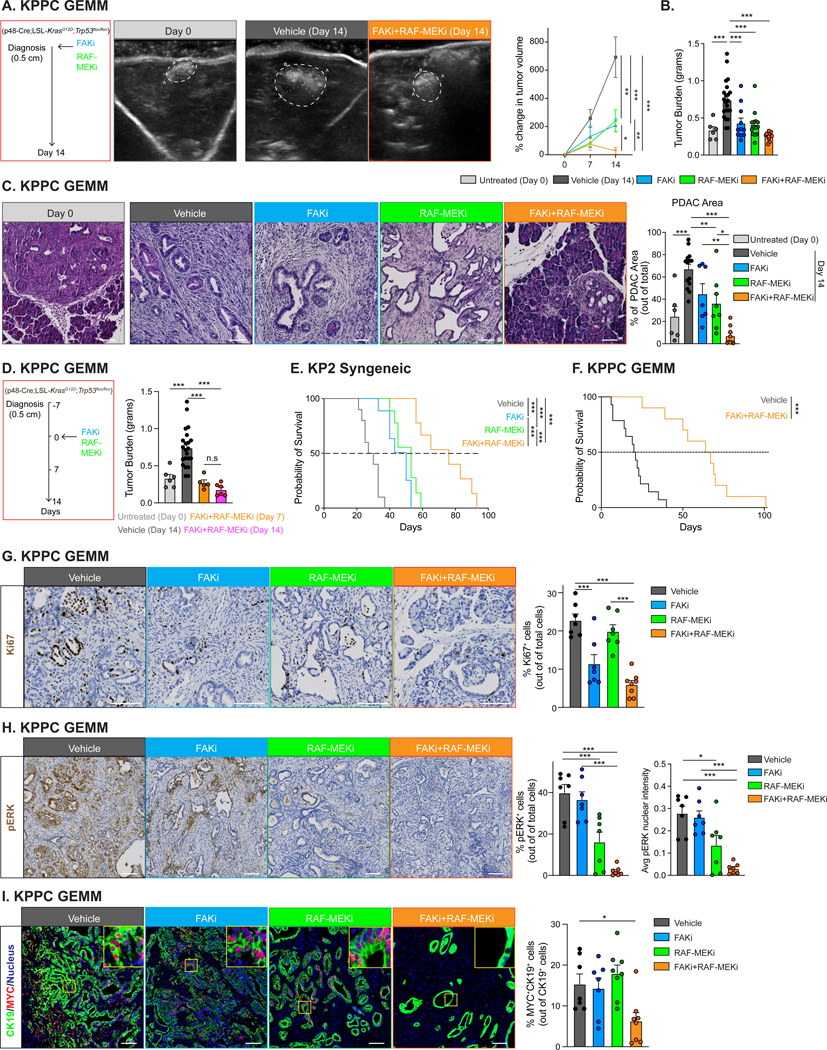
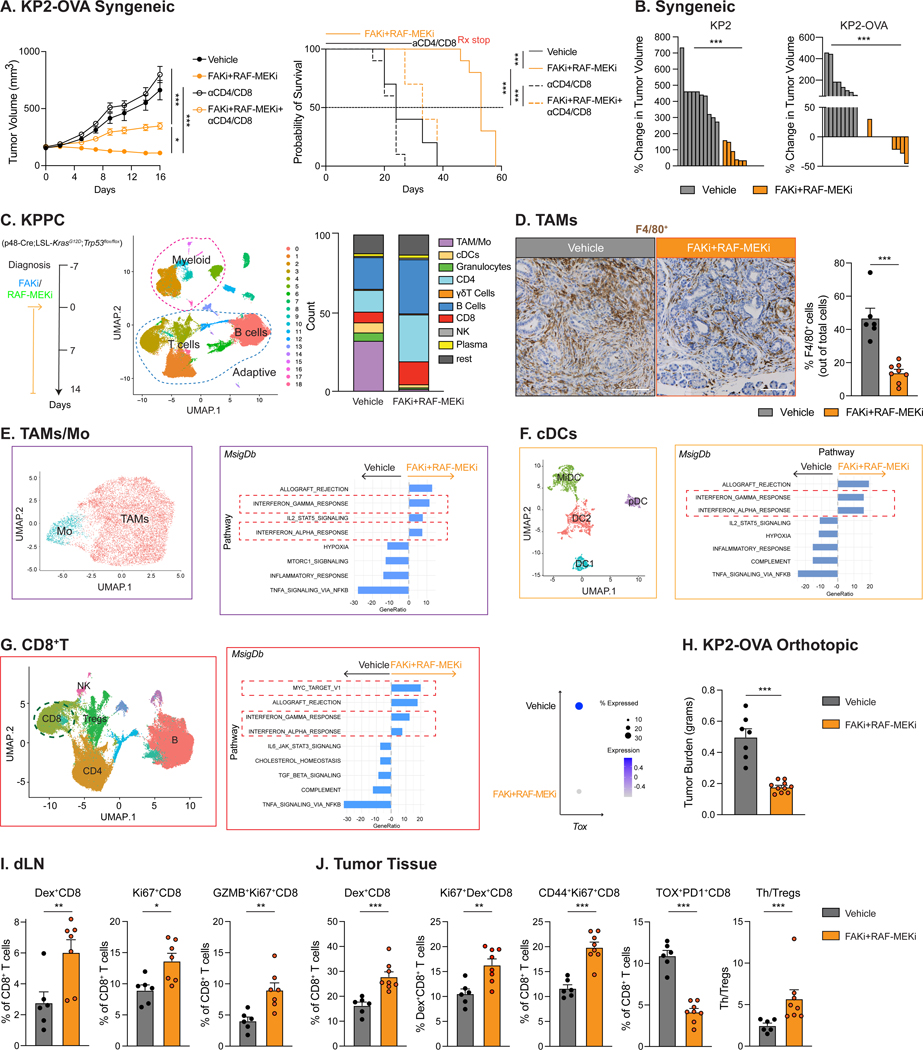
Pancreatic ductal adenocarcinoma (PDAC) is a lethal malignancy that is often resistant to therapy. An immune suppressive tumor microenvironment (TME) and oncogenic mutations in KRAS have both been implicated as drivers of resistance to therapy. Mitogen-activated protein kinase (MAPK) inhibition has not yet shown clinical efficacy, likely because of rapid acquisition of tumor-intrinsic resistance. However, the unique PDAC TME may also be a driver of resistance. We found that long-term focal adhesion kinase (FAK) inhibitor treatment led to hyperactivation of the RAS/MAPK pathway in PDAC cells in mouse models and tissues from patients with PDAC. Concomitant inhibition of both FAK (with VS-4718) and rapidly accelerated fibrosarcoma and MAPK kinase (RAF-MEK) (with avutometinib) induced tumor growth inhibition and increased survival across multiple PDAC mouse models. In the TME, cancer-associated fibroblasts (CAFs) impaired the down-regulation of MYC by RAF-MEK inhibition in PDAC cells, resulting in resistance. By contrast, FAK inhibition reprogramed CAFs to suppress the production of FGF1, which can drive resistance to RAF-MEK inhibition. The addition of chemotherapy to combined FAK and RAF-MEK inhibition led to tumor regression, a decrease in liver metastasis, and improved survival in KRAS-driven PDAC mouse models. Combination of FAK and RAF-MEK inhibition alone improved antitumor immunity and priming of T cell responses in response to chemotherapy. These findings provided the rationale for an ongoing clinical trial evaluating the efficacy of avutometinib and defactinib in combination with gemcitabine and nab-paclitaxel in patients with PDAC and may suggest further paths for combined stromal and tumor-targeting therapies.


Conflict of interest statement

Competing interests

D.G.D. is on the scientific advisory board for Adhaere, 149. Bio, and Gossamer Bio. R.E.O., S.C. and J.A.P. are employees from Verastem Oncology.

Figures

Figure 1.
Figure 1.. RAS/MAPK activation in FAKi-treated PDAC tumors.
A. The schematic on the left shows how KPC mice were treated with Vehicle or the FAKi (75 mg/kg) at the age of 3.5 months until the end stage. Representative IHC staining for pERK and pMEK in PDAC tissue is shown in the middle two panels. Scale bar, 100 μm. The percentage of pERK+ and pMEK+ cells are plotted on the right (n=5–7). B. The schematic on the left shows how KPPC mice were treated with Vehicle or the FAKi (75 mg/kg) from tumor diagnosis until the end stage. Representative mpIHC staining for pERK (red), SMA (green), and CK19 (blue) in PDAC tissue is shown in the middle panel, and pERK+ PDAC cells in each group are magnified. Scale bar, 500 μm (left), 100 μm (middle) and 500 μm (right). The percentage of pERK+ CK19+ cells is plotted on the right (n=7). C. Representative mpIHC staining for pERK (red) and CK19 (green) in 10 paired tumor biopsies from patients, scale bar, 50 μm, and 150 μm. The relative fold changes of pERK+ cell proportion in post-groups compared to paired pre-treatment are plotted on the right. Red lines represent increased pERK+ cells in the post-treatment groups. Grey lines represent a decrease. All graphs show the mean, and error bars are SEM; Data were analyzed using two-sided t-tests (A and B) and One sample t and Wilcoxon tests (C); *denotes p < 0.05, **denotes p < 0.01, and n.s denotes not significant.
Figure 2.
Figure 2.. FAKi increased RAS/MAPK inhibition response by inhibiting downstream Myc expression.
A. Clonogenic growth is shown at 7 or 14 days in KP2 cells treated with Vehicle, FAKi (1 μM), RAF-MEKi (100 nM), or the FAKi and RAF-MEKi combination. Representative images of cell clones in each group are shown on the left, and the percentage of cell area in the above groups on days 7 and 14 is shown on the right (n=3). B. Representative images of cell clones of KI stimulated by treatment in A are shown on the left, and the percentage of cell area is shown on the right (n=3). C. MTT proliferation assay using KP2 (left) and KI cells (right) treated with Vehicle, FAKi (1 μM), RAF-MEKi at different doses, or the FAKi and RAF-MEKi combination. The mean MTT optical density from the above groups at indicated time points is plotted (n=3) D. Median effect analysis measuring synergy between the FAKi and RAF-MEKi in CF-PAC (left) and Capan-1 cells (right) analyzed using Compusyn software is shown. Horizontal dotted lines mark the boundaries that classify each type of interaction—synergism, strong synergism, or very strong synergism —between the FAKi and RAF-MEKi (n=3) E. GSEA identified pathway enrichment in KP2 organoids treated with FAKi (1 μM, left) and FAKi + RAF-MEKi (100 nM, middle) for 24 hours, compared to the Vehicle group. GSEA identified pathway enrichment in FAKi-treated KP2 organoids compared to FAKi + RAF/MEKi-treated samples (right) (n=3). F. qPCR mRNA expression analysis is shown of KP2 organoids with FAKi + RAF-MEKi treatment for 24 hours. Changes in gene expression are depicted as the fold change compared with that in the Vehicle group (n=3). G. KP2 cells were treated with FAKi (1 μM), RAF-MEKi at different doses, and the FAKi and RAF-MEKi combination for 48 hours. Immunoblots for MYC, pMEK, total MEK (tMEK), pERK, total ERK (tERK), pS6, and β-ACTIN (loading control) are shown. The mean expression of pERK, pMEK normalized to tERK or tMEK, Myc, and pS6 normalized to β-ACTIN from replicate experiments is shown on the right (n=3). H. KP2 cells were treated with FAKi (1 μM), RAF-MEKi (100 nM), or the FAKi and RAF-MEKi combination for 48 hours. Immunoblots for BRAF, tERK, tMEK, and β-ACTIN (loading control) from total lysates (left) and for BRAF, tERK, and tMEK from purified tMEK protein (middle) are shown. The mean expression of BRAF and tERK in the IP experiment normalized to tMEK from replicate experiments is shown on the right (n=3). Graphs show the mean ± SEM; Data were analyzed using one-way ANOVA with Tukey’s multiple comparison correction (A-C, G, and H) and two-sided t tests (E and F); *denotes p < 0.05, **denotes p < 0.01, ***denotes p < 0.001, and n.s denotes not significant.
Figure 3.
Figure 3.. RAS/MAPK inhibition increased the FAKi response by inhibiting downstream RAS/MAPK signaling.
A. KPPC mice were treated with Vehicle, FAKi (75 mg/kg), RAF-MEKi (0.5 mg/kg), or the FAKi and RAF-MEKi combination for 14 days after diagnosis. Representative ultrasound images of tumors on days 0 or 14 from Vehicle and combination groups are shown in the middle panels. The mean percent change in tumor volume on days 7 and 14 from ultrasound measurements is shown on the right (n = 8–13). B. Tumor burden at diagnosis and 14 days after treatment from A is plotted (n=6–22). C. Histological images of KPPC mice from (A) are shown for the indicated treatments. The mean percent of PDAC area in pancreas tissue is plotted on the right (n=6–14). D. KPPC mice were treated with Vehicle for 14 days, or treatment was delayed for 7 days, and then FAKi (75 mg/kg) + RAF-MEKi (0.5 mg/kg) was given for 7 or 14 days until day 14 or 21 after diagnosis. The mean tumor burden is plotted on the right (n=5–22). E. Mice bearing established (approximately 100 mm3) KP2 subcutaneous PDAC tumors were treated with Vehicle, FAKi (75 mg/kg), RAF-MEKi (0.5 mg/kg), or the FAKi plus RAF-MEKi combination. The Kaplan–Meier survival analysis is shown (n = 9–10). F. KPPC mice were treated with the Vehicle or FAKi (75 mg/kg) + RAF-MEKi (0.5 mg/kg) starting at diagnosis, and Kaplan–Meier survival analysis is shown (n = 10–14). G. Representative IHC staining for Ki67 in KPPC mice from (B). The mean percentage of Ki67+ cells is plotted on the right (n=7–8). H. Representative IHC staining for pERK in tissue from (B). The mean percentage of pERK+ cells and mean pERK nuclear intensity are plotted on the right (n=7). I. Representative mpIHC staining for MYC (red) and CK19 (green) in tumors from B is shown. The mean percentage of MYC+ CK19+ cells (among CK19+ cells) is plotted on the right (n=7–8). Graphs show the mean ± SEM; Data were analyzed using one-way ANOVA with Tukey’s multiple comparison correction (A-D and G-I) and Kaplan–Meier (E-F); For A, comparisions among treatment are included; *denotes p < 0.05, **denotes p < 0.01, ***denotes p < 0.001, and n.s denotes not significant. All scale bars are 100 μm.
Figure 4.
Figure 4.. FAKi-induced reduction of FGF1 in CAFs improved RAF-MEKi responses to decrease MYC expression in tumor cells.
A. Representative mpIHC staining for pERK (red), SMA (green), and CK19 (light blue) in tumors from KPPC mice treated with Vehicle for 14 days. Scale bars, 50 μm (left and right) and 500 μm (middle). The mean percentage of pERK+CK19+ cells is plotted on the right (n=4) B. Representative IHC staining for SMA of PDAC tissue from KPPC mice treated with Vehicle, FAKi (75 mg/kg), RAF-MEKi (0.5 mg/kg), or the FAKi and RAF-MEKi combination for 14 days. Scale bar, 100 μm. The mean percentage of SMA+ area (out of the whole pancreas tissue) is plotted on the right (n=6–8). C. Trichrome staining of PDAC tissue from treatments in B. Scale bar, 100 μm. The mean percentage of trichrome+ area (out of the whole pancreas tissue) is plotted on the right (n=7–10). D. KP2 cells alone (on the left in the diagram) or co-cultured with fibroblasts (on the right in the diagram) were treated with Vehicle, FAKi (1 μM), RAF-MEKi (100 nM), or the FAKi and RAF-MEKi combination for 48 hours. Immunoblots of MYC, pERK, tERK, pMEK, tMEK, and β-ACTIN (loading control) in KP2 cell lysis from the above groups are shown on the right (n=3). E. KPPC mice were treated with Vehicle for 14 days, or treatment was delayed for 7 days, and then the FAKi (75 mg/kg), RAF-MEKi (0.5 mg/kg) or the FAKi plus RAF-MEKi was given for 14 days until day 21 after diagnosis. CAFs (CD45 CD31 EPCAM PDPN+) were sorted from each group. UMAP scRNA-seq plots (middle) of the whole CAF population and the distribution of CAF subtypes in Vehicle and the FAKi/RAF-MEKi combination-treated groups are shown on the right. F. Dot plots depicting the relative expressions of Fgf1, Hbegf, and Tgfb 1, 2, and 3 in the whole CAF population across the Vehicle, FAKi, and the combined FAKi and RAF-MEKi treatment groups are shown. The color of each dot indicates the expression amount; the size of the dot indicates the proportion of expressed cells. G. Dot plots depicting the relative Fgf1 expression from the whole CAF, iCAF, and MyCAF populations in Vehicle and the combined FAKi and RAF-MEKi treatment groups are shown. The color of each dot indicates the expression amount; the size of the dot indicates the proportion of expressed cells. H. Fibroblasts alone, incubated with tumor-conditioned media (TCM), or co-cultured with KP2 cells were treated with Vehicle, FAKi (1 μM), RAF-MEKi (100nM), or the FAKi and RAF-MEKi combination for 48 hours. qPCR mRNA expression analysis in fibroblasts from the above groups is shown on the right. Changes in gene expression are depicted as the fold change from the Vehicle baseline (n=3). I. KP2 cells were starved in media without FBS for 12 hours and then treated with Vehicle or murine FGF1 (5 ng) for 3 hours. Immunoblots of pFGFR1, pGSK3β, GSK3β, pAKT, AKT, MYC, pERK, tERK, and β-ACTIN (loading control) are shown on the left. The mean expression of pFGFR1, pGSK3β, pAKT, and MYC normalized to β-ACTIN from replicate experiments is shown on the right (n=3). J. Immunoblots of MYC, pERK, tERK, pMEK, tMEK, and β-ACTIN (loading control) from KP2 cells treated with Vehicle or RAF-MEKi (100 nM) in the presence or absence of murine FGF1 (1 ng) for 24 hours are shown on the left. The mean expression of Myc and pERK normalized to β-ACTIN is shown on the right (n=3). K. KP2 cells were cocultured with fibroblasts and then treated with Vehicle or RAF-MEKi (100 nM) in the presence or absence of FGFR1 inhibitor (1 μM) for 48 hours. Immunoblots of MYC, pERK, tERK, and β-ACTIN (loading control) from KP2 cells are shown on the left. The mean expression of Myc and pERK normalized to β-ACTIN is shown on the right (n=3). L. MTT proliferation assay is shown using KP2 cells treated with Vehicle or RAF-MEKi (100 nM) ± murine FGF1 at indicated doses for 4 days. The mean growth inhibitory rate is plotted (n=3). Graphs show the mean ± SEM; Data were analyzed using one-way ANOVA with Tukey’s multiple comparison correction (B, C, H, and J-L) and two-sided t tests (A, F, G, and I); *denotes p < 0.05, **denotes p < 0.01, ***denotes p < 0.001, and n.s denotes not significant.
Figure 5.
Figure 5.. CD8+ T cells contribute to the anti-tumor efficacy of FAKi plus RAF-MEKi treatment.
A. Mice bearing established (approximately 150 mm3) KP2-OVA subcutaneous PDAC tumors were treated with Vehicle, the FAKi (75 mg/kg) and RAF-MEKi (0.5 mg/kg) combination ± αCD4/CD8. The last doses of FAKi and RAF-MEKi were administrated on day 14. αCD4/CD8 was given for 7 doses in total. The tumor growth curve for 16 days is shown on the left. Kaplan–Meier survival analyses are depicted (n = 10). B. The percent change of tumor volume of KP2 (left) or KP2-OVA (right) subcutaneous PDAC mouse models treated with Vehicle or the FAKi (75 mg/kg) and RAF-MEKi (0.5 mg/kg) combination on day 14 (n=8–10). C. KPPC mice were treated with Vehicle for 14 days, or treatment was delayed for 7 days, and then the FAKi (75 mg/kg) and RAF-MEKi (0.5 mg/kg) combination was given for 14 days until day 21 after diagnosis. Immune cells (CD45+CD31EPCAM PDPN-) were sorted from each group. UMAP scRNA-seq plots (middle) of the immune cell population and the distribution of immune cell subtypes are shown on the right. D. Representative IHC staining for F4/80 of PDAC tissue from KPPC mice treated with Vehicle or the FAKi (75 mg/kg) and RAF-MEKi (0.5 mg/kg) combination for 14 days. Scale bar, 100 μm. The mean percentage of F4/80+ cells is plotted on the right (n=6–8). E. UMAP scRNA-seq plot (left) of the TAM/Mo population and GSEA-identified pathway enrichment (right) in the TAM/Mo population after FAKi plus RAF-MEKi combination treatment, compared to the Vehicle group are depicted. F. UMAP scRNA-seq plot (left) of the cDC population and GSEA-identified pathway enrichment (right) in the cDC population after FAKi plus RAF-MEKi combination treatment, compared to the Vehicle group are shown. G. UMAP scRNA-seq plot (left) of T, B, and NK cell populations and GSEA-identified pathway enrichment (middle) in the CD8+ T cell after FAKi plus RAF-MEKi combination treatment, compared to the Vehicle group are depicted. A dot plot analysis (right) of relative Tox expression in CD8+ T cells from Vehicle and the FAKi plus RAF-MEKi combination groups is shown on the right. The color of each dot indicates the expression amount; the size of the dot indicates the proportion of expressed cells. H. Syngeneic KP2-OVA orthotopic model treated with Vehicle or the FAKi (75 mg/kg) and RAF-MEKi (0.5 mg/kg) combination for 10 days. The tumor burden from the above groups is shown. I. The mean frequencies of Dex+CD8+ T cells, proliferative CD8+ T cells, and GZMB+Ki67+CD8+ T cells in tumor-dLNs are plotted (n=6–7). J. The mean frequencies of Dex+CD8+ T cells, proliferative Dex+CD8+ T cells, CD44+Ki67+CD8+T cells, TOX+PD1+CD8+ T cells, and the ratio of Th cells to Tregs in tumor tissue are shown (n=6–8). Graphs show the mean ± SEM; Data were analyzed using one-way ANOVA with Tukey’s multiple comparison correction (A, left), Two-sided t tests (B, D-J), and Kaplan–Meier (A, right); *denotes p < 0.05, **denotes p < 0.01, and ***denotes p < 0.001, and n.s denotes not significant.
Figure 6.
Figure 6.. DNA damaging therapies cooperate with FAKi and RAF-MEKi treatment to increase anti-tumor regulation.
A. GSEA identified pathway enrichment in KP2 organoids treated with GEM (0.1 μM) for 24 hours, compared with that in the Vehicle group (n=3). B. An MTT proliferation assay quantification is shown using KP2 cells treated with Vehicle or the FAKi (1 μM) and RAF-MEKi (100 nM) combination ± different doses of GEM. The mean MTT optical density (left) and the mean values of Annexin V luminescence from the above groups at indicated time points are plotted (right) (n=3). C. GSEA identified pathway enrichment in GEM (0.1 μM) + FAKi (1 μM) + RAF-MEKi (100 nM)-treated KP2 organoids, compared with those treated with GEM (0.1 μM) (p < 0.05) (n=3). D. qPCR mRNA expression analysis is shown of KP2 organoids treated with stimulation from panel (B) for 24 hours. Changes in gene expression are plotted as the fold change compared with that in the Vehicle group (n=3). E. Mice bearing established (approximately200 mm3) KP2-OVA subcutaneous PDAC tumors were treated with Vehicle or FAKi (50 mg/kg)+RAF-MEKi (0.3 mg/kg) combination, GEM (75 mg/kg) + PTX (5 mg/kg) ± FAKi/RAF-MEKi combination. The last doses of FAKi and RAF-MEKi were administrated on day 44. GEM + PTX was given for 4 doses in total. The percentage of tumor volume from each mouse on day 14 (middle) and Kaplan–Meier survival analyses (right, n = 8–12) are depicted. F. Tumor burden in KPPC mice treated with Vehicle, FAKi (75 mg/kg) + RAF-MEKi (0.5 mg/kg) or GEM (75 mg/kg) + PTX (5 mg/kg) ± FAKi + RAF-MEKi combination for 14 days is plotted (n=6–22). G. Mice bearing established KP2-mCherry liver metastasis using the hemispleen model were treated with Vehicle, GEM (75 mg/kg) + PTX (5 mg/kg) ± FAKi, MEKi, or FAKi plus RAF-MEKi combination for 14 days. Histological images of liver metastasis (outlined in green) in the liver (outlined in yellow) from the above groups, Scale bar, 1 cm. The mean percentage of liver metastasis area in liver tissue is plotted on the right (n=8–9). H. Syngeneic KP2-OVA orthotopic model treated with Vehicle, FAKi (75 mg/kg) + RAF-MEKi (0.5 mg/kg), or GEM (75 mg/kg) + PTX (5 mg/kg) ± FAKi plus RAF-MEKi combination for 10 days. The mean frequencies of Ki67+CD8+ T cells, proliferative Dex+ CD8+ T cells, and GZMB+CD8+ T cells in tumor tissue are shown (n=6–8). I. The mean frequencies of Dex+CD8+ T cells, proliferative CD8+T cells, Ki67+ Dex+CD8+ T cells, and GZMB+Ki67+CD8+ T cells in tumor-dLNs are depicted (n=6–7). (J). Mice bearing established (approximately 200 mm3) KP2-OVA subcutaneous PDAC tumors were treated with Vehicle, GEM (75 mg/kg) + PTX(5 mg/kg) ± FAKi (50 mg/kg) + RAF-MEKi (0.3 mg/kg), or GEM + PTX + αPD-1 + αCTLA-4 ± FAKi + RAF-MEKi. The last dose of RAF-MEKi was administrated on day 14. The last FAKi and αPD-1 doses were administrated on day 40. GEM/PTX and αCTLA4 were given 4 doses in total. The percentage of tumor volume in each mouse (middle) in the above mice on day 16 (n=6–13). (K) Kaplan–Meier survival analyses is shown(n = 5–10). Graphs show the mean ± SEM; Data were analyzed using one-way ANOVA with Tukey’s multiple comparison correction (B, D, E, middle, F-J, middle), Two-sided t tests (A and C), and Kaplan–Meier (E, right and J, right) *denotes p < 0.05, **denotes p < 0.01, and ***denotes p < 0.001, and n.s denotes not significant.

References

    1. Siegel RL, Miller KD, Fuchs HE, Jemal A, Cancer statistics, 2022. CA Cancer J Clin 72, 7–33 (2022). - PubMed
    1. Hosein AN, Dougan SK, Aguirre AJ, Maitra A, Translational advances in pancreatic ductal adenocarcinoma therapy. Nat Cancer 3, 272–286 (2022). - PubMed
    1. Santarpia L, Lippman SM, El-Naggar AK, Targeting the MAPK-RAS-RAF signaling pathway in cancer therapy. Expert Opin Ther Targets 16, 103–119 (2012). - PMC - PubMed
    1. Dennison L, Ruggieri A, Mohan A, Leatherman J, Cruz K, Woolman S, Azad N, Lesinski GB, Jaffee EM, Yarchoan M, Context-Dependent Immunomodulatory Effects of MEK Inhibition Are Enhanced with T-cell Agonist Therapy. Cancer Immunol Res 9, 1187–1201 (2021). - PMC - PubMed
    1. Mahadevan KK, McAndrews KM, LeBleu VS, Yang S, Lyu H, Li B, Sockwell AM, Kirtley ML, Morse SJ, Moreno Diaz BA, Kim MP, Feng N, Lopez AM, Guerrero PA, Paradiso F, Sugimoto H, Arian KA, Ying H, Barekatain Y, Sthanam LK, Kelly PJ, Maitra A, Heffernan TP, Kalluri R, KRAS(G12D) inhibition reprograms the microenvironment of early and advanced pancreatic cancer to promote FAS-mediated killing by CD8(+) T cells. Cancer Cell 41, 1606–1620 e1608 (2023). - PMC - PubMed

Publication types

MeSH terms

Substances