. 2024 Oct 25;10(43):eadp3170.
doi: 10.1126/sciadv.adp3170. Epub 2024 Oct 23.

Isolation and tracing of matrix-producing notochordal and chondrocyte cells using ACAN-2A-mScarlet reporter human iPSC lines

Affiliations

Isolation and tracing of matrix-producing notochordal and chondrocyte cells using ACAN-2A-mScarlet reporter human iPSC lines

Xiaole Tong et al. Sci Adv. .

Abstract

The development of human induced pluripotent stem cell (iPSC)-based regenerative therapies is challenged by the lack of specific cell markers to isolate differentiated cell types and improve differentiation protocols. This issue is particularly critical for notochordal-like cells and chondrocytes, which are crucial in treating back pain and osteoarthritis, respectively. Both cell types produce abundant proteoglycan aggrecan (ACAN), crucial for the extracellular matrix. We generated two human iPSC lines containing an ACAN-2A-mScarlet reporter. The reporter cell lines were validated using CRISPR-mediated transactivation and functionally validated during notochord and cartilage differentiation. The ability to isolate differentiated cell populations producing ACAN enables their enrichment even in the absence of specific cell markers and allows for comprehensive studies and protocol refinement. ACAN's prevalence in various tissues (e.g., cardiac and cerebral) underscores the reporter's versatility as a valuable tool for tracking matrix protein production in diverse cell types, benefiting developmental biology, matrix pathophysiology, and regenerative medicine.


Figures
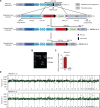
Fig. 1.
Fig. 1.. Generation of the ACAN-2A-mScarlet reporter in the TMOi001-A iPSC line.
(A) Schematic of the gene targeting strategy to introduce 2A-mScarlet into the ACAN gene. gRNAs leading CRISPR-Cas9 to generate DNA DSB were designed close to the ACAN stop codon. The left and right homologous arms (LHA and RHA) in the targeting donor construct were cloned from the genomic region covering the entire last exon (exon19) of the ACAN gene. The in-frame 2A-mScarlet reporter gene and the downstream PGK-NEO positive selection cassette were cloned between two homologous arms. The PGK-NEO cassette is flanked by two FRT sites which allow the FLP recombinase-mediated cassette removal. Two negative selection cassettes, thymidine kinase (TK) and diphtheria toxin fragment A (DTA), were cloned into the targeting donor construct as well, to prevent random integration. TMOi001-A-14 underwent FLP recombinase–mediated removal of the PGK-NEO cassette, differentiating it from TMOi001-A-15 containing the PGK-NEO cassette. . (B) PCR showing PGK-NEO cassette removal in TMOi001-A-14 (RFP_Fw/NEO_Rv 1162 bp PCR product) and PGK-NEO cassette retainment in TMOi001-A-15 (RFP_Fw/NEO_Rv 2889 bp PCR product). (C) Neomycin gene expression confirmed the PGK-NEO cassette removal in TMOi001-A-14 in contrast to PR (the parental clone). Data presented as means ± SD, **P < 0.01. (D) Karyo sequencing (NlaIII sequencing) and subsequent analysis via the AneuFinder algorithm (33) revealed karyotype integrity and the normal diploid 46,XX karyotype of TMOi001-A-14 and TMOi001-A-15. TM, TMOi001-A line; PR, parental reporter clone before FLP recombinase–mediated removal; A-14, TMOi001-A-14 line; A-15, TMOi001-A-15 line.
Fig. 2.
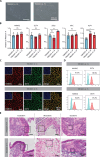
Fig. 2.. ACAN-2A-mScarlet reporter human iPSCs show normal PSC characteristics.
(A) Bright-field images of the TMOi001-A-14 and TMOi001-A-15 cell lines show a tightly packed, rounded morphology that is typical of iPSCs. (B) mRNA expression of pluripotency markers NANOG, OCT4, SOX2, MYC, and KLF4 in TMOi001-A-14 and TMOi001-A-15 lines and the TMOi001-A human iPSC line as determined by RT-qPCR. The y axis represents the relative expression of analyzed genes normalized to TMOi001-A human iPSCs. Data presented as means ± SD, *P < 0.05; **P < 0.01; ns, not significant, n = 4 biological replicates (generated independently). (C) Representative immunofluorescent micrographs of TMOi001-A-14 and TMOi001-A-15 lines, positively stained for stem cell markers NANOG and OCT4. Inset shows that nuclei were labeled with DAPI. (D) Flow cytometry of pluripotency markers NANOG and OCT4 in TMOi001-A-14 and TMOi001-A-15 lines. (E) Multilineage differentiation potential confirmed by H&E staining of day 28 embryoid bodies derived from TMOi001-A-14 and TMOi001-A-15 lines. The typical germ layer morphology, like early epithelial tissue (endoderm), early cartilage-like tissue (mesoderm), and neural rosettes (ectoderm), is highlighted in black rectangles.
Fig. 3.
Fig. 3.. Transactivation of ACAN leads to mScarlet expression.
(A) To activate ACAN, the transcriptional transactivator CRISPR-dCas9-SAM constructs were transfected into iPSCs together with gRNA constructs to target the promoter region of ACAN and GFP constructs to track the transfection efficiency. ACAN activation leads to the up-regulation of ACAN and mScarlet. (B) ACAN and mScarlet mRNA show significant up-regulation in CRISPRa transfected cells as determined by RT-qPCR. The y axis represents the relative expression of analyzed genes normalized to nonactivated iPSCs. Data presented as means ± SD, ***P < 0.001; ****P < 0.0001; ns, not significant, n = 3 biological replicates (generated independently). Nonactivated cells are used as a negative control to show that the lack of CRISPR activation of the ACAN gene is ACAN and mScarlet-negative. (C) Fluorescence imaging in CRISPR-activated TMOi001-A-14 and TMOi001-A-15 cells. Cells cotransfected with GFP constructs to track the transfection efficiency. Control cells lacking CRISPR and ACAN targeting gRNA appeared almost exclusively mScarlet-negative. (D) Immunofluorescence staining for the detection of mScarlet in transactivated TMOi001-A-14 and TMOi001-A-15 iPSCs. Inset shows DAPI channel views of the images.
Fig. 4.
Fig. 4.. ACAN-2A-mScarlet reporter iPSC lines differentiate into mScarlet-expressing NC-like cells.
(A) Schematic of iPS-NLC differentiation. Following the 2D differentiation in the monolayer (M0 to M5), the ACAN-2A-mScarlet reporter iPSCs were matured in 3D pellet culture to promote matrix deposition (P0 to P14). (B) Gene expression of pluripotency, mesendoderm markers, and indicators of matrix production in TMOi001-A-14 and TMOi001-A-15 in monolayer culture determined by RT-qPCR confirming proper differentiation of both lines. Significance indicated at the end of the monolayer differentiation (M5), compared with iPSCs (M0). (C and D) Representative immunofluorescence staining and quantification of TBXT, FOXA2, and DAPI of differentiated iPSCs at M5 indicating cells differentiating toward NCs. (E) Gene expression from cell pellets of two lines during the pellet culture indicates the differentiation toward matrix production. Significance indicated at the final time point of the 3D maturation (P14), compared with the P0 pellet. (F) Representative H&E and Alcian blue staining images of the P14 TMOi001-A-14 pellet. (G) Fluorescence live cell imaging at P7 and P14 with TMOi001-A-14 cells showing the mScarlet signal in contrast to the pellet obtained for the parent TMOi001-A iPSC line showing no mScarlet signal. The area in the red square was magnified to reveal the mScarlet-expressing cells within the pellet. (H) Immunofluorescence staining of ACAN and mScarlet of the P14 TMOi001-A-14 pellet showing ACAN and mScarlet protein expression. The y axis represents the relative expression of analyzed genes normalized to M0 iPSCs. Data presented as means ± SD, *P < 0.05; **P < 0.01; ***P < 0.001; ns, not significant (top, A-14; bottom, A-15). n = 3 biological replicates (generated independently).
Fig. 5.
Fig. 5.. ACAN-2A-Scarlet–expressing iPSC lines efficiently differentiate into the chondrogenic lineage.
(A) Schematic of the stepwise chondrogenic differentiation of iPSCs, where cells are first taken through a monolayer pre-chondrogenic phase and then toward a chondrogenic phase in 3D pellet culture. (B) Gene expression of pluripotency, sclerotome markers, and chondrogenic markers in TMOi001-A-14 and TMOi001-A-15 as determined by RT-qPCR, indicating the differentiation toward the chondrogenic lineage. The y axis represents the relative expression of analyzed genes normalized to M0 iPSCs. Data presented as means ± SD, *P < 0.05; **P < 0.01; ***P < 0.001; ns, not significant (top, A-14; bottom, A-15), compared with M0 iPSCs. Significance is indicated at key time points, for pluripotency and sclerotome markers at the M14 time point and for pro-chondrogenic markers at the P28 time point. n = 3 biological replicates (generated independently). (C) Fluorescence live cell imaging showing the emergence of an mScarlet-positive–responsive core during the 28-day differentiation of the TMOi001-A-14 line. A P14 mScarlet-negative pellet obtained for the TMOi001-A line is used as a negative control. (D) Flow cytometry of TMOi001-A-14 pellets showing an increase in mScarlet-positive population during the chondrogenic differentiation, while no mScarlet-positive cell was detected in TMOi001-A pellets. (E) Immunofluorescence staining of ACAN and mScarlet of the P28 TMOi001-A-14 pellet showing ACAN and mScarlet protein expression localized within the chondrogenic responsive core. (F) Representative images of P14 and P28 TMOi001-A-14 pellets analyzed by H&E and Alcian blue staining indicate a chondrogenic core with matrix deposition and nonchondrogenic peripheral cells.
Fig. 6.
Fig. 6.. Transcriptome analysis of chondrogenic cell populations reveals off-target differentiation to neuronal-like cells.
(A) Experiment design and cell isolation scheme using flow cytometry–based cell sorting of the mScarlet+/− population from TMOi001-A-14–derived and TMOi001-A-15–derived chondrogenic cells. (B) Volcano plots showing log2 FC versus significance (adjusted P value) calculated for 15,401 genes highlighting enriched genes for the mScarlet+ and mScarlet populations. Red and green dots indicate log2 FC < −1 or >1; red dots are genes with a Benjamini-Hochberg adjusted P value of <0.05. The top 20 DEGs are highlighted. mScarlet+/− cells from both cell lines have been combined in this analysis. (C) Gene set enrichment analysis showing enrichment of key regulatory pathways in the mScarlet+ compared to mScarlet populations with percentage of up-regulated and down-regulated genes plotted. EGF, epidermal growth factor pathway; FGF, FGF pathway; IGF, IGF pathway; PDGF, platelet-derived growth factor pathway; TGFβ, TGFβ pathway; SHH, SHH pathway; WNT, canonical and noncanonical WNT pathway. (D) Dot plot of enriched GO terms following overrepresentation analysis, split by status with an x axis showing the normalized enrichment score. The size of the dots stands for gene counts in the specific pathway, and the color represents the Benjamini-Hochberg adjusted P value. (E) Experiment design and cell isolation scheme using flow cytometry–based cell sorting of the mScarlet+/− population from TMOi001-A-14–derived and TMOi001-A-15–derived NC-like cells for subsequent RNA sequencing. (F) Heatmap of scaled expression of representative markers showing differential expression in mScarlet+ or the mScarlet cells.

References

    1. Rustenburg C. M. E., Emanuel K. S., Peeters M., Lems W. F., Vergroesen P.-A., Smit T. H., Osteoarthritis and intervertebral disc degeneration: Quite different, quite similar. JOR Spine 1, e1033 (2018). - PMC - PubMed
    1. Luoma K., Riihimäki H., Luukkonen R., Raininko R., Viikari-Juntura E., Lamminen A., Low back pain in relation to lumbar disc degeneration. Spine 25, 487–492 (2000). - PubMed
    1. Le Maitre C., Pockert A., Buttle D., Freemont A., Hoyland J., Matrix synthesis and degradation in human intervertebral disc degeneration. Biochem. Soc. Trans. 35, 652–655 (2007). - PubMed
    1. Maldonado M., Nam J., The role of changes in extracellular matrix of cartilage in the presence of inflammation on the pathology of osteoarthritis. Biomed. Res. Int. 2013, 284873 (2013). - PMC - PubMed
    1. Lach M. S., Rosochowicz M. A., Richter M., Jagiełło I., Suchorska W. M., Trzeciak T., The induced pluripotent stem cells in articular cartilage regeneration and disease modelling: Are we ready for their clinical use? Cells 11, 529 (2022). - PMC - PubMed