. 2024 Oct 25;10(43):eado9311.
doi: 10.1126/sciadv.ado9311. Epub 2024 Oct 23.

Compromised macrophages contribute to progression of MASH to hepatocellular carcinoma in FGF21KO mice

Affiliations

Compromised macrophages contribute to progression of MASH to hepatocellular carcinoma in FGF21KO mice

Xiaoju Shi et al. Sci Adv. .

Abstract

Metabolic dysfunction-associated steatohepatitis is well accepted as a potential precursor of hepatocellular carcinoma. Previously, we reported that fibroblast growth factor 21 (FGF21) revealed a novel anti-inflammatory activity via inhibiting the TLR4-IL-17A signaling, which could be a potential anticarcinogenetic mechanism to prevent to MASH-HCC transition. Here, we set out to determine whether FGF21 has a major impact on Kupffer cells' (KCs) ability during MASH-HCC transition. We found aberrant hepatic FGF21 and KC pool in human MASH-HCC. Lack of FGF21 up-regulated ALOX15, which converted the oxidized fatty acids to induce excessive KC death and mobilization of monocyte-derived macrophages (MoMFs) for KC replacement. Lack of FGF21 oversupplied free fatty acids for sphingosine-1-phosphate (S1P) cascade synthesis to mediate MASH-HCC transition via S1P-YAP signaling and cross-talk between tumor cells and macrophages. In conclusion, lack of FGF21 accelerated MASH-HCC transition via the S1P-YAP signaling. Compromised MoMFs could present as tumor-associated macrophage phenotype rendering tumor immune microenvironment for MASH-HCC transition.


Figures

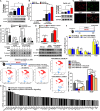
Fig. 1.
Fig. 1.. Aberrant hepatic FGF21 and KC pool in human MASH-HCC.
(A) Representative images of MASH-HCC histology by H&E and Oil Red O staining and immunohistochemistry detection of GF21 protein distribution in the regions of tumor (white dash circle) tissue and adjacent benign tissue. (B) Protein and mRNA levels of FGF21 by Western blotting and qPCR in the tumor and adjacent tissues. GAPDH, glyceraldehyde-3-phosphate dehydrogenase. (C) Serum FGF21 protein levels by ELISA in the postresection patients with HCC (no relapse and relapse). (D) A cohort of 156 overweight (BMI ≥ 25 kg/m2) patients with HCC from TCGA database were subgrouped into G1–2 patients and G3–4 patients to analyze the survival rate, based on high/low expression of FGF21. (E) Representative images of Hyperion Imaging in paraffin-embedding tissues of patients with HCC. (F to H) Cell subpopulations of CD68+ macrophages, CD68+CD163+ macrophages, and CD68+CD163+CD14+ macrophages in tumor and adjacent tissues. (I) the ratio of CD68+CD163+CD14+ macrophages in CD68+ macrophages in tumor and adjacent tissues. *P < 0.05 and **P < 0.01.
Fig. 2.
Fig. 2.. KC pool and FA metabolism in FGF21KO-MASH mice.
(A) Volcano plot of DEGs (log2 fold change >1.5) by RNA-seq analysis in the isolated macrophages between FGF21KO-MASH mice and WT-CD controls. (B) Heatmap of the signature genes for monocytes and KCs by RNA-seq analysis between FGF21KO-MASH mice and WT-CD controls. (C) Running Enrichment Score of transcripts of genes of KCs/macrophages associated with fatty acid (FA) metabolism. (D) Heatmap of enzymes for FA metabolism by qPCR. Protein levels of FASN and CD36 by Western blotting in: (E) the WT/FGF21KO mice with WSHFD/CD diets, (F) the FGF21KO-MASH mice with rhFGF21 treatment compared to vehicle controls and WT-CD controls, and (G) FL83B/FL83B-FGF21KD cells treated with palmitic acid (PA), while 1% bovine serum albumin (BSA) was used as treatment control. (H) Protein levels of HSL and phosphorylated HSL at S563 and S660 by Western blotting in the WT/FGF21KO mice with WSHFD/CD diets. (I) Heatmap of long-chain FAs (LCFAs) detected by Waters ACQUITY UPLC Systems coupled with Waters Xevo TQ-S micro triple quadrupole mass spectrometer in the WT/FGF21KO mice with WSHFD/CD diets. 21KO, FGF21KO. *P < 0.05, **P < 0.01, and ***P < 0.001.
Fig. 3.
Fig. 3.. Up-regulated ALOX15 signaling in KCs from FGF21KO-MASH mice.
(A) Protein levels of Alox15 by Western blotting in the liver tissues of WT/FGF21KO mice with WSHFD/CD diets. (B) Alox15 mRNA levels by qPCR analysis in the isolated hepatocytes and KCs and the protein levels of Alox15 by Western blotting in KCs from the WT/FGF21KO mice with WSHFD/CD diets. (C) Immunofluorescent staining using the antibodies of anti-ALOX15 and anti-F4/80 to detect the positive ALOX15 macrophages. Green, ALOX15-positive staining cells; red, F4/80-positive staining cells; blue, 4′,6-diamidino-2-phenylindole (DAPI) staining to detect the nuclei as a counterstain. (D) Protein levels of FAS and cleaved caspase-3 by Western blotting in the isolated mouse KCs challenged with 13-HODE and treated with N-acetyl-l-cysteine (NAC). (E) Protein levels of FAS and cleaved caspase-3 by Western blotting in the liver tissues from FGF21KO-MASH mice with rhFGF21 treatment compared to vehicle controls or WT-CD controls. (F) Histology-based NAFLD active score (NAS) in the WT/ALOX15KO mice with HFMCD/WSHFD diets. (G) CyTOF analysis in the isolated macrophages from mice to detect the KCs defined as F4/80hiTim4+CX3CR1 cells and the MoMFs defined as CD11b+ Tim4CX3CR1+ cells in KC pool. The FGF21KO-MASH mice were treated daily with PD146176 or rhFGF21 for 4 weeks. (H) Analysis of the RNA-seq data for the mRNA fold changes of immune response signaling pathway and cytokine-cytokine interaction signaling. 21KO, FGF21KO. *P < 0.05 and **P < 0.01.
Fig. 4.
Fig. 4.. Lack of FGF21 accelerates MASH-HCC transition.
(A) Schematic diagram for establishing MASH-HCC models and the gross anatomy of tumor mass in four MASH-HCC models with CD, HFMCD, WSHFD, and HFD, respectively. (B) Maximal diameter of tumor nodules and number of tumor nodules in four MASH-HCC models. (C) Histology-based NAS in the MASH-HCC mice with HFMCD and WSHFD diets. (D) Schematic diagram for rhFGF21 treatment in the MASH-HCC mice with HFMCD and WSHFD diets. (E) CyTOF analysis of the KCs (F4/80hiTim4+CX3CR1 cells) and MoMFs (CD11b+Tim4CX3CR1+ cells) from the MASH mice and MASH-HCC mice, as well as the control mice. (F) LCFAs in the FGF21KO-MASH-HCC mice compared to normal WT controls. (G) Protein levels of cPLA2, Alox15, and MAGL by Western blotting in the liver tissues of FGF21KO-MASH-HCC mice compared to normal WT controls. (H) The serum FFA levels in FGF21KO-HCC mice in comparison with the WT-HCC mice, with three diets (CD, HFMCD, and WSHFD). (I) S1P levels in serum and liver tissue from FGF21KO-HCC mice in comparison with the WT-HCC mice, with three diets (CD, HFMCD, and WSHFD). 21KO, FGF21KO. *P < 0.05, **P < 0.01, and ***P < 0.001.
Fig. 5.
Fig. 5.. S1P-S1PR2-YAP signaling mediated MSAH-HCC transition in FGF21KO mice.
(A) Schematic diagram of S1P biosynthetic cascade enzymes with the fold changes (FGF21KO-preHCC versus WT-preHCC mice). ND, no detection; NC, no change; red, >2-fold up-regulated; blue, <2-fold down-regulated. (B) The S1P levels and protein levels of phosphorylated SPHK1 in liver issues from WT/FGF21KO-preHCC mice compared to that from WT/FGF21KO mice. (C) The protein levels of phosphorylated YAP and YAP in WT/FGF21KO-preHCC mice. (D) S1P content in FL83B/FL83B-FGF21KD cells and Hepal-6/Hepal-6-FGF21KD cells challenged with PA and treated with rhFGF21. (E) The protein levels of phosphorylated SPHK1 in FL83B/FL83B-FGF21KD cells and Hepal-6/Hepal-6-FGF21KD cells challenged with PA and treated with rhFGF21. (F) The protein levels of phosphorylated YAP in Hepal-6/Hepal-6-FGF21KD cells challenged with PA or PA + S1P and treated with SKI-II, an inhibitor of SPHK1. (G) The protein levels of phosphorylated YAP in Hepal-6/Hepal-6-FGF21KD cells challenged with S1P and treated with inhibitors of S1P receptors (JTE013 for S1PR2 and W146 for S1PR1). (H) Colony-forming assay to detect the number of cell colonies in Hepal-6 cells challenged with S1P and treated with JTE013 or verteporfin, an inhibitor of YAP. (I) Schematic diagram for JTE013 treatment in the MASH-HCC mice with WSHFD diets. (J) The protein levels of phosphorylated YAP in MASH-HCC mice with JTE013 treatment compared to vehicle controls. 21KO, FGF21KO. *P < 0.05, **P < 0.01, and ***P < 0.001.
Fig. 6.
Fig. 6.. TAM polarization mediated NSAH-HCC transition in FGF21KO mice.
(A) The volcano plots for the profile of DEGs in isolated macrophages/KCs from the liver tissues (MASH versus controls and MASH-HCC versus control) and the overlapping DEGs. (B) Fifteen enriched pathways were identified in MASH and MASH-HCC. (C and D) Up-regulated PPARδ in the lipid metabolism pathway and up-regulated IL10 in the inflammation/cytokine pathway were identified. (E) Immunofluorescent staining using the antibodies of anti-F4/80 and anti-CD206 to detect the M2 polarization of macrophages in FGF21KO-MASH-HCC mice, FGF21KO-MASH, and WT control mice. Red, F4/80-positive cells; green, CD206-positive cells; blue, positive DAPI staining to detect the nuclei as a counterstain. (F) qPCR detection for the markers of M2/TAM polarization in the isolated macrophages/KCs from FGF21KO-MASH-HCC mice, FGF21KO-MASH mice, and WT control mice. (G) Schematic diagram of mouse BMDMs treated with HCM, HCM + S1P, and Dulbecco’s modified Eagle’s medium (DMEM). qPCR detection for the markers of M2/TAM polarization in BMDMs induced by HCM and HCM + S1P. The protein levels of PPARβ/δ and IL-10 in BMDMs with treatments of HCM and HCM + S1P. (H) The mRNA fold changes of IL-4 by qPCR and the protein levels of IL-4 and phosphorylated STAT6 in BMDMs treated with HCM + S1P and HCM + S1P + SKI-II. BMDMs, bone marrow–derived macrophages. HCM, culture medium of Hepal-6 cells. *P < 0.05, **P < 0.01, and ***P < 0.001.
Fig. 7.
Fig. 7.. Schematic diagram of working hypothesis.
The major signaling components mediated alteration of KC homeostasis and carcinogenetic transition polarization mediated NSAH-HCC transition being studied. HFMCD, high-fat methionine/choline-deficient diet; WSHFD, Western-style diet (high-fat and high-fructose); M1, macrophage M1 polarization; M2, macrophage M2 polarization; TAM, tumor-associated macrophage.

References

    1. Marengo A., Rosso C., Bugianesi E., Liver cancer: Connections with obesity, fatty liver, and cirrhosis. Annu. Rev. Med. 67, 103–117 (2016). - PubMed
    1. Estes C., Razavi H., Loomba R., Younossi Z., Sanyal A. J., Modeling the epidemic of nonalcoholic fatty liver disease demonstrates an exponential increase in burden of disease. Hepatology 67, 123–133 (2018). - PMC - PubMed
    1. Hirode G., Vittinghoff E., Wong R. J., Increasing clinical and economic burden of nonalcoholic fatty liver disease among hospitalized adults in the United States. J. Clin. Gastroenterol. 53, 765–771 (2019). - PubMed
    1. Ludwig J., Viggiano T. R., McGill D. B., Oh B. J., Nonalcoholic steatohepatitis: Mayo Clinic experiences with a hitherto unnamed disease. Mayo Clin. Proc. 55, 434–438 (1980). - PubMed
    1. Tilg H., Moschen A., Update on nonalcoholic fatty liver disease: Genes involved in nonalcoholic fatty liver disease and associated inflammation. Curr. Opin. Clin. Nutr. Metab. Care 13, 391–396 (2010). - PubMed

MeSH terms