. 2024 Oct 25;10(43):eadp4726.
doi: 10.1126/sciadv.adp4726. Epub 2024 Oct 23.

Acute contact with profibrotic macrophages mechanically activates fibroblasts via αvβ3 integrin-mediated engagement of Piezo1

Affiliations

Acute contact with profibrotic macrophages mechanically activates fibroblasts via αvβ3 integrin-mediated engagement of Piezo1

Maya Ezzo et al. Sci Adv. .

Abstract

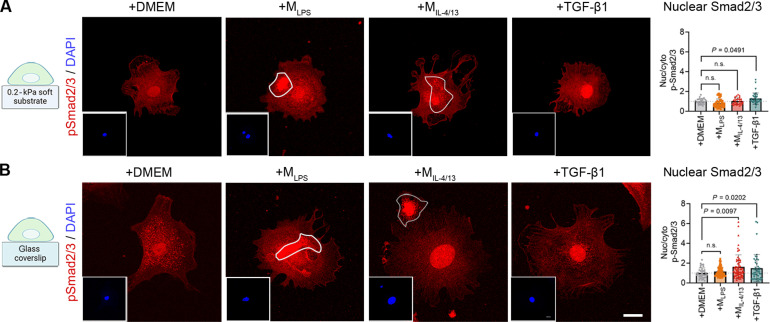
Fibrosis-excessive scarring after injury-causes >40% of disease-related deaths worldwide. In this misguided repair process, activated fibroblasts drive the destruction of organ architecture by accumulating and contracting extracellular matrix. The resulting stiff scar tissue, in turn, enhances fibroblast contraction-bearing the question of how this positive feedback loop begins. We show that direct contact with profibrotic but not proinflammatory macrophages triggers acute fibroblast contractions. The contractile response depends on αvβ3 integrin expression on macrophages and Piezo1 expression on fibroblasts. The touch of macrophages elevates fibroblast cytosolic calcium within seconds, followed by translocation of the transcription cofactors nuclear factor of activated T cells 1 and Yes-associated protein, which drive fibroblast activation within hours. Intriguingly, macrophages induce mechanical stress in fibroblasts on soft matrix that alone suppresses their spontaneous activation. We propose that acute contact with suitable macrophages mechanically kick-starts fibroblast activation in an otherwise nonpermissive soft environment. The molecular components mediating macrophage-fibroblast mechanotransduction are potential targets for antifibrosis strategies.


Figures

Fig. 1.
Fig. 1.. Acute Mϕ contact induces fibroblast stress on soft substrates.
(A) Fibroblasts on 0.2-kPa soft gelatine-coated substrates were incubated with MLPS or MIL-4/13. (B) After 2 hours, immunostaining for YAP (green), 4,6-diamidino-2-phenylindole (DAPI) (blue, insets), and F-actin (white, insets) was performed for control fibroblasts (+DMEM), in contact with MLPS or MIL-4/13 (outlined), and treated with contraction agonist TRAP6. (C) TAZ-citrine–transfected fibroblasts (yellow) were seeded for 1 hour and then imaged for 3 hours on 0.2-kPa silicone substrates modified to observe wrinkle formation (phase contrast); MIL-4/13 were added after 15 min of imaging. Nuclear TAZ levels were measured, and mean fluorescence intensities (MFIs) were normalized to the first time frame. Parallel samples were stained to plot the MFIs of only nuclear or ratios of nuclear to cytoplasmic YAP over TAZ-citrine. (D) Correspondingly, lysates were processed for Western blotting and assessed for expression of total YAP, active YAP (arrow, expected molecular weight), and phosphorylated YAP (p-YAP) with vinculin and vimentin as loading controls. To have comparable protein loading to Mϕ-fibroblast cocultures (“contact”), fibroblasts and Mϕ were cultured alone for the same time but mixed just before lysis (“separated”). (E) Western blot band intensities for active YAP and p-YAP, normalized to total YAP. (F) Quantitative reverse transcription polymerase chain reaction was performed with cells grown in the same conditions to measure YAP target genes, normalized to Gapdh. All column graphs show mean values (±SD) after normalization to fibroblasts grown alone in control DMEM. Experiments were performed with cells from three different mice, every data point representing one biological repeat, except in (B) and (C), where every data point represents one of 40 to 50 fibroblasts. All scale bars, 20 μm. Statistical significance was calculated using repeated measures analysis of variance (ANOVA), and Fisher’s least significant difference (LSD) post hoc analysis with significance reached with P < 0.05 and “n.s.” indicating not significant.
Fig. 2.
Fig. 2.. Acute Mϕ contact induces fibroblast nuclear Smad translocation on stiff substrates.
Fibroblasts were grown on gelatin-coated (A) soft 0.2-kPa substrates or (B) glass coverslips for 1 hour before being immunostained for pSmad2/3 (red) and DAPI (blue, inset). Compared are fibroblasts in control medium (+DMEM), in contact with MLPS or MIL-4/13, and treated with the Smad signaling agonist TGF-β1. Scale bar, 20 μm. The ratios of pSmad2/3 nuclear to cytoplasmic staining intensity were quantified from immunofluorescence images. Experiments were performed with cells cultured from three biological repeats, every data point representing each cell. Statistical significance was calculated from the mean values of the biological repeats (n = 3) using repeated measures ANOVA and Fisher’s LSD post hoc analysis with significance reached with P < 0.05 and “n.s.” indicating not significant.
Fig. 3.
Fig. 3.. Mϕ contact enhances fibroblast contraction amplitude and speed.
(A) Regions of interest (ROIs) of cross-shaped patterns on FLECS and nuclei were binarized and overlaid to cross patterns without cells (blue ROIs). The area fraction of the crosses was quantified in each image frame and compared to the initial frame. Fibroblasts were seeded on FLECS for 30 min before imaging to allow for cell adhesion. Mϕ were added after an additional 30 min and were imaged for a total of 2 hours. (B) Fibroblasts (green outlines) on FLECS pattern (red) alone or in coculture with MLPS (orange outlines) or MIL-4/13 (pink outlines) at selected time points. Scale bar, 20 μm. (C) Fibroblast contraction is plotted as the inverse of the pattern area fraction over time. Time t = 0 is the addition of control DMEM or Mϕ contact. The means of 40 to 60 fibroblasts per individual experiment from three biological repeats are shown: (D) maximum contraction after 90 min and (E) the slope of contraction curves normalized to contraction speed before t = 0. (F) The resulting contraction speeds are either classified as accelerated compared to fibroblasts alone or not changed and plotted as a percentage. (G) Schematic of concentration series of MLPS addition, increasing the fibroblasts: Mϕ ratio from 1:1 to 1:10. (H to K) Fibroblast contraction of patterns is analyzed as described for (C) to (F) from 20 to 60 fibroblasts per individual experiments from three biological repeats. (L) Schematic of concentration series of MIL-4/13 addition, increasing the fibroblasts: Mϕ ratio from 1:1 to 1:10. (M to P) Fibroblast contraction of patterns are analyzed as described for (C) to (F) from 20 to 60 fibroblasts per individual experiment from three biological repeats. Statistical significance was calculated using repeated measures ANOVA and Fisher’s LSD post hoc analysis with significance reached with P < 0.05 and “n.s.” indicating not significant.
Fig. 4.
Fig. 4.. Acute profibrotic Mϕ contact induces local fibroblast contractions.
(A) 3D confocal-reflection image of a 60-μm-thick collagen gel (white) with red fluorescent beads on the surface. (B) Orthogonal view of collagen gel with fibroblast (center, gray) and Mϕ (small white) in plane with fluorescent beads on the surface. (C) Scanning electron microscope image of fibroblast with MIL-4/13 on collagen gel. (D) To visualize bead displacement, every frame was assigned a different color and overlaid to create a temporal color-code image of fibroblasts alone, fibroblasts with MLPS, and fibroblasts with MIL-4/13 over 80 min. (E) Fibroblast contractions were quantified by summing the vector norms of all bead displacements (in micrometers). Averages are shown ± SD for two to three fibroblasts from three independent experiments. (F) Speed of fibroblast contractions measured as the slope of the curves in (E), normalized to unstimulated contraction before t = 0. BD, before DMEM; AD, after DMEM; BC, before contact; AC, after contact. (G) Summary of contraction speeds. (H) The resulting contraction speeds are either classified as accelerated compared to fibroblasts alone or not changed and plotted as a percentage. (I) Maximum contraction for each fibroblast from curves in (E); each dot represents one fibroblast. (J) Traction force microscopy was performed to monitor local fibroblast contractions upon Mϕ contact, with local stress (pascals) shown color coded. MIL-4/13 (outlined in pink) contact the fibroblast (green outline) at various contact time points; outlines of the MIL-4/13 remain throughout all images when contact was made in the previous frame, with arrows indicating the point of contact. Scale bar, 20 μm. Fibroblast contraction analyzed as described for (E) to (G) from four to six fibroblasts from three biological repeats. Statistical significance was calculated using repeated measures ANOVA and Fisher’s LSD post hoc analysis with significance reached with P < 0.05 and “n.s.” indicating not significant.
Fig. 5.
Fig. 5.. Acute profibrotic Mϕ contact induces local fibroblast stress.
(A) Fibroblasts were spread on glass coverslips for 60 min to a circular shape before MIL-4/13 or medium (+DMEM) were added for another 60 min, followed by staining for p-MLC (red) and DAPI (blue). (B) MFI of p-MLC of fibroblasts; quantified were 90 to 100 fibroblasts in total from three biological repeats. (C) Deviation from regular circular fibroblast spreading was quantified using cell circularity and solidity from binary images. Circularity [4×pi×area/(perimeter)2] is 1 for a circle; solidity [area/convex area] is a measure of cell perimeter smoothness with 1 being perfectly smooth. (D) Representative image of a Flipper-TR–stained fibroblast in contact (arrow) with an unstained MIL-4/13 where the lifetime (nanoseconds) of the Flipper-TR probe is color coded. (E) AFM height image of a fibroblast in contact with a MIL-4/13 (yellow outline) on a stiff substrate; the force curve analysis display of Young’s moduli (kilopascals) is color coded. All scale bars, 20 μm. Experiments were performed with cells cultured from three biological repeats, where every data point represents each cell. Statistical significance was calculated using repeated measures paired t tests, repeated measures ANOVA, and Fisher’s LSD post hoc analysis with significance reached with P < 0.05 and “ns” indicating not significant.
Fig. 6.
Fig. 6.. Acute profibrotic Mϕ induced calcium influx in fibroblasts.
(A) Fibroblasts were seeded onto gelatine-coated glass coverslips for 12 hours before being transfected with GCaMP6s, which fluoresces upon binding of Ca2+ and imaged after another 24 hours. After 1 min of imaging, MLPS or MIL-4/13 was added. (B) Ca2+ imaging (1 frame/5 s) of a fibroblast-Mϕ contact (arrow) scenario. Scale bar, 10 μm. (C) Kymograph over the fibroblast- MIL-4/13 contact region (dashed line) where the white arrow points to the contact moment. Scale bar, 10 μm. (D) GCaMP6s fluorescence intensity of the fibroblast was quantified and normalized to fluorescence at the beginning of the recording, and mean values were plotted with SD over time. The bar graph summarizes the maximum Ca2+ intensities of one to three fibroblasts from three experiments. (E) To follow the downstream effects of Ca2+ influx, fibroblasts were stained for NFAT1 (green) and F4/80 (red) to distinguish between fibroblast and Mϕ. DAPI (blue, insets). Scale bar, 20 μm. (F) Quantification of nuclear levels of NFAT1 of 10 to 20 fibroblasts from three biological repeats shown as averages with SD. Statistical significance was calculated using repeated measures ANOVA and Fisher’s LSD post hoc analysis with significance reached with P < 0.05 and “ns” indicating not significant.
Fig. 7.
Fig. 7.. Cx43 does not mediate direct communication between fibroblasts and MIL-4/13.
(A) Working model of Cx43 formation between Mϕ and fibroblasts. (B) Representative image of Cx43 expression between fibroblast-fibroblasts and fibroblast-Mϕ. Cx43 (green), DAPI (blue), and F4/80 (red). Scale bar, 20 μm. (C) Protein level of Cx43 in Mϕ treated with LPS (MLPS) or IL-4/13 (MIL-4/13), and fibroblasts with nontargeting (NT) siRNA or 10 nmol of Cx43 siRNA. (D) Quantification of relative protein and mRNA expression of Cx43 after knockdown. (E) Schematic of gap junction assay. (F) Standard curve of increasing calcein-AM concentrations in fibroblasts. Fibroblasts loaded with calcein-AM from 0 to 10 μm. (G) Flow histograms of unstained fibroblasts and MIL-4/13 coculture (gray), wild-type (WT) fibroblasts (red) in coculture with 10 μM calcein-AM loaded MIL-4/13, Cx43 knockdown fibroblasts (blue) in coculture with 10 μM calcein-AM loaded MIL-4/13, and 10 μM calcein-AM in fibroblast and MIL-4/13 monocultures (green); F4/80-positive cells were sorted out to differentiate between fibroblasts and MIL-4/13. (H) Flow histograms of unstained fibroblasts (gray), WT fibroblasts (red), Cx43 knockdown fibroblasts (blue), 10 μM calcein-AM in fibroblast monoculture (green). Statistical significance was calculated using paired t tests with significance reached with P < 0.05.
Fig. 8.
Fig. 8.. Piezo1 mediates cytosolic Ca2+ elevation in fibroblasts upon Mϕ contact.
(A) SAC working model. (B) Fibroblast contraction of FLECS patterns is shown after pretreatment with GsMTx4 with time t = 0 indicating the addition of control DMEM or Mϕ contact. Mean values from 50 to 80 fibroblasts per experiment are shown for three biological repeats: (C) maximum contraction after 90 min and (D) contraction speed. (E) Percentages of fibroblasts with accelerated contraction over to fibroblasts alone are shown as percentage of all fibroblasts. (F) The Ca2+ downstream effector NFAT1 (green) was costained with DAPI (blue, inset) and F-actin (gray, inset) in control fibroblasts (+DMEM), pretreated with SAC inhibitor GsMTx4, with and without contacting MIL-4/13 (outlined). (G) Nuclear NFAT1 immunofluorescence staining intensity was quantified over 20 to 30 fibroblasts per experiment; shown are averages (±SD) from four experiments. (H) Fibroblasts mRNA levels of Piezo2 and Piezo1 are shown in comparison and after Piezo1 knockdown as averages (±SD) from three to five experiments. (I) Cytosolic Ca2+ levels were measured using Fluo-4 AM in Piezo1 knockdown fibroblasts and fibroblasts treated with dimethyl sulfoxide (DMSO) (control) or Yoda1 (Piezo1 agonist). After 8 min, fibroblasts were treated with ionomycin to open all Ca2+ stores. (J) Fibroblasts transfected with nontargeting (NT) or Piezo1 siRNA, kept in control medium (+DMEM) or contacted with MIL-4/13 for 2 hours before being stained for NFAT1 (green), DAPI (blue), and F-actin (gray). (K) Nuclear NFAT1 staining intensity is quantified from images of 20 to 40 fibroblasts per experiment; shown are averages (±SD) from three biological repeats. All scale bars, 20 μm. Statistical significance was calculated using repeated measures paired t tests, repeated measures ANOVA, and Fisher’s LSD post hoc analysis with significance reached with P < 0.05 and “ns” indicating not significant.
Fig. 9.
Fig. 9.. The Mϕ integrin αvβ3 mediates fibroblast Ca2+ and contraction responses.
(A) Single-cell datasets of naïve (M-CSF only), LPS, or IL-4/13–treated Mϕ from Li and co-workers. The MacSpectrum situates Mϕ polarization states by activation-induced Mϕ differentiation index (AMDI)—the degree of Mϕ terminal maturation, versus Mϕ polarization index (MPI)—the polarity of Mϕ activation. (B) Using the author’s MacBrowser, MIL-4/13 were found to uniquely express β3 integrin. (C) Working model of MIL-4/13 αvβ3 integrin pulling on the fibroblast membrane. (D) Mϕ were stained for αv and β3 integrin and analyzed by flow cytometry. F4/80-positive MLPS (orange) and MIL-4/13 (red) were compared to unstained Mϕ (gray) and gated to confirm the absence of the platelet-specific αIIb (CD41) and expression of (E) αv and β3 integrin. (F) MIL-4/13 were pretreated with αvβ3 integrin inhibitor cyclo(-RGDfk) or control and spread on fibroblasts before being stained after 1 hour for β3 integrin (black, inverted immunofluorescence), F-actin (gray), and DAPI (blue); Mϕ are outlined. (G) Fibroblast Ca2+ responses were assessed by staining for NFAT1 (green), DAPI (blue, inset), and F-actin (gray, inset). Nuclear NFAT1 was quantified from 20 to 30 fibroblasts per three biological experiments. (H) Fibroblast contraction of FLECS patterns was quantified in control medium (+DMEM) or with MIL-4/13, αvβ3 integrin–blocked MIL-4/13, or anti–β3 integrin antibody (Axum4)–blocked MIL-4/13. Time t = 0, the addition of control DMEM or Mϕ contact. (I) Maximum contraction after 90 min and (J) the slope of contraction curves normalized to contraction speed before t = 0. (K) Percentages of fibroblasts with accelerated contraction over to fibroblasts alone are shown as percent of all fibroblasts. Shown are the averages of 30 to 50 fibroblasts per experiment from three biological repeats. Scale bars, 20 μm. Statistical significance was calculated using repeated measures ANOVA and Fisher’s LSD post hoc analysis with significance reached with P < 0.05 and “ns” indicating not significant.
Fig. 10.
Fig. 10.. CD206 and αvβ3 integrin–positive Mϕ characterize induced mouse lung fibrosis.
(A) Mouse model of bleomycin-induced lung fibrosis; controls are mouse lungs excised 21 days after saline injection. (B) Paraffin tissue sections were produced from mouse lungs 7 and 21 days after the instillation of bleomycin or saline (21 days) as control. Immunofluorescence shows expression of β3 integrin (green), the profibrotic Mϕ marker CD206 (red), the myofibroblast marker α-SMA (white), and cell nuclei (DAPI, blue) in low- (top row) and high-magnification (bottom row) confocal images. Arrows are pointing to β3 integrin and CD206 double-positive Mϕ. (C) Summary: A recruited Mϕ establishes contact with a myofibroblast precursor, reinforced through αvβ3 integrins. The mechanical attachment of the Mϕ contact results in increased membrane tension in the fibroblast. Increased membrane tension opens Piezo1, which introduces an influx of Ca2+ into the fibroblast. The influx of Ca2+ can result in phosphorylation of myosin light chain that would induce contraction and/or translocate NFAT1 into the nucleus. Repeated and persistent contractions alter the cytoskeleton of fibroblast and allow nuclear translocation of YAP and enhanced expression of myofibroblast-related genes such as Acta2. Continuous YAP activation eventually leads to myofibroblast activation. Created with BioRender.com.

References

    1. Moss B. J., Ryter S. W., Rosas I. O., Pathogenic mechanisms underlying idiopathic pulmonary fibrosis. Annu. Rev. Pathol. 17, 515–546 (2022). - PubMed
    1. Schuster R., Younesi F., Ezzo M., Hinz B., The role of myofibroblasts in physiological and pathological tissue repair. Cold Spring Harb. Perspect. Biol. 15, (2023). - PMC - PubMed
    1. Younesi F. S., Miller A. E., Barker T. H., Rossi F. M. V., Hinz B., Fibroblast and myofibroblast activation in normal tissue repair and fibrosis. Nat. Rev. Mol. Cell Biol. 25, 617–638 (2024). - PubMed
    1. El Agha E., Thannickal V. J., The lung mesenchyme in development, regeneration, and fibrosis. J. Clin. Invest. 133, e170498 (2023). - PMC - PubMed
    1. Nho R. S., Ballinger M. N., Rojas M. M., Ghadiali S. N., Horowitz J. C., Biomechanical force and cellular stiffness in lung fibrosis. Am. J. Pathol. 192, 750–761 (2022). - PMC - PubMed

LinkOut - more resources