. 2025 Jan 13;48(1):zsae244.
doi: 10.1093/sleep/zsae244.

Pharmacological inhibition of histamine N-methyltransferase extends wakefulness and suppresses cataplexy in a mouse model of narcolepsy

Affiliations

Pharmacological inhibition of histamine N-methyltransferase extends wakefulness and suppresses cataplexy in a mouse model of narcolepsy

Fumito Naganuma et al. Sleep. .

Abstract

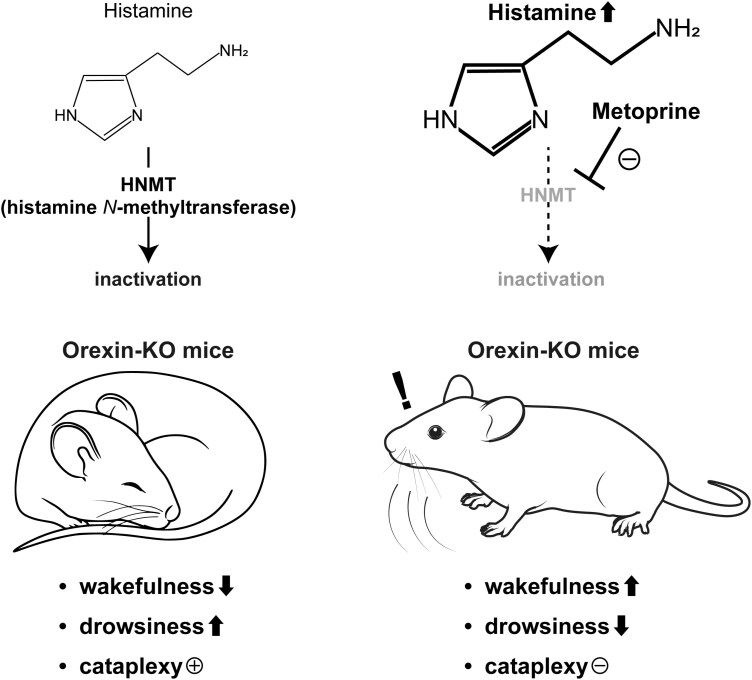
Histamine, a neurotransmitter, plays a predominant role in maintaining wakefulness. Furthermore, our previous studies showed that histamine N-methyltransferase (HNMT), a histamine-metabolizing enzyme, is important for regulating brain histamine concentration. However, the effects of pharmacological HNMT inhibition on mouse behavior, including the sleep-wake cycle and cataplexy, in a mouse model of narcolepsy have not yet been investigated. In the present study, we investigated the effects of metoprine, an HNMT inhibitor with high blood-brain barrier permeability, in wild-type (WT) and orexin-deficient (OxKO) narcoleptic mice. Metoprine increased brain histamine concentration in a time- and dose-dependent manner without affecting peripheral histamine concentrations. Behavioral tests showed that metoprine increased locomotor activity in both novel and familiar environments, but did not alter anxiety-like behavior. Sleep analysis showed that metoprine increased wakefulness and decreased non-rapid eye movement (NREM) sleep through the activation of the histamine H1 receptor (H1R) in WT mice. In contrast, the reduction of rapid eye movement (REM) sleep by metoprine occurred independent of H1R. In OxKO mice, metoprine was found to prolong wakefulness and robustly suppress cataplexy. In addition, metoprine has a greater therapeutic effect on cataplexy than pitolisant, which induces histamine release in the brain and has been approved for patients with narcolepsy. These data demonstrate that HNMT inhibition has a strong effect on wakefulness, demonstrating therapeutic potential against cataplexy in narcolepsy.

Keywords: histamine; histamine N-methyl transferase; metoprine; narcolepsy; wakefulness.


Figures

Graphical Abstract
Graphical Abstract
Figure 1.
Figure 1.
Metoprine increased brain histamine concentration. (A) The i.p. injection of metoprine significantly increased brain histamine concentration in the cortex, diencephalon, brainstem, and cerebellum in a dose-dependent manner. *p < .05, **P < .01: One-way ANOVA followed by Tukey’s multiple comparisons test (n = 4; for cortex: F = 11.25, p = .0008, for diencephalon: F = 7.35, p = .005, for brainstem: F = 7.04, p = .006, for cerebellum: F = 12.40, p = .0005). (B) metoprine decreased 1-methylhistamine concentration. *p < .05, **p < .01: One-way ANOVA followed by Tukey’s multiple comparisons test (n = 4; for cortex: F = 5.31, p = .015, for diencephalon: F = 4.88, p = .019, for brainstem: F = 9.04, p = .0021, for cerebellum: F = 7.06, p = .0054). (C) Metoprine also increased and decreased extracellular histamine and 1-methylhistamine concentrations in a time-dependent manner, respectively. *p < .05, **p < .01: One-way ANOVA followed by Dunnett’s multiple comparisons test (0 h vs several time points; n = 4; for histamine: F = 5.31, p = .0036, for 1-methyl histamine: F = 5.14, p = .0042). (D) Metoprine continually increases extracellular histamine concentration in the prefrontal cortex. (analyzed 4 hours of data after vehicle or metoprine injection) †p < .05; Two-way RM ANOVA for “time” and ‘drug injection’ (n = 4; interaction F (11,66) = 1.5, p = .14, time F(11,66) = 1.28, p = .25, drug F (1,6) = 8.28, p = .028). The Shapiro–Wilk test confirmed the normal distribution of the data.
Figure 2.
Figure 2.
Metoprine increased locomotor activity without the effect on anxiety-like behaviors. In the open field test, metoprine significantly increased traveled time (A), traveled distance (B) and average speed (C) without an effect on the time spent in the central area (D). ***p < .005; Two-way RM ANOVA followed by Sidak’s multiple comparisons test. (n = 10, Two-way RM ANOVA for “time” and ‘drug injection’, for (A): interaction F (5,90) = 9.44, p < .0001, time F (3.35,60.4) = 9.76, p < .0001, drug F (1,18) = 87.83, p < .0001, for (B): interaction F (5,90) = 7.12, p < .0001, time F (5,90) = 9.33, p < .0001, drug F (1,18) = 112.3, p < .0001, for (C): interaction F (5,90) = 4.44, p = .0012, time F (5,90) = 7.64, p < .0001, drug F (1,18) = 66.48, p < .0001, for (D): interaction F (5,90) = 1.78, p = .12, time F (5,90) = 7.87, p < .0001, drug F (1,18) = 2.03, p = .17). (E) In the elevated zero maze, metoprine did not affect the time spent in the open area (n = 10, unpaired t test, p = .70). (F) Metoprine injection at ZT0 (starting time of light period) significantly increased locomotor activity in the home cage. (G) Metoprine injection at ZT12 (starting time of dark period) tended to increase the locomotor activity in the home cage. †p < .05, ††p < .01; Two-way RM ANOVA for “time” and ‘drug injection’ (n = 12; for (F), interaction F (7,154) = 2.05, p = .53, time F (3.31,72.85) = 22.87, p < .0001, drug F (1,22) = 6.07, p = .022, for (G), interaction F (7,154) = 2.41, p = .023, time F (2.97,65.32) = 26.17, p < .0001, drug F (1,22) = 2.13, p = .16). There were no significant differences using Sidak’s multiple comparisons test.
Figure 3.
Figure 3.
Metoprine significantly increased wakefulness and decreased NREM sleep via H1R activation. The 3-hourly percentages, bout number, and mean duration of each sleep–wake episode after vehicle or drug(s) injection at ZT3. Pyrilamine and zolantidine are H1R antagonists and H2R antagonists, respectively. The percentage of wakefulness (A), NREM sleep (B) and REM sleep (C). The bout number of wakefulness (D), NREM sleep (E) and REM sleep (F). The mean duration of wakefulness (G). NREM sleep (H) and REM sleep (I). (J) The latency to first NREM sleep and REM sleep after drug administration. (A-I) *p < .05, **p < .01, ***p < .001; Two-way RM ANOVA followed by Tukey’s multiple comparisons test (n = 7, Two-way RM ANOVA for “time” and ‘drug injection’, for (A): interaction F (3,20) = 2.93, p = .059, time F (1,20) = 42.47, p < .0001, drug F (3,20) = 25.15, p < .0001, for (B): interaction F (3,20) = 3.24, p = .044, time F (1,20) = 43.63, p < .0001, drug F (3,20) = 21.27, p < .0001, for (C): interaction F (3,20) = 0.11, p = .96, time F (1,20) = 6.18, p = 0.017, drug F (3,20) = 36.42, p < .0001, for (D): interaction F (3,20) = 5.09, p = .0088, time F (1,20) = 31.84, p < .0001, drug F (3,20) = 14.44, p < .0001, for (E): interaction F (3,20) = 4.86, p = .011, time F (1,20) = 33.22, p < .0001, drug F (3,20) = 14.51, p < .0001, for (F): interaction F (3,20) = 1.13, p = .36, time F (1,20) = 4.70, p = .043, drug F (3,20) = 17.44, p < .0001, for (G): interaction F (3,20) = 18.50, p < .0001, time F (1,20) = 51.40, p < .0001, drug F (3,20) = 18.41, p < .0001, for (H): interaction F (3,20) = 2.10, p = .13, time F (1,20) = 15.54, p = .0008, drug F (3,20) = 2.97, p = .057, for (I): interaction F (3,20) = 1.11, p = .37, time F (1,20) = 7.46, p = .013, drug F (3,20) = 12.16, p < .0001). (J) ***p < .001; One-way ANOVA followed by Tukey’s multiple comparisons test (NREM) F (3, 20) = 32.92, p < .0001, (REM) F (3, 20) = 32.43, p < .0001.
Figure 4.
Figure 4.
Metoprine significantly increased wakefulness and suppressed cataplexy in OxKO mice. The 3-hourly percentages, bout number, and mean duration of each sleep–wake episodes or cataplexy after vehicle or drug(s) injection at ZT12. The percentage of wakefulness (A), NREM sleep (B), REM sleep (C) and cataplexy (D). The bout number of wakefulness (E), NREM sleep (F), REM sleep (G) and cataplexy (H). The mean duration of wakefulness (I). NREM sleep (J), REM sleep (K) and cataplexy (L). (M) The latency to first NREM sleep and REM sleep after drug administration. (A-L) *p < .05, **p < .01, ***p < .001; Two-way RM ANOVA followed by Tukey’s multiple comparisons test (n = 7, Two-way RM ANOVA for “time” and ‘drug injection’, for (A): interaction F (3,24) = 2.34, p = .099, time F (1,24) = 17.86, p = .0003, drug F (3,20) = 7.78, p = .0008, for (B): interaction F (3,24) = 2.46, p = .087, time F (1,24) = 10.80, p = .0031, drug F (3,24) = 7.18, p = .0031, for (C): interaction F (3,24) = 4.84, p = .0090, time F (1,24) = 5.05, p = .034, drug F (3,24) = 5.12, p = .0070, for (D): interaction F (3,24) = 10.61, p = .0001, time 1,24) = 18.70, p = .0002, drug F (3,24) = 69.12, p < .0001, for (E): interaction F (3,24) = 1.85, p = .17, time F (1,24) = 17.26, p = .0004, drug F (3,24) = 8.87, p = .0004, for (F): interaction F (3,24) = 2.65, p = .072, time F (1,24) = 8.96, p = .0063, drug F (3,24) = 9.85, p = .0002, for (G): interaction F (3,24) = 5.00, p = .0078, time F (1,24) = 4.91, p = .037, drug F (3,24) = 4.31, p = .014, for (H): interaction F (3,24) = 3.76, p = .024, time F (1,24) = 10.98, p = .0029, drug F (3,24) = 29.63, p < .0001, for (I): interaction F (3,24) = 4.37, p = .014, time F (1,24) = 15.00, p = .0007, drug F (3,24) = 8.79, p = .0004, for (J): interaction F (3,24) = 2.19, p = .12, time F (1,24) = 4.28, p = .049, drug F (3,24) = 4.20, p = .016, for (K): interaction F (3,24) = 1.91, p = .16, time F (1,24) = 1.88, p = .18, drug F (3,24) = 7.14, p = .0014, for (L): interaction F (3,24) = 2.67, p = .070, time F (1,24) = 1.36, p = .25, drug F (3,24) = 92.86, p < .0001). (M) *p < .05, **p < .01, ***p < .001; One-way ANOVA followed by Tukey’s multiple comparisons test (NREM) F (3, 24) = 8.04, p = .0007, (REM) F (3, 20) = 2.88, p = .057, (cataplexy) F (3, 24) = 112.6, p < .0001.
Figure 5.
Figure 5.
The efficacy of metoprine on cataplexy suppression was stronger than that of pitolisant. The 3-hourly percentages, bout number, and mean duration of each sleep–wake episode or cataplexy after vehicle or drug(s) injection at ZT12. The percentage of wakefulness (A), NREM sleep (B), REM sleep (C) and cataplexy (D). The bout number of wakefulness (E), NREM sleep (F), REM sleep (G) and cataplexy (H). The mean duration of wakefulness (I). NREM sleep (J), REM sleep (K) and cataplexy (L). (M) The latency to first NREM sleep and REM sleep after drug administration. (N) spectral distribution of EEG power densities during wakefulness. (O) The theta–delta ratio of EEG during wakefulness. (A-L) *p < .05, **p < .01, ***p < .001; Two-way RM ANOVA followed by Tukey’s multiple comparisons test (n = 7, Two-way RM ANOVA for “time” and ‘drug injection’, for (A): interaction F (2,18) = 5.27, p = .016, time F (1,18) = 9.11, p = .0074, drug F (2,18) = 11.41, p = .0006, for (B): interaction F (2,18) = 2.02, p = .16, time F (1,18) = 0.17, p = .68, drug F (2,18) = 3.21, p = .064, for (C): interaction F (2,18) = 2.85, p = .084, time F (1,18) = 7.27, p = .015, drug F (2,18) = 4.00, p = .037, for (D): interaction F (2,18) = 11.16, p = .0007, time F (1,18) = 47.52, p < .0001, drug F (2,18) = 27.03, p < .0001, for (E): interaction F (2,18) = 3.77, p = .043, time F (1,18) = 10.04, p = .0053, drug F (2,18) = 9.66, p = .0014, for (F): interaction F (2,18) = 1.03, p = .38, time F (1,18) = 0.39, p = .54, drug F (2,18) = 2.11, p = .15 for (G): interaction F (2,18) = 2.51, p = .11, time F (1,18) = 8.76, p = .0084, drug F (2,18) = 3.62, p = .045, for (H): interaction F (2,18) = 3.70, p = .045, time F (1,18) = 31.91, p < .0001, drug F (2,18) = 12.96, p = .0003, for (I): interaction F (2,18) = 1.51, p = .24, time F (1,18) = 6.16, p = .023, drug F (2,18) = 14.67, p = .0002, for (J): interaction F (2,18) = 1.10, p = .35, time F (1,18) = 0.0070, p = .93, drug F (2,18) = 4.65, p = .024, for (K): interaction F (2,18) = 1.14, p = .34, time F (1,18) = 5.39, p = .032, drug F (2,18) = 3.24, p = .063, for (L): interaction F (2,18) = 1.76, p = .20, time F (1,18) = 1.07, p = .31, drug F (2,18) = 22.13, p < .0001). (M and O) *p < .05, *** p < .001; one-way ANOVA followed by Tukey’s multiple comparisons test (M, n = 7, for NREM, F (2,18) = 4.35, p = .029, for REM, F (2,18) = 2.89, p = .081, for cataplexy, F (2,18) = 104.5, p < .0001) (O, n = 7, F (2,18) = 4.05, p = .035).

References

    1. Yoshikawa T, Naganuma F, Iida T, et al. Molecular mechanism of histamine clearance by primary human astrocytes. Glia. 2013;61(6):905–916. doi: https://doi.org/ 10.1002/glia.22484 - DOI - PubMed
    1. Haas H, Panula P. The role of histamine and the tuberomamillary nucleus in the nervous system. Nat Rev Neurosci. 2003;4(2):121–130. doi: https://doi.org/ 10.1038/nrn1034 - DOI - PubMed
    1. Haas HL, Sergeeva OA, Selbach O. Histamine in the nervous system. Physiol Rev. 2008;88(3):1183–1241. doi: https://doi.org/ 10.1152/physrev.00043.2007 - DOI - PubMed
    1. Naganuma F, Nakamura T, Kuroyanagi H, et al. Chemogenetic modulation of histaminergic neurons in the tuberomamillary nucleus alters territorial aggression and wakefulness. Sci Rep. 2021;11(1):17935. doi: https://doi.org/ 10.1038/s41598-021-95497-3 - DOI - PMC - PubMed
    1. Thakkar MM. Histamine in the regulation of wakefulness. Sleep Med Rev. 2011;15(1):65–74. doi: https://doi.org/ 10.1016/j.smrv.2010.06.004 - DOI - PMC - PubMed