. 2024 Dec;636(8041):162-171.
doi: 10.1038/s41586-024-08250-x. Epub 2024 Oct 23.

Long-term lineage commitment in haematopoietic stem cell gene therapy

Affiliations

Long-term lineage commitment in haematopoietic stem cell gene therapy

Andrea Calabria et al. Nature. 2024 Dec.

Abstract

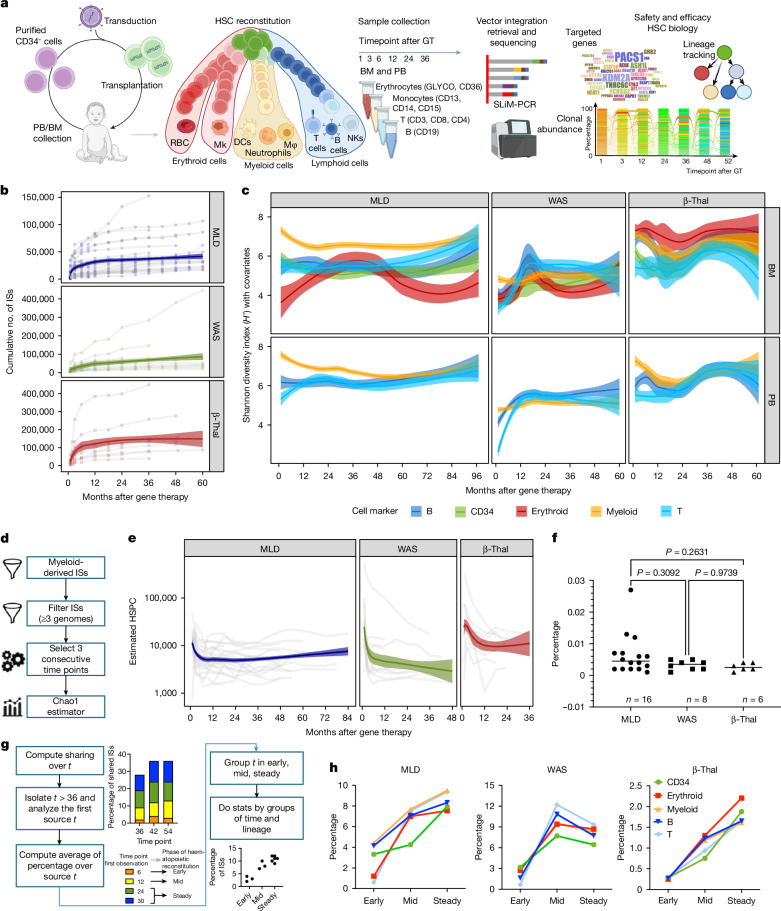
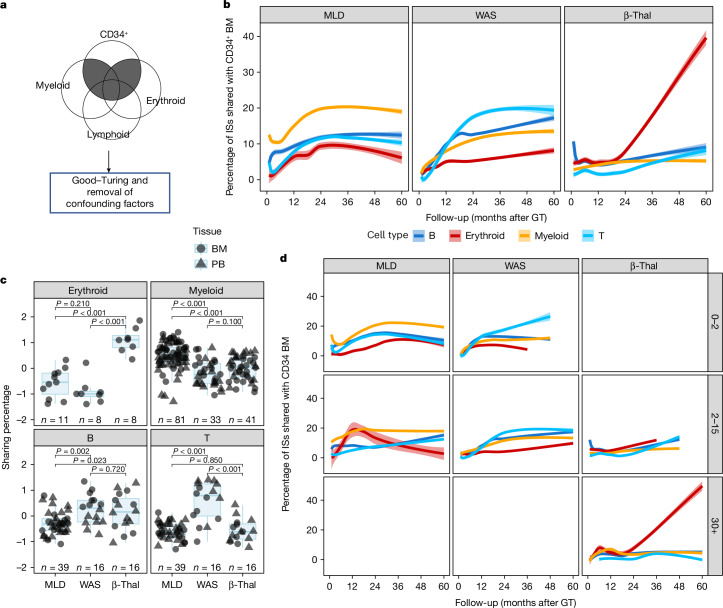
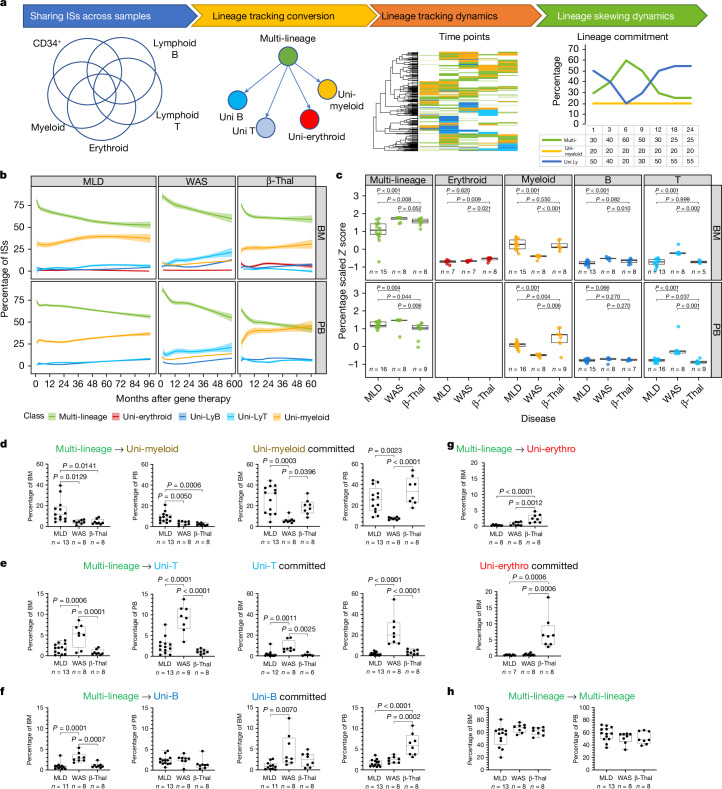
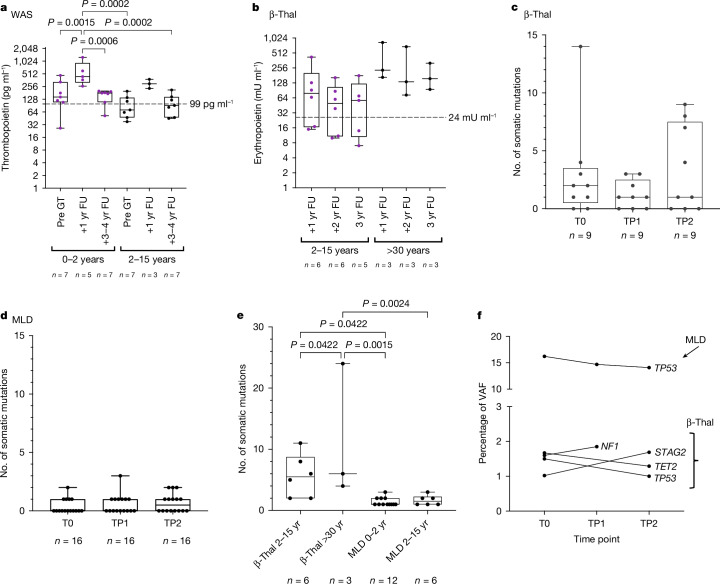
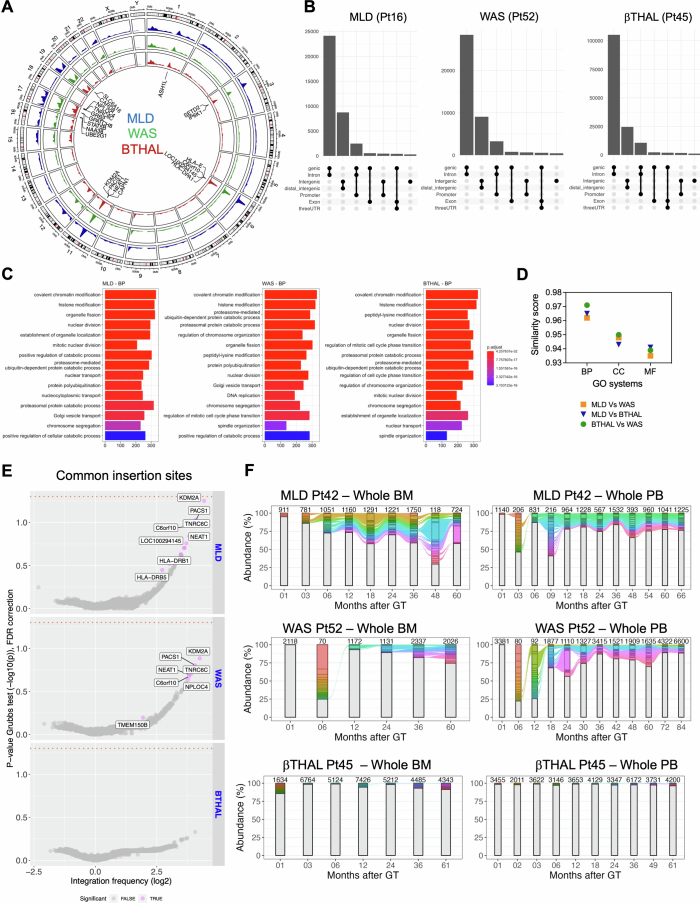
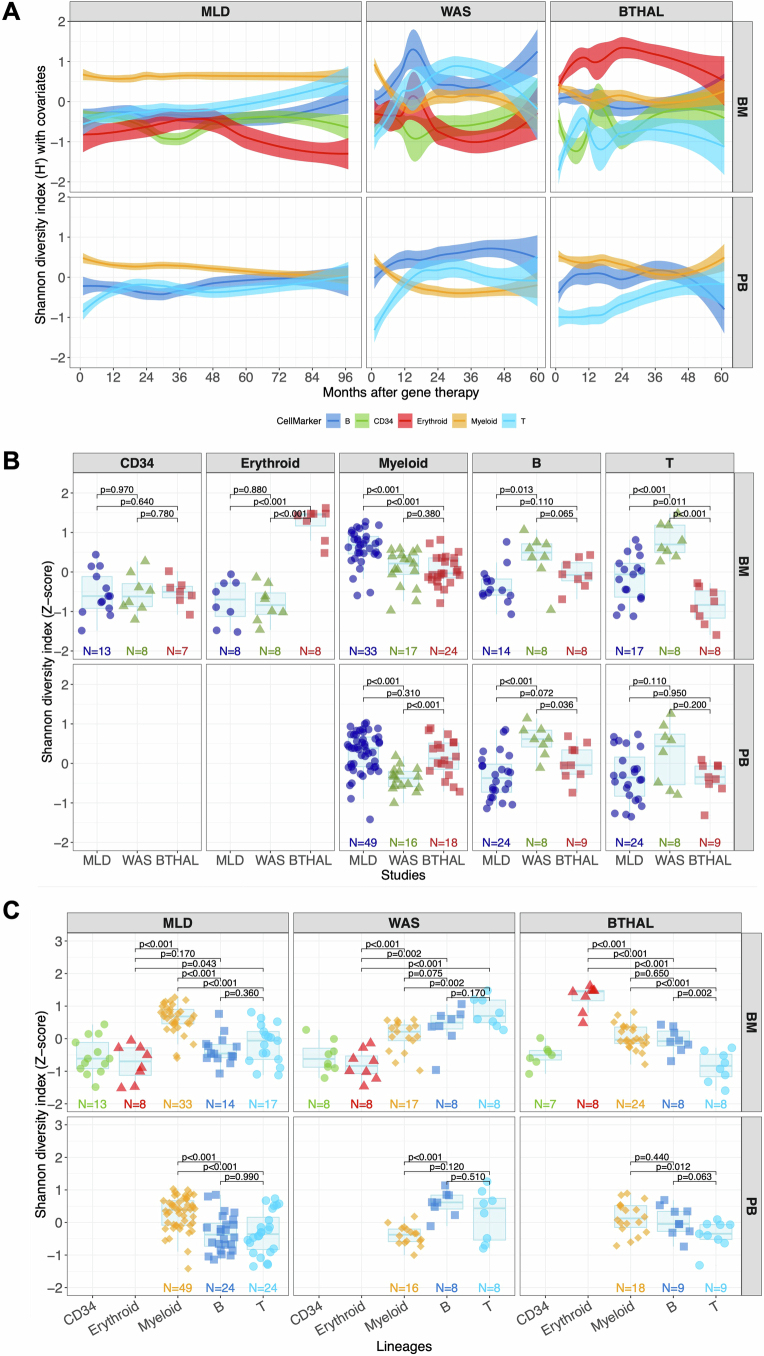
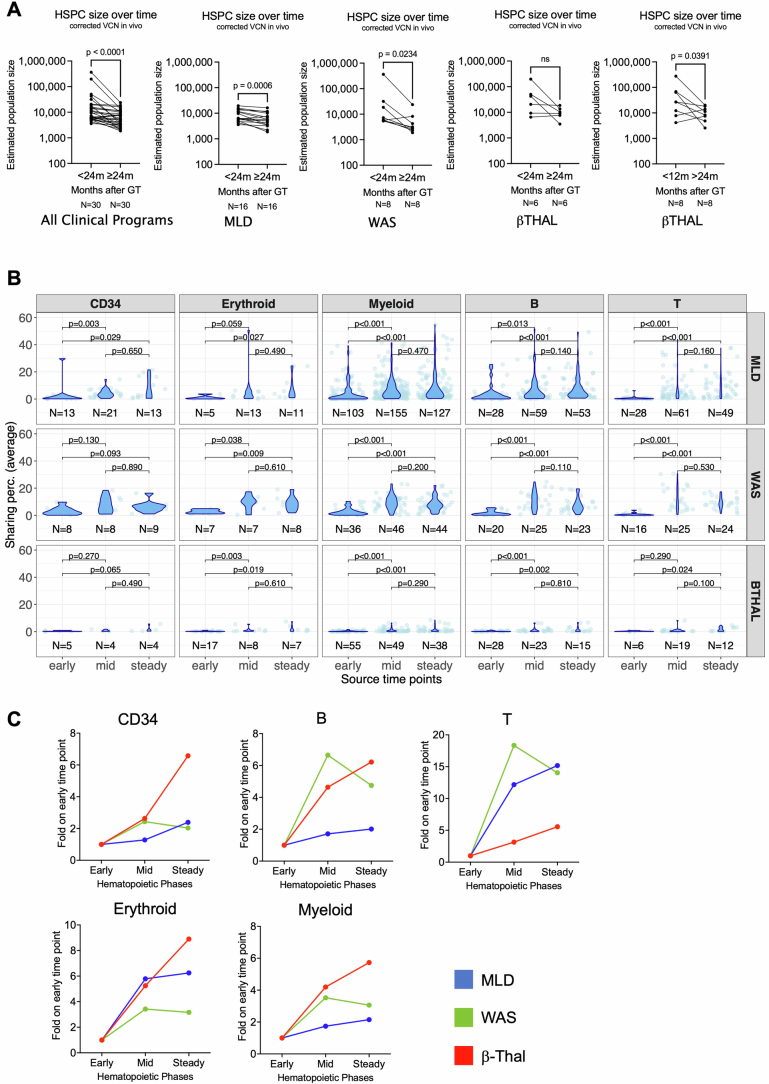
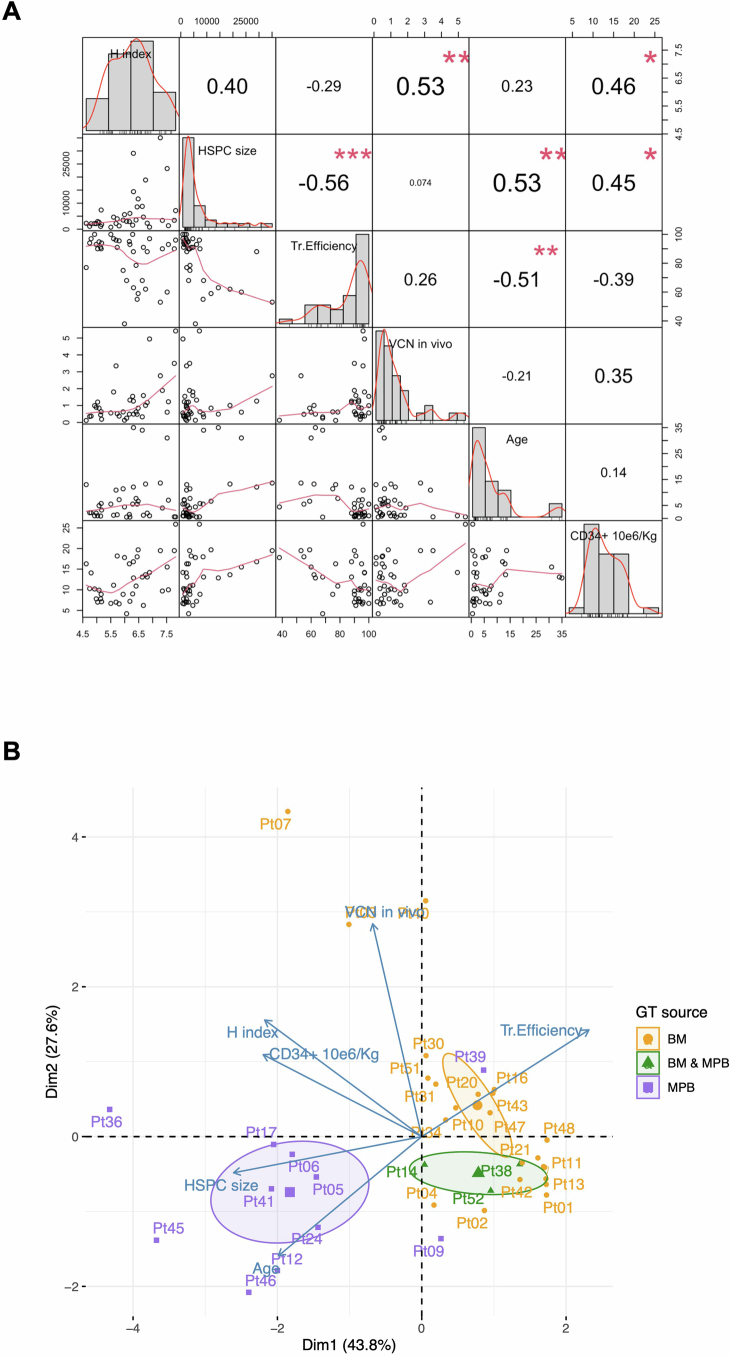
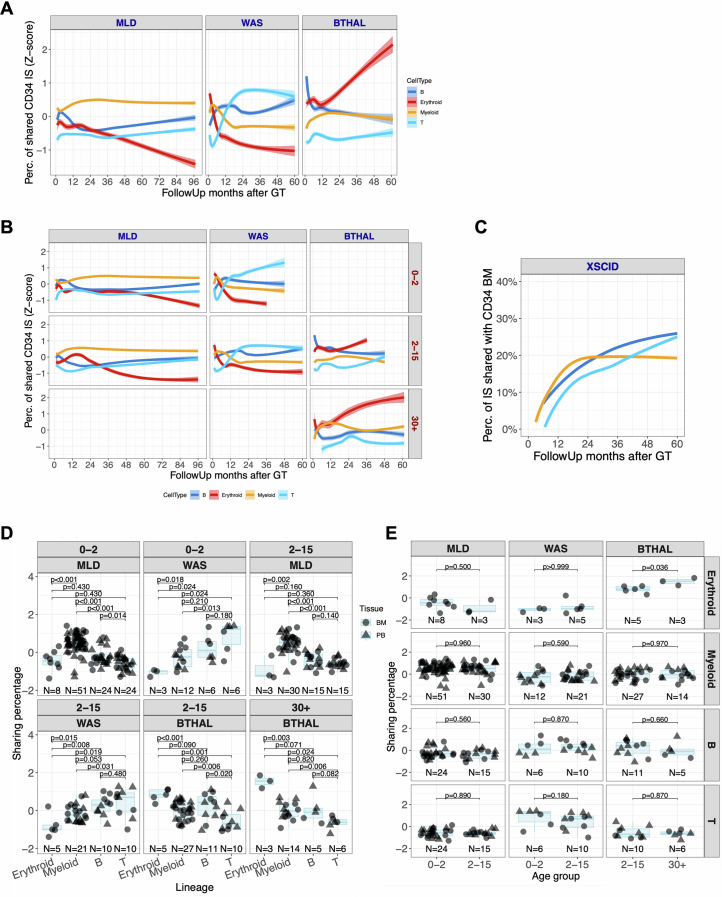
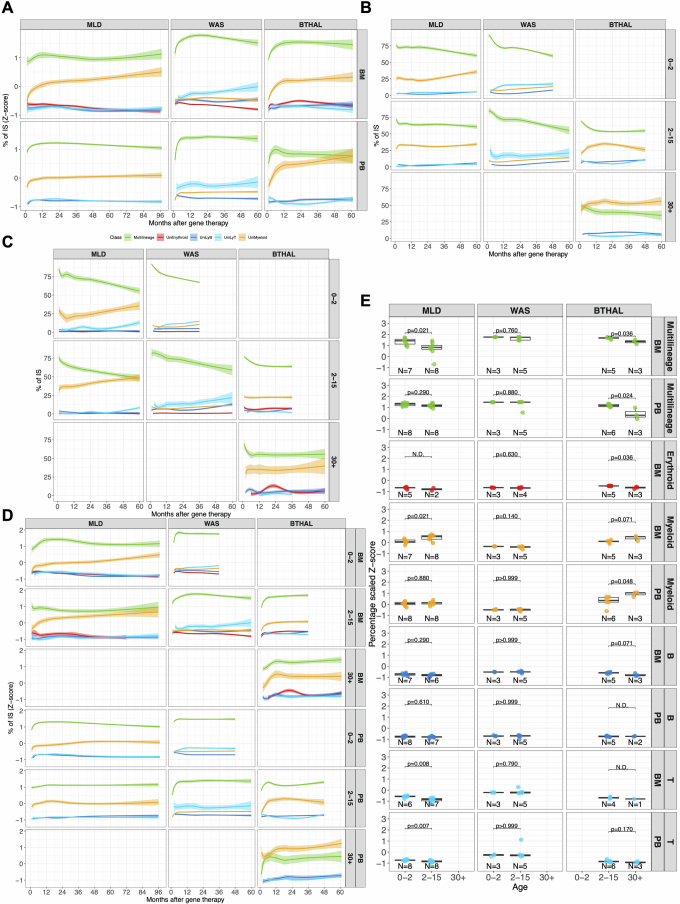
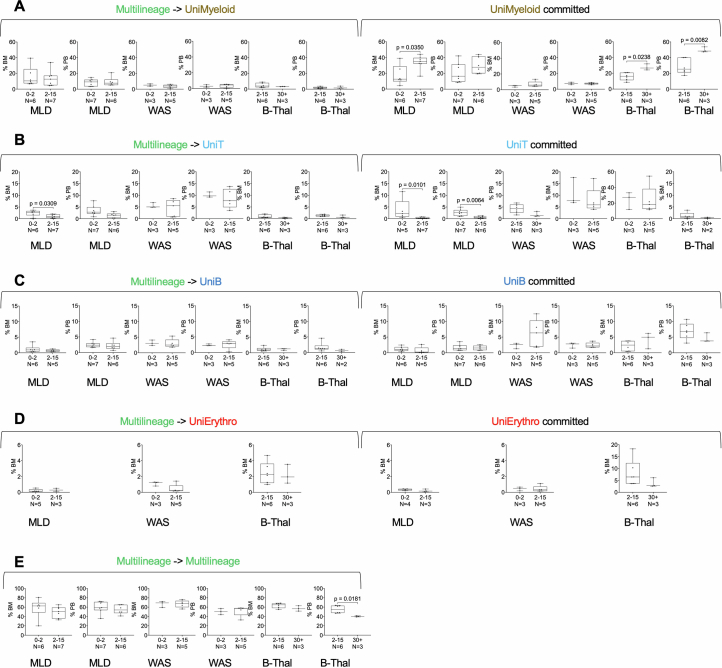
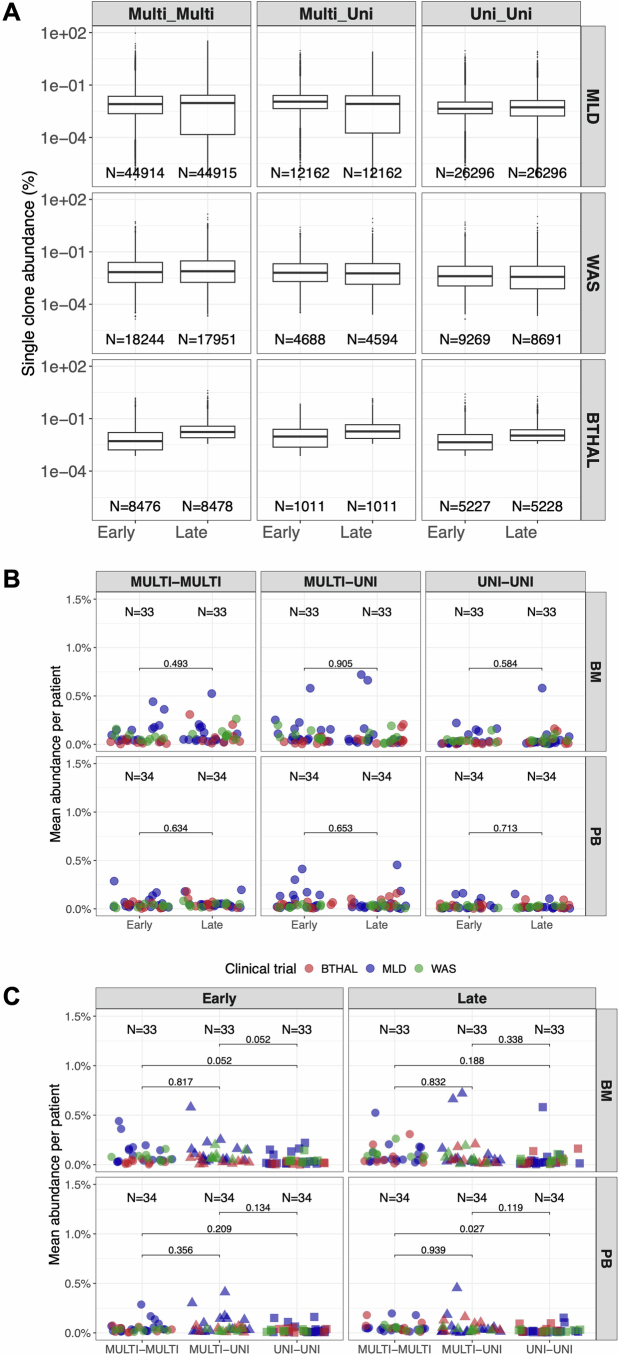
Haematopoietic stem cell (HSC) gene therapy (GT) may provide lifelong reconstitution of the haematopoietic system with gene-corrected cells1. However, the effects of underlying genetic diseases, replication stress and ageing on haematopoietic reconstitution and lineage specification remain unclear. In this study, we analysed haematopoietic reconstitution in 53 patients treated with lentiviral-HSC-GT for diverse conditions such as metachromatic leukodystrophy2,3 (MLD), Wiskott-Aldrich syndrome4,5 (WAS) and β-thalassaemia6 (β-Thal) over a follow-up period of up to 8 years, using vector integration sites as markers of clonal identity. We found that long-term haematopoietic reconstitution was supported by 770 to 35,000 active HSCs. Whereas 50% of transplanted clones demonstrated multi-lineage potential across all conditions, the remaining clones showed a disease-specific preferential lineage output and long-term commitment: myeloid for MLD, lymphoid for WAS and erythroid for β-Thal, particularly in adult patients. Our results indicate that HSC clonogenic activity, lineage output, long-term lineage commitment and rates of somatic mutations are influenced by the underlying disease, patient age at the time of therapy, the extent of genetic defect correction and the haematopoietic stress imposed by the inherited disease. This suggests that HSCs adapt to the pathological condition during haematopoietic reconstitution.


Conflict of interest statement

Competing interests: The San Raffaele Telethon Institute for GT (SR-Tiget) is a joint venture between the Telethon Foundation and Ospedale San Raffaele. Lentiviral vector-based gene therapy for metachromatic leukodystrophy (MLD), developed at SR-Tiget, was licensed to Orchard Therapeutics in 2018. Lentiviral vector-based gene therapy for Wiskott–Aldrich (WAS) syndrome was developed by Fondazione Telethon. Lentiviral vector-based gene therapy for β-thalassemia was developed at SR-Tiget. Gene therapy for MLD is approved in the EU (Libmeldy) and in the US (Lenmeldy). A.A. was the principal investigator of the pilot and pivotal SR-Tiget clinical trial of GT for MLD, WAS and β-Thal. The other authors declare no competing interests.

Figures

Fig. 1
Fig. 1. HSPC clonal complexity, size and source time point of long-lasting clones.
a, Clonal tracking through ISs begins with a patient’s autologous transplantation of vector-marked cells. Periodic sampling and DNA processing isolate markers for distinct lineages (myeloid, erythroid, B and T cells). ISs are retrieved by means of custom PCRs and deep sequencing, allowing clonal population diversity, abundance, lineage tracking and vector integration frequency to be assessed for treatment safety and efficacy. b, The cumulative number of ISs retrieved for each patient by disease (MLD, WAS and β-Thal) increases over time after gene therapy, with a log-based regression curve showing the progression (confidence interval (CI) 0.75). c, Clonal population diversity index (Shannon index, y axis) by clinical trial, tissue (BM and PB) and lineage (different colours), over time (months, x axis); spline CI 0.75. d, The analytical process of HSPC estimate, starting from ISs derived by short-lived myeloid cells in PB, filtering ISs by low sequencing reads (removing ISs with n < 3), and estimating HSPCs over time by triplets of consecutive time points using the Chao1 model. e, Results of estimated HSPCs (y axis) over time (x axis) for each clinical trial, normalized by in vivo VCN for samples with VCN > 1. f, Percentage of the estimated active HSPCs on the total number of infused CD34+ BM cells, stratified by clinical trial; statistical results obtained with Fisher’s exact test. g, Long-term clones are identified by tracking ISs back to their first observed time points, categorized into early (1–6 months), mid (12–18 months) and steady (24–30 months) phases. Statistical comparisons were made using the Kruskal–Wallis test corrected by FDR. h, Percentage of long-lasting clones, for each lineage (in colours) and clinical study, backtracked by the first observed time point grouped by the haematopoietic reconstitution phase (early, mid and steady). RBC, red blood cell; MK, megakaryocyte; NK, natural killer cell; DCs, dendritic cells; Mφ, macrophage. Graphics in a were created using BioRender (https://biorender.com). Source Data
Fig. 2
Fig. 2. Lineage output of CD34+ cells.
a, Strategy for the analysis of CD34+ cells and lineage output: for each time point, we computed the proportion of the shared ISs retrieved for each lineage (among myeloid, erythroid, B and T cells) and CD34+ ISs (sharing ratio). b, Dynamics of the sharing ratio (y axis) as lineage output (with different colours) of CD34+ cells over time (x axis) for the three clinical trials. Spline curves with CI 0.75. c, Box plots of sharing ratio (bar indicates median, whisker 25–75 percentiles), normalized by Z-score (y axis) isolated in all patients from 24 months and averaged, in BM and PB tissues (circle or triangular dot shapes), grouping cell markers (colours) by cell lineages. Statistical tests are performed between pairs of clinical studies (Kruskal–Wallis test). The bars represent the median, the whiskers extend to 1.5 times the interquartile range (IQR) and the P value threshold is set at 0.05. d, Similar to b, CD34+ BM lineage output over time stratified by age groups (0–2, 2–15 and older than 30 years old). Source Data
Fig. 3
Fig. 3. HSC lineage commitment.
a, The workflow for analysing HSC commitment involved computing IS sharing among myeloid, erythroid, B and T cell markers at each time point. Shared ISs were categorized as multi-lineage (if found in several lineages, ‘Multi’) or uni-lineage (if found in one lineage, ‘Uni-myeloid’ for uni-lineage myeloid and ‘Uni-LyT’ or ‘Uni-LyB’ for uni-lineage lymphoid B or T cell, respectively). We then calculated the percentage of each lineage and analysed the profiles over time. b, HSC lineage commitment was tracked for different diseases and tissues, showing the relative percentage of shared ISs over time for multi-lineage and mature uni-lineage clones, using spline regression with a 0.75 CI. c,The box plot compares normalized HSC lineage commitment (Z-score) across clinical trials, tissues and lineages, with statistical significance indicated by Kruskal–Wallis test P values. The bars represent the median, the whiskers extend to 1.5 times the IQR, and the P value threshold is set at 0.05. dg, Box plots represent lineage commitment (myeloid (d), T cell (e), B cell (f), erythroid (g)) during early and late phases of haematopoietic reconstitution in BM and PB, focusing on multi-lineage clones transitioning to uni-lineage and those remaining committed. Statistical comparisons used one-way analysis of variance (ANOVA). The central line represents the median, and the whiskers indicate the range, showing the minimum and maximum values. h, Box plots for multi-lineage clones remaining multi-lineage in BM and PB, with statistical analysis as above. The bar represents the median and the whiskers the range. Source Data
Fig. 4
Fig. 4. TPO and EPO concentrations in patients with WAS and β-Thal, and somatic mutations in patients with MLD and β-Thal.
a, TPO concentration s in patients with WAS before GT (Pre-GT), at 1 year follow-up (1 yr FU) and 3–4 years post-GT (3–4 yr FU), stratified by age at treatment: 0–2 years (0–2 yr) and 2–15 years (2–15 yr). b, EPO concentrations in patients with β-Thal at 1 year (1 yr FU), 2 year (2 yr FU) and 3 year (3 yr FU) follow-ups, stratified by age at treatment: 2–15 years (2–15 yr) and more than 30 years (>30 yr). One-way ANOVA. c,d, Somatic mutations in patients with β-Thal (n = 9) (c) and MLD (n = 16) (d) over time (T0, before infusion; TP1, 2 years posttransplant; TP2, max 5–7 years posttransplant). No significant differences by Friedman’s test. e, Comparison of somatic mutation frequencies between patients with β-Thal and MLD by age group. One-way ANOVA. f, Percentage of VAF over time for somatic mutations found in several time points in patients with MLD and β-Thal, with mutated genes and clinical programmes indicated. In all box plots, the central line represents the median and the whiskers indicate the range, showing the minimum and maximum values. Source Data
Extended Data Fig. 1
Extended Data Fig. 1. Genome wide distribution of IS.
(A) Circular representation of the genomic distribution of the ISs for the three clinical trials (MLD in the blue track, WAS in the green track, β-Thal in the red track). (B) UpSet plot displaying IS distribution around targeted genes for a sample patient in each trial (Pt16 for MLD, Pt52 for WAS, Pt45 for β-Thal). The rows list gene features, with combinations represented by connecting lines and histograms showing element counts. (C) Gene ontology analysis for the three trials, showing the results for biological processes (BP), first 15 classes. (D) GO similarity plot comparing ontological enrichments among the trials. Pairwise similarity scores (“MLD-WAS,” “MLD-β-Thal,” “WAS-β-Thal”) are presented on the y-axis, covering all GO categories cellular components (CC), biological processes (BP), and molecular functions (MF). (E) CIS results displayed as volcano plots for each trial. Each gene is represented as a dot, with integration frequency on the x-axis (log2 scale) and the associated p-value on the y-axis (−log10). The orange dashed line indicates the alpha value of 0.05. Genes are colored gray if never significant or violet if significant in at least one patient. (F) Stacked bar plot tracking top clones (≥ 1% in MLD/WAS, ≥0.1% in β-Thal) over time for the first patient in each trial (MLD Pt42, WAS Pt52, β-Thal Pt45). Each colored bar represents a clone, with height proportional to abundance. Colored ribbons connect neighboring time points for recaptured clones. BM-derived clones are on the left, PB-derived IS on the right, with the number of observed IS reported above each bar. Source Data
Extended Data Fig. 2
Extended Data Fig. 2. Clonal complexity and diversity.
(A) Population diversity index (Shannon entropy, H) over time, normalized with Z-score by patient and time point, divided by disease condition and tissue. Colors refer to lineages (CD34+ cells, myeloid, erythroid, B and T); spline with CI 0.75. (B) Statistical comparisons of population diversity index among the different diseases grouping values by lineages and tissues (Kruskal–Wallis test). The bars represent the median, the whiskers extend to 1.5 times the IQR, and the p-value threshold is set at 0.05. (C) Similar to (B), statistical comparisons of the population diversity index among the different lineages, grouping values by disease and tissues. Source Data
Extended Data Fig. 3
Extended Data Fig. 3. HSPC population size.
(A) Estimated number of HSPCs (y-axis) by disease comparing early time points (<24 months post GT) and late time points (>24 months post GT) using Wilcoxon matched pairs signed rank test. β-Thal patients showed not statistically significant decrease when comparing <24 Vs. >24 months, while showed a significant decrease when comparing <12 Vs. >24 months. (B) Statistical analysis of the composition of long-lasting clones analyzed by the time of origin (first observed time point). For each lineage (in columns) and clinical trial (in rows), we plot the percentages of shared ISs (in dots, distributions with violin plots) within each time point grouped by the three phases (“early” from 1 to 6 months after GT, “mid” from 12 to 18 months, and “steady” from 24 to 30 months). P-values obtained by Kruskal Wallis test. (C) Percentages of the composition of long-lasting clones analyzed by the time of origin expressed as fold change (y-axis) of the “mid” and “steady” phase on the “early” phase (x-axis) for the three diseases (MLD in blue, WAS in green, β-Thal in red), separated by lineage. Source Data
Extended Data Fig. 4
Extended Data Fig. 4. Integrated and unsupervised analysis of patients’ variables, combining clinical and molecular data.
(A) Pair-wise correlation results among all variables (represented in the diagonal). The distribution of each variable is shown within each box in the diagonal. On the lower triangular below the diagonal, the bivariate scatter plots with a fitted line. On the upper triangular side of the matrix above the diagonal, the value of the correlation plus the significance level (p-values, adjusted Benjamini). (B) PCA analysis with biplot representation showing on the axes the first 2 dimensions explaining >74% of the data; dots are all patients labeled with patient ID; blue arrows are the eigenvectors of the PCA; in colors the three GT types (BM = bone marrow, MPB = mobilized peripheral blood) with centroids of clustering as elliptic shapes. Source Data
Extended Data Fig. 5
Extended Data Fig. 5. CD34+ cell output towards mature lineages.
(A) Dynamics of the lineage output over time (x-axis) calculated with the sharing ratio (y-axis) between CD34+ cells and each lineage (different colors) expressed as percentage normalized with Z-score by patient and time point, reported by clinical study. Spline curves with CI 0.75. (B) Similar to (A), dynamics of the lineage output (y-axis) over time (x-axis) stratified by patient age (0–2 years, 2–15 years, >30 years). (C) Lineage output for XSCID patients (N = 10) under LV-HSPC gene therapy treatment (De Ravin S., et al. Nature Communications 2022). (D) Box-plots of sharing ratio (bar indicates median, whisker 25–75 percentiles), normalized by Z-score (y-axis) isolated in all patients from 24 months and averaged, in BM and PB tissues (circle or triangular dot shapes), grouping cell markers (colors) by cell lineages, and stratified by patient’s age within each clinical trial. Statistical tests are performed comparing the different lineages (Kruskal Wallis test). The bars represent the median, the whiskers extend to 1.5 times the IQR, and the p-value threshold is set at 0.05. (E) Similar to (D), box-plot representation of normalized sharing ratio (y-axis) stratified by lineage within each clinical trial, comparing the different groups of treatment age (Kruskal Wallis test). Source Data
Extended Data Fig. 6
Extended Data Fig. 6. HSC lineage commitment.
(A) Z-score normalization of the HSC lineage commitment over time expressed as percentage on the recaptured clones. The plot represents the scaled relative percentage of the shared IS (y-axis) over time (x-axis) for recurrent clones (IS observed in at least two time points for each patient) on the overall number of cells observed in multilineage (green line) or mature uni-lineages (erythroid in red, myeloid in yellow, B in blue, T in light blue). Lines are spline regression curves using a log curve with 0.75 CI. (B) HSC lineage commitment as the percentage of shared ISs of recurrent clones (y-axis) over time (x-axis) for PB samples stratified by clinical trials (in columns) and patient’s age (in rows the three classes of age: 0–2 years, 2–15 years, and >30 years). Colors are associated with multilineage clones (green line) or mature uni-lineages (erythroid in red, myeloid in yellow, B in blue, T in light blue). (C) HSC lineage commitment in BM, similar to (B). (D) Similar to (A), Z-score normalization of the HSC lineage commitment over time expressed as percentage on the recaptured clones and stratified by age. (E) Boxplot representation of the HSC lineage commitment normalized (Z-score) and averaged to compare the different clinical studies (in columns) for multi-lineage or mature committed lineages and tissues (rows); patients are grouped by their age of treatment (groups “0–2” years, “2–15” years, and “>30” years). Statistical results are expressed with lines between pairs of age groups (Kruskal Wallis test). The bars represent the median, the whiskers extend to 1.5 times the IQR, and the p-value threshold is set at 0.05. Source Data
Extended Data Fig. 7
Extended Data Fig. 7. Unilineage or multilineage commitment.
(A) The first six panels show the percentage of multilineage clones (identified <24 months post-transplant) in BM and PB that transition into unimyeloid clones in the late phase (>24 months). The remaining six panels show the percentage of unimyeloid clones that remain committed in the late phase. Each panel compares lineage commitment across clinical programs by age at treatment: 0–2 years and 2–15 years for MLD and WAS, and 2–15 and >30 years for β-Thal. Statistical comparisons used Student’s T-test. (B-E) Box plots representing T-cell, B-cell, erythroid, and multilineage commitment during early and late hematopoietic reconstitution. Panel order and statistical analysis are consistent with (A). Source Data
Extended Data Fig. 8
Extended Data Fig. 8. Transitioning clones in HSPC commitment.
(A) Boxplot representation of single IS clonal abundances per class (multi-lineage or specific uni-linage) in early time points (<24 months) or late time points (>24 months). In all boxplots, the bars represent the median, the whiskers extend to 1.5 times the IQR. (B) Lineage commitment per clone comparing clonal abundances over time (early versus late, <24 months and >24 months respectively) in BM and PB across the different classes (multi-lineage or uni-lineage) and transitions (multi-multi, multi-uni, or uni-uni). Statistical results are expressed with lines between pairs of age groups (Kruskal Wallis test). Patients in each clinical program are represented with dots and colored in blue, green, or red if enrolled in MLD, WAS, or β-Thal study. (C) Similar to (A), we compared lineage commitment clonal abundances per class (multi-lineage or uni-linage) within early time points (<24 months) or late time points (>24 months). Source Data
Extended Data Fig. 9
Extended Data Fig. 9. Reliability of HSPC commitment through IS analysis.
(A) The bootstrap strategy. At each timepoint (T = 1 and T = 60 in this case), each IS is observed in different lineages (B, T, and Myeloid here), with a specific number of reads. An IS is given a label (Multi-lineage “Multi” or unilineage “UniT”/”My”) based on the lineages and the number of reads observed. During the bootstrap procedure, each IS undergoes read subsampling, which reduces the number of reads and may affect its labeling. For example, due to low observed abundances, IS1 might not be detected in B cells, causing its final label at the last time point to change to “UniMy”. After 10 randomizations, we evaluate each IS by assessing the accuracy of classifications in early and late phases across bootstrap samples. ISs with fluctuating labels, like IS1, will show low accuracy, whereas ISs with consistent results and a 100% label, like IS2 and IS3, will yield more robust classifications. (B) Mean accuracy with standard error of all IS Confidence Intervals (CI), y-axis, across randomizations, by sampling percentage (x-axis), per class (multi-lineage or uni-linage), for each clinical study. The bars represent the median, the whiskers while the whiskers indicate the range showing the minimum and maximum values. Source Data
Extended Data Fig. 10
Extended Data Fig. 10. Singleton clones, exhausting HSPCs, Lineage commitment in XSCID patients.
(A) HSC commitment analysis of ISs observed only at one time point (singletons), representing committed clones that exhaust after GT. Results were stratified by clinical trials and patient age, with trends shown for multilineage and mature committed lineages in BM samples, using log spline curves with a 0.75 CI. (B) HSC lineage commitment over time expressed as percentage on the recaptured clones in XSCID patients. The plot represents the scaled relative percentage of the shared IS (y-axis) over time (x-axis) for recurrent clones (IS observed in at least two time points for each patient) on the overall number of cells observed in multilineage (green line) or mature uni-lineages (erythroid in red, myeloid in yellow, B in blue, T in light blue). Lines are spline regression curves using a log curve with 0.75 CI. Source Data

References

    1. Ferrari, G., Thrasher, A. J. & Aiuti, A. Gene therapy using haematopoietic stem and progenitor cells. Nat. Rev. Genet.22, 216–234 (2021). - PubMed
    1. Biffi, A. et al. Lentiviral hematopoietic stem cell gene therapy benefits metachromatic leukodystrophy. Science341, 1233158–1233158 (2013). - PubMed
    1. Sessa, M. et al. Lentiviral haemopoietic stem-cell gene therapy in early-onset metachromatic leukodystrophy: an ad-hoc analysis of a non-randomised, open-label, phase 1/2 trial. Lancet10.1016/s0140-6736(16)30374-9 (2016). - PubMed
    1. Aiuti, A. et al. Lentiviral hematopoietic stem cell gene therapy in patients with Wiskott-Aldrich syndrome. Science341, 1233151 (2013). - PMC - PubMed
    1. Ferrua, F. et al. Lentiviral haemopoietic stem/progenitor cell gene therapy for treatment of Wiskott-Aldrich syndrome: interim results of a non-randomised, open-label, phase 1/2 clinical study. Lancet Haematol.6, e239–e253 (2019). - PMC - PubMed

MeSH terms