. 2025 Aug:74:121-136.
doi: 10.1016/j.jare.2024.10.015. Epub 2024 Oct 21.

Intra species dissection of phytophthora capsici resistance in black pepper

Affiliations

Intra species dissection of phytophthora capsici resistance in black pepper

Yupeng Hao et al. J Adv Res. 2025 Aug.

Abstract

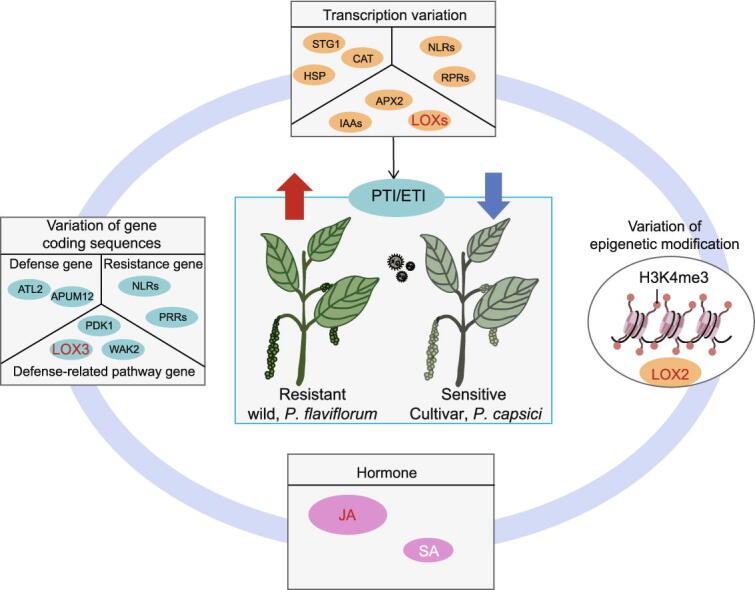
Introduction: Black pepper, a financially significant tropical crop, assumes a pivotal role in global agriculture for the major source of specie flavor. Nonetheless, the growth and productivity of black pepper face severe impediments due to the destructive pathogen Phytophthora capsici, ultimately resulting in black pepper blight. The dissecting for the genetic source of pathogen resistance for black pepper is beneficial for its global production. The genetic sources include the variations on gene coding sequences, transcription capabilities and epigenetic modifications, which exerts hierarchy of influences on plant defense against pathogen. However, the understanding of genetic source of disease resistance in black pepper remains limited.

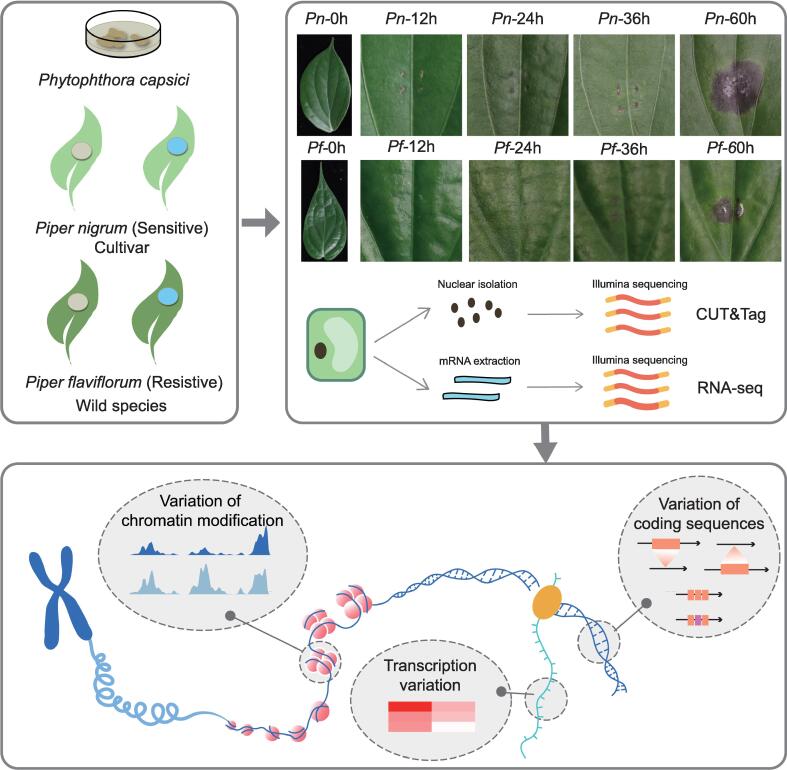
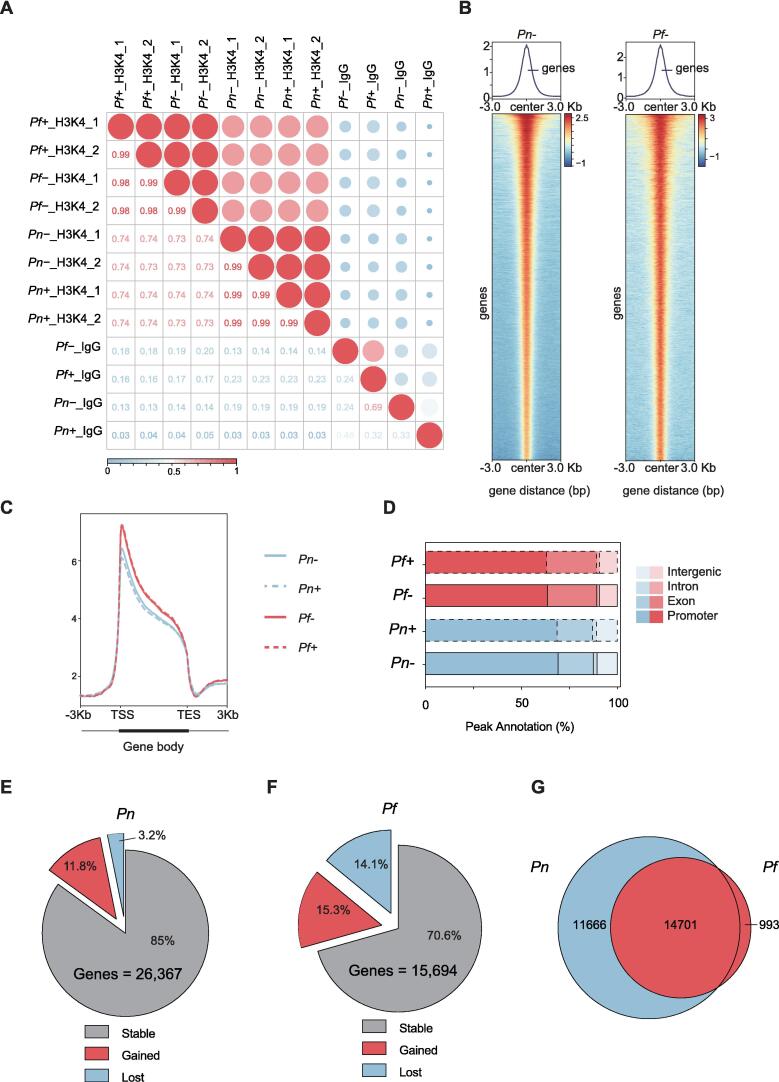
Methods: The wild species Piper flaviflorum (P. flaviflorum, Pf) is known for blight resistance, while the cultivated species P. nigrum is susceptible. To dissecting the genetic sources of pathogen resistance for black pepper, the chromatin modification on H3K4me3 and transcriptome of black pepper species were profiled for genome wide comparative studies, applied with CUT&Tag and RNA sequencing technologies.

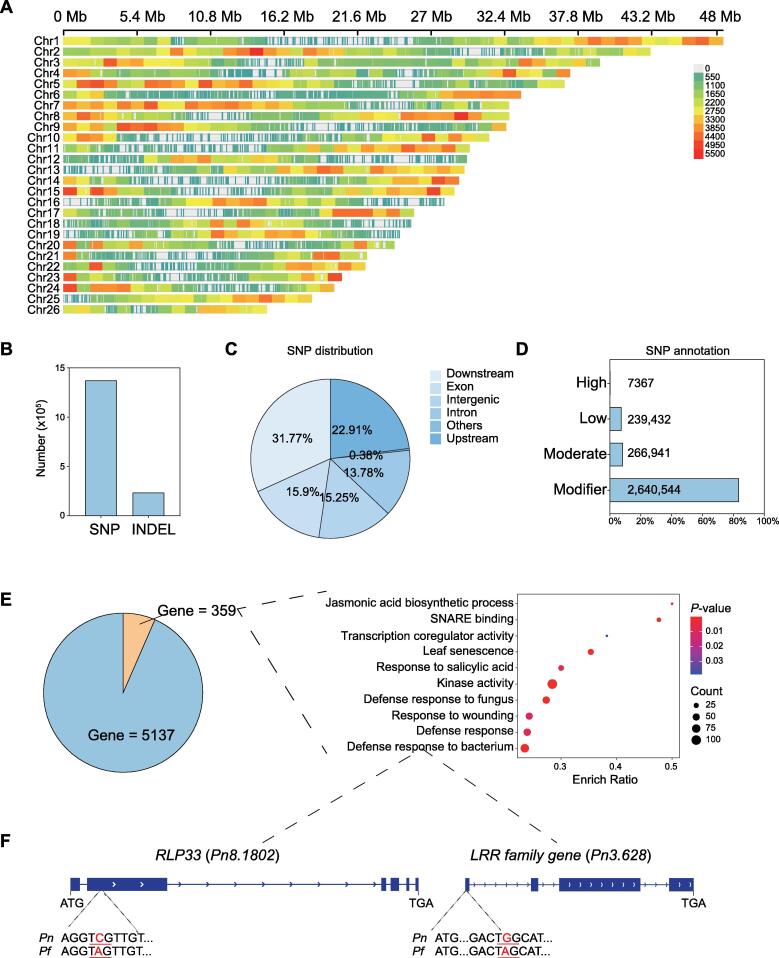
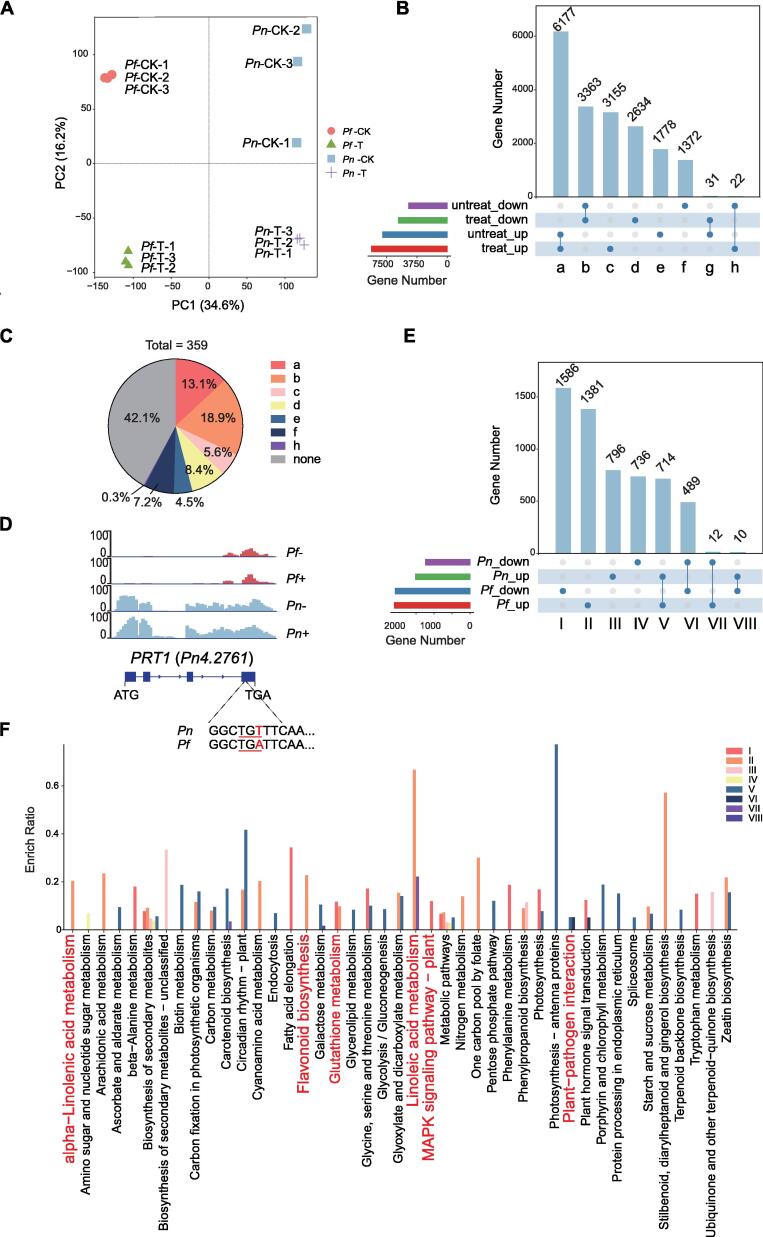
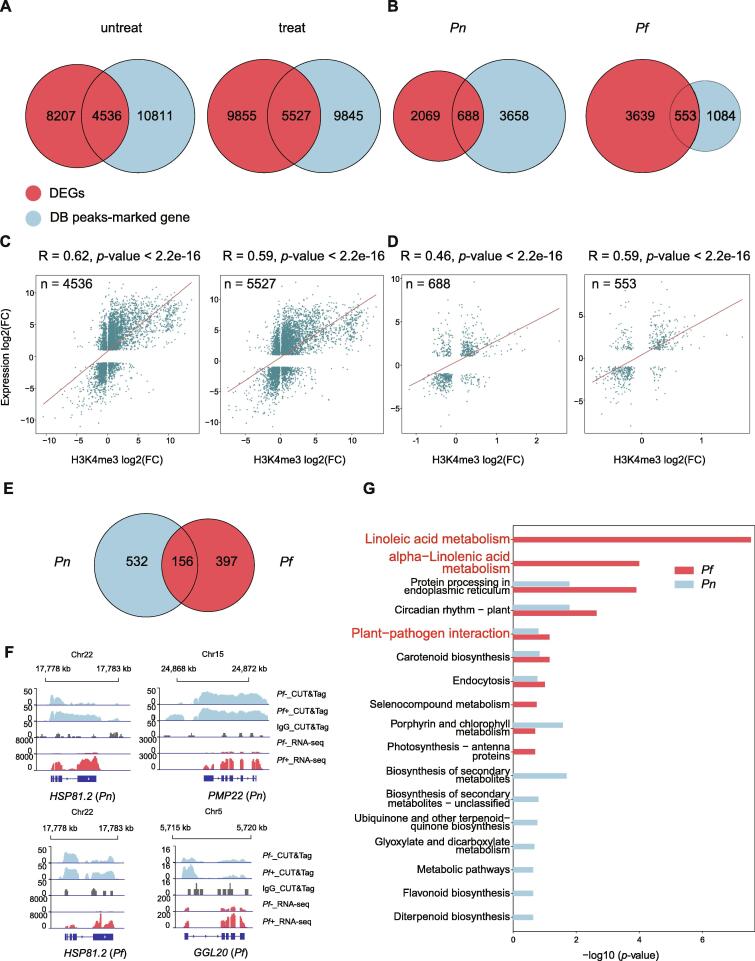
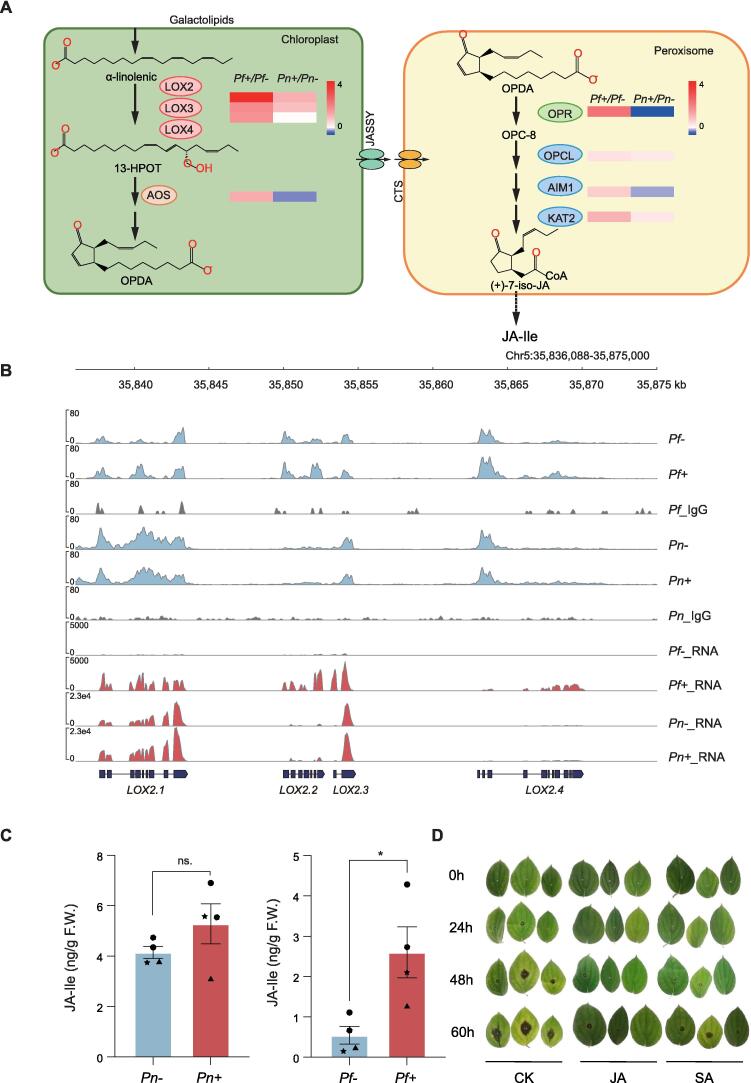
Results: The intraspecies difference between P. flaviflorum and P. nigrum on gene body region led to coding variations on 5137 genes, including 359 gene with biotic stress responses and regulation. P. flaviflorum exhibited a more comprehensive resistance response to Phytophthora capsici in terms of transcriptome features. The pathogen responsive transcribing was significant associated with histone modification mark of H3K4me3 in black pepper. The collective data on variations of sequence, transcription activity and chromatin structure lead to an exclusive jasmonic acid-responsive pathway for disease resistance in P. flaviflorum was revealed. This research provides a comprehensive frame work to identify the fine genetic source for pathogen resistance from wild species of black pepper.

Keywords: Black pepper; CUT&Tag; Disease resistance; Epigenetic; Jasmonic acid; Phytophthora capsici.


Conflict of interest statement

Declaration of competing interest The authors declare that they have no known competing financial interests or personal relationships that could have appeared to influence the work reported in this paper.

Figures

None
Graphical abstract
Fig. 1
Fig. 1
The time point connecting with the transcriptome and histone modification determination of Piper flaviflorum and Piper nigrum. Schematic view of the overall workflow. After 0-h, 12-h, 24-h, 36-h and 60 h inoculation of Phytophthora capsici with the leaves of Pf and Pn, the symptoms were showed by enlarged images and samples 12 h after inoculation were selected according to the phenotypes for RNAseq and CUT&Tag. Pn represents Piper nigrum and Pf represents Piper flaviflorum. 0-h, 12-h, 24-h, 36-h and 60-h represents the time after inoculation.
Fig. 2
Fig. 2
The genomic differences on transcribed region in disease resistance in Piper flaviflorum. A: The distribution of SNPs on chromosomes of Pf. The heatmap shows the density of SNPs. B: The number of SNPs and INDELs of Pf. C: Pie chart of the SNPs distribution by genes’ region. Different color blocks represent different regions. D: SNPs annotation of the effects by impact. HIGH: The variant is assumed to have high (disruptive) impact in the protein, probably causing protein truncation, loss of function or triggering nonsense mediated decay. Moderate:A non-disruptive variant that might change protein effectiveness. Low: Assumed to be mostly harmless or unlikely to change protein behavior. Modifier: Usually non-coding variants or variants affecting non-coding genes, where predictions are difficult or there is no evidence of impact. E: Pie chart and the GO terms of genes related to disease resistance in high-impact level genes. F: The SNP and gene structure of the candidate genes. Pn represents Piper nigrum and Pf represents Piper flaviflorum.
Fig. 3
Fig. 3
Piper flaviflorum orchestrated a comprehensive resistance response in transcriptome features. A: PCA analysis of the RNA-seq data. The different shape represents different groups. B: The Venn diagram of the DEGs in untreat and treat groups. Untreat group represents Pf-CK_VS_Pn-CK and treat group represents Pf-T_VS_Pn-T. Up sign represents the up-regulation of differential expression after infection. Down sign represents the down-regulation of differential expression after infection. C: Pie chart of the high-impact disease resistance-related SNPs causing transcriptional difference. Different colors represent different groups in panel B. D: Example of the high-impact disease resistance-related SNPs causing transcriptional difference. E: The Venn diagram of the DEGs in Pn and Pf. Up sign represents the up-regulation of differential expression after infection. Down sign represents the down-regulation of differential expression after infection. F: The significant KEGG pathway enriched in different group DEGs, the specific pathways were marked in red. The p-value is set to less than 0.05. Different colors represent different groups in panel E. The significate pathway is marked by red. Pn represents Piper nigrum and Pf represents Piper flaviflorum. The CK sign and T sign represent the uninfected and the infected group respectively.
Fig. 4
Fig. 4
The H3K4me3 modification pattern captured by CUT&Tag on Piper flaviflorum and Piper nigrum. A: Heatmap showed the correlation among the CUT&Tag tested group. B: The distribution of H3K4me3 captured DNA signals of Pn and Pf. C: The distribution of H3K4me3 signals on gene body. D: The annotation analysis of the H3K4me3 signals distribution region. E: Pie chart of the H3K4me3 peaks-involved genes’ change in Pn. F: Pie chart of the H3K4me3 peaks-involved genes’ change in Pf. G: Venn diagram of the H3K4me3 peaks-involved genes in Pf and Pn. Pn represents Piper nigrum and Pf represents Piper flaviflorum. The negative sign and positive sign represent the uninfected and the infected group respectively.
Fig. 5
Fig. 5
Transcriptome and histone modification signatures reveal differences in black pepper disease resistance. A: Venn diagram for DEGs and DB peaks-marked genes in untreat group and treat group. The red circle represents DEGs and the blue circle represents DB peaks-marked genes. Untreat group represents Pf-_VS_Pn- and treat group represents Pf+_VS_Pn+. B: Venn diagram for DEGs and DB peaks-marked genes in Pn and Pf. The red circle represents DEGs and the blue circle represents DB peaks-marked genes. C: Scatterplot and correlation between histone modifications and transcriptome in untreat group and treat group, the data is standardized using log2(FoldChange). D: Scatterplot and correlation between histone modifications and transcriptome in Pn and Pf, the data is standardized using log2(FoldChange). E: Venn diagram of genes regulated by both H3K4me3 and transcriptional in two black peppers. F: Representative IGV visualizes genomic region H3K4me3 peak and transcriptome peak. Peak heights in each panel have been standardized to facilitate observation of peak changes. The tracks from top to bottom in each panel represent gene regions, CUT&Tag H3K4me3 peak, CUT&Tag IgG peak, transcriptome gene expression, and gene structure. G: KEGG analysis of two omics intersection genes of Pn and Pf. The significate pathway is marked by red. Pn represents Piper nigrum and Pf represents Piper flaviflorum. The negative sign and positive sign represent the uninfected and the infected group respectively.
Fig. 6
Fig. 6
The jasmonic acid pathway responds to Phytophthora capsici infestation is associated with H3K4me3 modification. A: Flow chart shows the JA biosynthetic pattern pathway. The figure contains important substances and enzymes in the JA biosynthetic pathway. Heatmaps inserted is the expression fold-change patten of the corresponding enzymes. The high-expression foldchange level is marked by red color, and the low expression foldchange level is marked by blue color. B: Representative IGV visualizes genomic region H3K4me3 peak and transcriptome peak. Peak heights in each panel have been standardized to facilitate observation of peak changes. The tracks from top to bottom in each panel represent gene regions, Pf-\Pf + CUT&Tag H3K4me3 peak, Pf CUT&Tag IgG peak, Pn-\Pn + CUT&Tag H3K4me3 peak, Pn CUT&Tag IgG peak, Pf-\Pf+\Pn-\Pn + transcriptome gene expression, and gene structure. LOX2.1, LOX2.2, LOX2.3, LOX2.4 are the tandem duplications of the LOX2. C: The histogram shows the content of the JA-Ile in Pn and Pf. Different inserted shapes represent different independent experiments. Data represent the mean ± SEM of four independent experiments. An asterisk on the bars indicates a significant difference by Student’s t-test. ** p-value < 0.01, * p-value < 0.05. D: The phenotypic identification of exogenous jasmonic acid (JA) and salicylic acid (SA) on fungi-infected Pn leaves. The assessments were conducted at time points of 0 h, 24 h, 48 h, and 60 h post-inoculation (from top to bottom), with control (CK), JA, and SA treatments arranged from left to right. Pn represents Piper nigrum and Pf represents Piper flaviflorum.

Similar articles

References

    1. Butt M.S., Pasha I., Sultan M.T., Randhawa M.A., Saeed F., Ahmed A. Black pepper and health claims: A comprehensive treatise. Crit Rev Food Sci Nutr. 2013;53(9):875–886. - PubMed
    1. Nysanth N.S., Divya S., Nair CB., Anju A.B., Praveena R., Anith K.N. Biological control of foot rot (phytophthora capsici leonian) disease in black pepper (piper nigrum l.) with rhizospheric microorganisms. Rhizosphere. 2022;23:100578.
    1. Lamour K.H., Stam R., Jupe J., Huitema E. The oomycete broad-host-range pathogen phytophthora capsici. Mol Plant Pathol. 2012;13(4):329–337. - PMC - PubMed
    1. Hausbeck M.K., Lamour K.H. Phytophthora capsici on vegetable crops: Research progress and management challenges. Plant Dis. 2004;88(12):1292–1303. - PubMed
    1. Zhao Y., Yang B., Xu H., Wu J., Xu Z., Wang Y. The phytophthora effector avh94 manipulates host jasmonic acid signaling to promote infection. J Integr Plant Biol. 2022;64(11):2199–2210. - PubMed

MeSH terms

LinkOut - more resources