. 2024 Nov 15;436(22):168820.
doi: 10.1016/j.jmb.2024.168820. Epub 2024 Oct 22.

Molecular Phenotypes Segregate Missense Mutations in SLC13A5 Epilepsy

Affiliations

Molecular Phenotypes Segregate Missense Mutations in SLC13A5 Epilepsy

Valeria Jaramillo-Martinez et al. J Mol Biol. .

Abstract

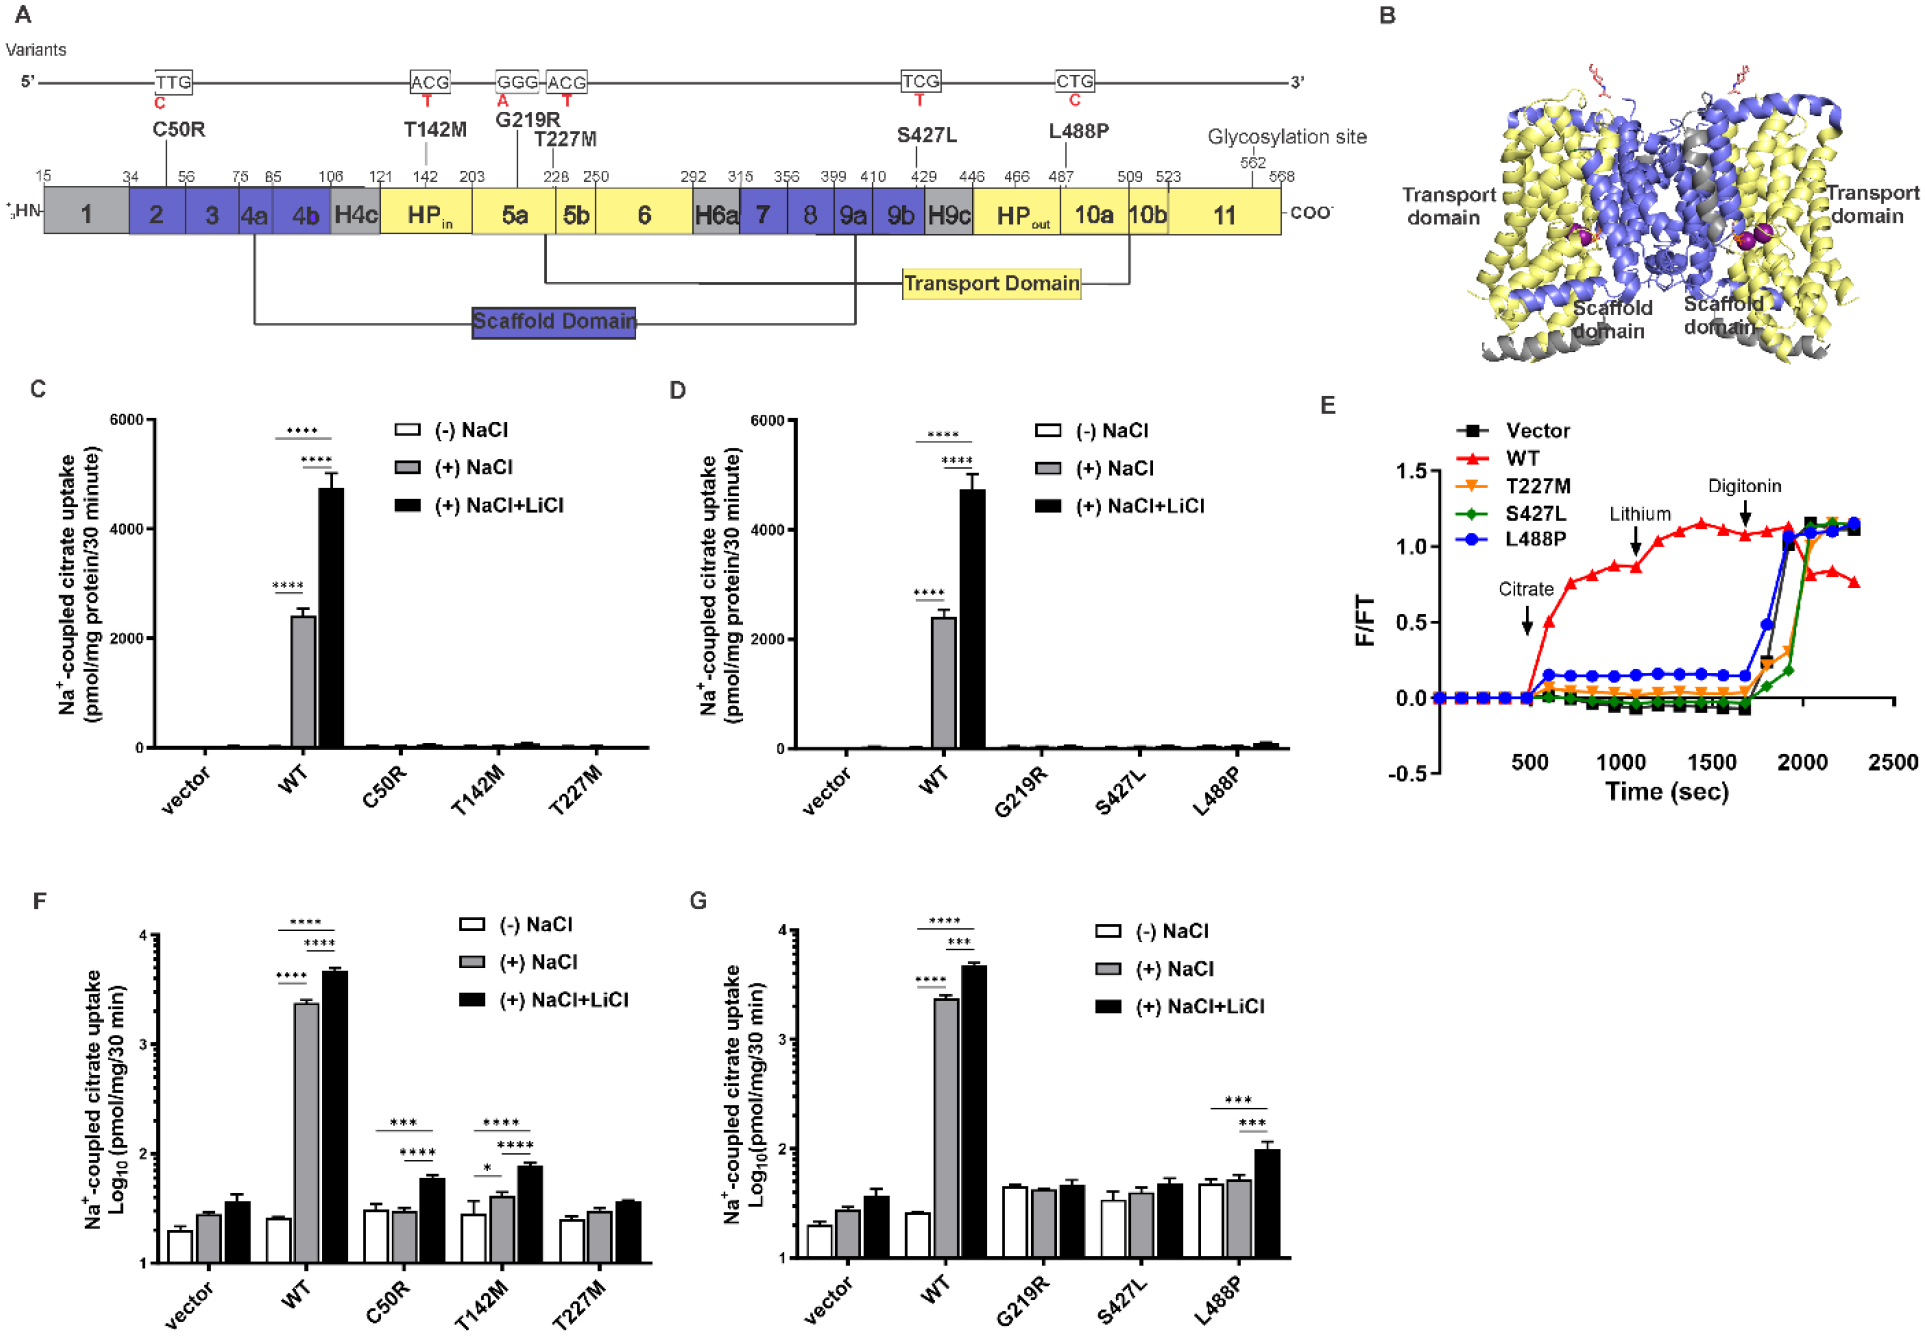
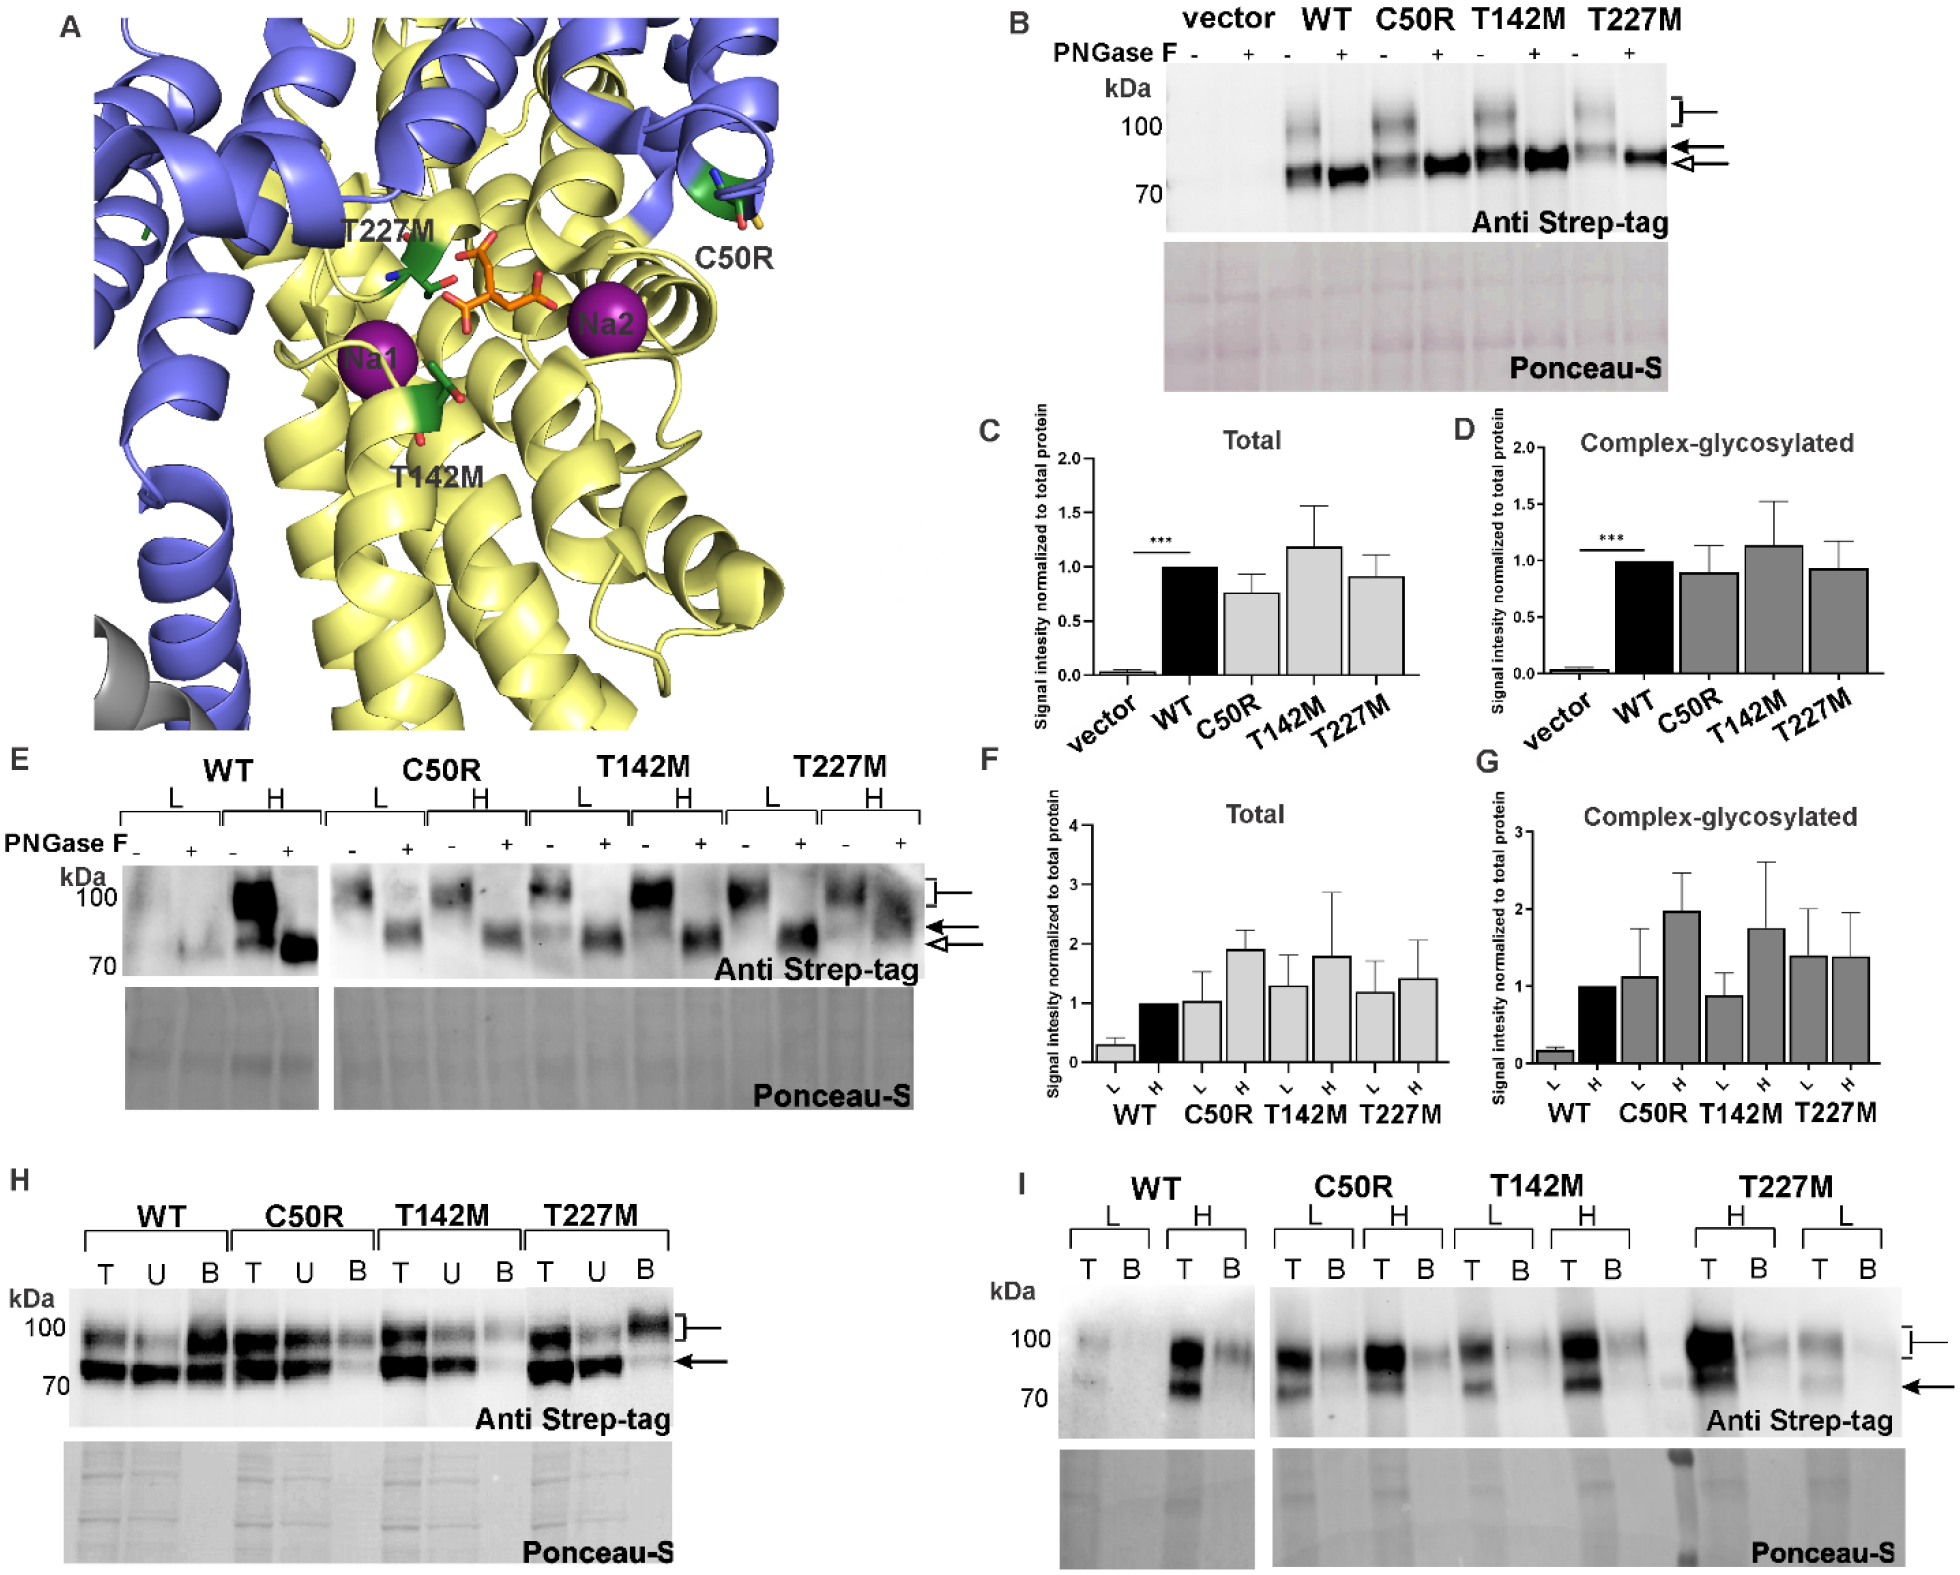
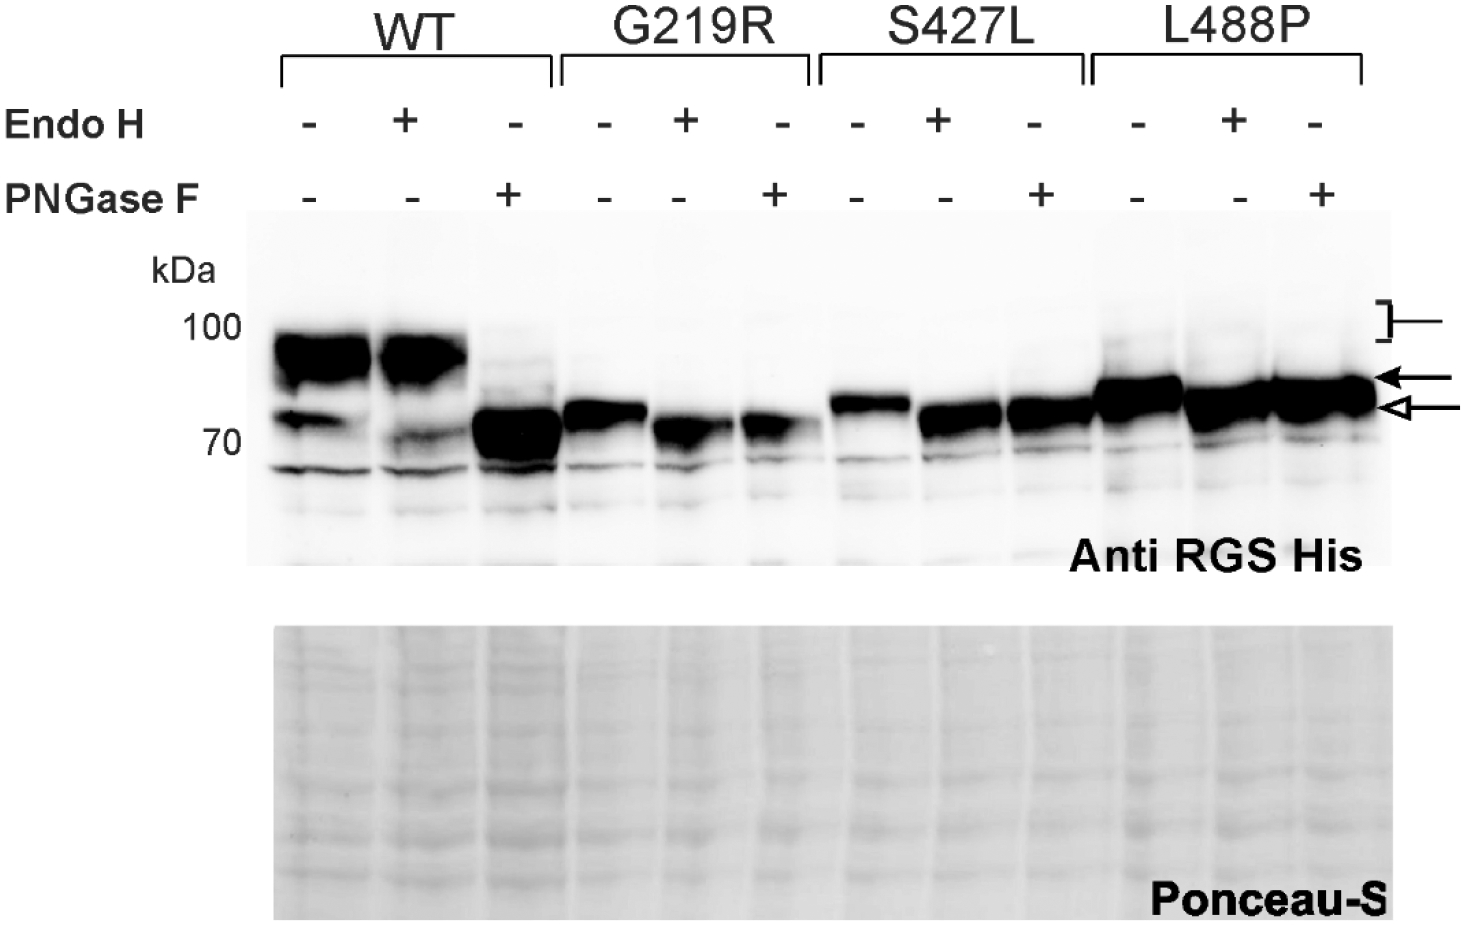
The sodium-coupled citrate transporter (NaCT, SLC13A5) mediates citrate uptake across the plasma membrane via an inward Na+ gradient. Mutations in SLC13A5 cause early infantile epileptic encephalopathy type-25 (EIEE25, SLC13A5 Epilepsy) due to impaired citrate uptake in neurons and astrocytes. Despite clinical identification of disease-causing mutations, underlying mechanisms and cures remain elusive. Here we mechanistically classify six frequent SLC13A5 mutations by phenotyping their protein cell surface expression and citrate transport functions. Mutants C50R, T142M, and T227M exhibit impaired citrate transport despite normal expression at the cell surface. In contrast, mutations G219R, S427L, and L488P show low total protein expression levels, absence of mature, glycosylated proteins at the cell surface, retention of the proteins in the endoplasmic reticulum, and diminished transport activity. This mechanistic classification divides SLC13A5 mutants into two groups, Class I (C50R, T142M, and T227M) and Class II (G219R, S427L, and L488P). Importantly, mutants' mRNA levels resemble wildtype, suggesting post-translational defects. Class II mutations display immature core-glycosylation and shortened half-lives, indicating protein folding defects. Together, these experiments provide a comprehensive understanding of the disease-causing mutation's defects in SLC13A5 Epilepsy at the biochemical and molecular level and shed light into the trafficking pathway(s) of NaCT. The two classes of mutations will require fundamentally different approaches for treatment to either restore transport function of the mutant protein that is capable of reaching the cell surface (Class I), or therapies that enable the correction of protein folding defects to enable escape to the cell surface where it may restore transport function (Class II).

Keywords: NaCT; biogenesis; folding defect; proteasomal degradation; transport defect.


Conflict of interest statement

Declaration of competing interest The authors declare that they have no known competing financial interests or personal relationships that could have appeared to influence the work reported in this paper.

Figures

Figure 1
Figure 1. Differential transport activity of WT and mutant NaCTs.
(A) Location of six most frequent missense mutations in the primary sequence of NaCT with the scaffold domain colored in blue, the transport domain in yellow. Transmembrane helices H4c, H6a, and H9c are bridges the transport domain to the scaffold domain. WT codons are shown above in black with nucleotide substitutions indicated in red. (B) 3D structure of the NaCT dimer (PDB: 7JSK,(Sauer et al., 2021a)); Na+ ions are shown as magenta balls, and citrate is in orange sticks. (C) and (D) Na+-coupled uptake of [14C]-citrate in HEK293 cells transiently transfected with NaCT mutants as described in Methods. (E) Fluorescence time course of citrate uptake in HEK293 cells co-transfected with Citron and either empty vector, WT, or mutant variants. Relative fluorescence changes were measured in NaCl buffer before and after consecutive additions of 10 mM citrate and 10 mM Li+ (arrows), followed by 0.5% digitonin to reveal maximally achievable total fluorescence. (F) and (G) Log-scale of (C) and (D) to reflect the very low activity of mutant variants. Each point represents the mean ± SEM of 3–5 experiments *P ≤ 0.05, **P ≤ 0.01, and ***P ≤ 0.001. In (E) error bars were small and were omitted for clarity.
Figure 2
Figure 2. Glycosylation status and expression profiles of Class I mutants.
(A) Location of C50R, T142M, and T227M in the cryo-EM structure (PDB: 7JSK) (Sauer et al., 2021a), scaffold and transport domains are colored as in Fig. 1. (B) Whole-cell lysates from transiently transfected cells were treated without or with PNGase F, resolved by SDS-PAGE, and Western blots developed with the NaCT-specific anti-Strep-tag antibody. The sizes of non-glycosylated (empty arrow), core-glycosylated (arrow), and complex-glycosylated (brackets) NaCT protein bands are indicated. Quantification of (C) total NaCT Western blot signals and of (D) the complex-glycosylated bands from three independent experiments as decribed in Methods. (E) Western blot analysis of whole-cell lysates from clonal cell lines expressing lower (L) and higher (H) level of NaCT variants. Quantification of (F) total NaCT signals and the (G) complex-glycosylated protein bands. Total proteins loaded per lanes were stained with Ponceau S and used as loading controls. Cell-surface biotinylated proteins expressed in (H) transiently transfected and (I) clonal cells. Total protein lysates (T), unbound proteins (U) that washed off the NeutrAvidin resin, and bound biotinylated NaCT (B) were detected with the NaCT-specific anti-Strep-tag antibody. Each column represents the mean ± SEM, n= 3. *P ≤ 0.05, **P ≤ 0.01, and ***P ≤ 0.001. The relative levels were quantified by Image J, n=3.
Figure 3
Figure 3. Differential transport activity of WT and mutant NaCTs.
Na+-coupled uptake of [14C]-citrate in HEK293 cells stably expressing (A) Class I and (B) Class II mutants was measured in buffer devoid of NaCl (white), with NaCl (grey), or with NaCl together with 10 mM LiCl (black) was assayed as described in Methods. (C) and (D) Log-scale of (A) and (B) to reveal the very low activity of mutant variants..Each column represents the mean ± SEM, n=3–5. *P ≤ 0.05, **P ≤ 0.01, ***P ≤ 0.001 and ****P ≤ 0.0001.
Figure 4
Figure 4. Glycosylation status and expression profiles of Class II mutants.
(A) Location of G217R, S427L, and L488P in the cryo-EM structure (PDB: 7JSK), colored as in Fig. 1. (B) Whole-cell lysates from transient transfections were treated with and without PNGase F as in Fig. 2; note that only 10 μg of WT NaCT was loaded, half as much as mutant cell lysates (20 μg), and resolved by SDS-PAGE and Western blot analysis using the NaCT-specific anti-Strep-tag antibody. Non-glycosylated (empty arrow), core-glycosylated (filled arrow), and complex-glycosylated (brackets) proteins are indicated. (C) Quantification of the total Western blot signal of all NaCT bands and (D) of the complex-glycosylated band from three independent experiments as decribed in Methods. (E) Western blot analysis of whole-cell lysates from clonal cell lines expressing lower (L) and higher (H) level of NaCT variants., and quantification of (F) total NaCT signals and the (G) complex-glycosylated protein bands. (H) Cell-surface biotinylated protein expression in transient transfection and (I) clonal cell lines; labeling is as in Fig. 2. Each column represents the mean ± SEM, n= 3. *P ≤ 0.05, **P ≤ 0.01, and ***P ≤ 0.001 The relative total proteins levels were quantified by Image J, n=3.
Figure 5.
Figure 5.. Core and complex glycosylation of WT and Class II folding mutants.
Glycosylation patterns of mutants were verified by digestion with Endo H vesrsus PNGase F glucosidases. Endo H is selective for core glycans of the high mannose and some hybrid types of N-linked carbohydrates found in ER proteins. In contrast, PNGase F removes almost all types of N-linked glycosylation of the high mannose, hybrid, bi-, tri- and tetra-antennary types. Note that EndoH did not cleave the complex glycans of WT NaCT, however mutants were readily cleaved, indicating immature ER core-glycosylation.
Figure 6
Figure 6. Cellular localization of NaCT folding mutants using multiple cellular markers.
Clonal cell lines selected to stably express WT and mutant proteins at lower levels were co-stained with NaCT-specific anti-RGS(H)4 (red) and an antibody recognizing either (A) the plasma membrane protein marker B-catenin (green), and (B) ER protein marker Calnexin (green). DAPI staining of nuclei was included in blue for reference. (C) and (D) are Pearson’s correlation coefficient between RGSH(4) and markers. Each point represents an independent image, n=10. *P ≤ 0.05, **P ≤ 0.01, ***P ≤ 0.001 and ****P ≤ 0.0001.
Figure 7
Figure 7. Half-lives of Class II mutants are significantly shortened.
(A) Clonal cells were treated with cycloheximide, and the disappearance of the NaCT protein bands monitored for 0, 4, 8, 12, and 24 h by Western blotting. Positions of core-glycosylated (arrow) and complex-glycosylated (brackets) NaCT protein bands are indicated. (B) Quantification of the total NaCT signals from three independent experiments for the calculation of protein half-lives (see Table 2); statistical analyses are described in Methods.
Figure 8
Figure 8. Inhibition of proteasomal and lysosomal degradation pathways for Class II mutants.
Clonal cell lines were treated for 8 h with (A, B) 10 μM MG132 or (C, D) 100 nM bafilomycin A (Baf), and cell lysates analysed by Western blotting. Positions of core-glycosylated (arrow) and complex-glycosylated (brackets) NaCT are indicated. Representative images of 3 experiments are shown, mean ± SEM, n= 3.
Figure 9
Figure 9. Phenotypes of disease-causing NaCT missense mutations.
Based on our experimental analyses, disease-causing missense mutations either (i) interfere with the citrate transport function (Class I) by blocking critical steps in the substrate translocation or (ii) cause defects in protein folding and trafficking (Class II) and lead to premature degradation by the ER quality control machinery. Potential treatment strategies for Class II mutations may include small molecule therapeutics that traverse the cell membrane and reach the ER where they bind to the mutant proteins and ‘correct’ the folding defect and rescue the immature protein, thus promoting it to traffic to the plasma membrane. Potential treatment strategies for Class I mutations may include a different kind of small molecules that may bind to the mutant transporter allosterically and ‘potentiate’ symport of Na+ and citrate into the cytoplasma.

Update of

Similar articles

References

    1. Tong W-H, Rouault TA. Metabolic regulation of citrate and iron by aconitases: role of iron–sulfur cluster biogenesis. Biometals. 2007;20:549–64. - PubMed
    1. Fraenkl SA, Muser J, Groell R, Reinhard G, Orgul S, Flammer J, et al. Plasma citrate levels as a potential biomarker for glaucoma. Journal of ocular pharmacology and therapeutics. 2011;27:577–80. - PubMed
    1. Hamm LL. Renal handling of citrate. Kidney international. 1990;38:728–35. - PubMed
    1. Yodoya E, Wada M, Shimada A, Katsukawa H, Okada N, Yamamoto A, et al. Functional and molecular identification of sodium-coupled dicarboxylate transporters in rat primary cultured cerebrocortical astrocytes and neurons. Journal of neurochemistry. 2006;97:162–73. - PubMed
    1. Bhutia YD, Kopel JJ, Lawrence JJ, Neugebauer V, Ganapathy V. Plasma Membrane Na(+)-Coupled Citrate Transporter (SLC13A5) and Neonatal Epileptic Encephalopathy. Molecules. 2017;22:1–15. - PMC - PubMed

Supplementary concepts