. 2024 Dec 16;31(1):14-31.
doi: 10.1261/rna.080216.124.

RNA fold prediction by Monte Carlo in graph space and the statistical mechanics of tertiary interactions

Affiliations

RNA fold prediction by Monte Carlo in graph space and the statistical mechanics of tertiary interactions

Ethan N H Phan et al. RNA. .

Abstract

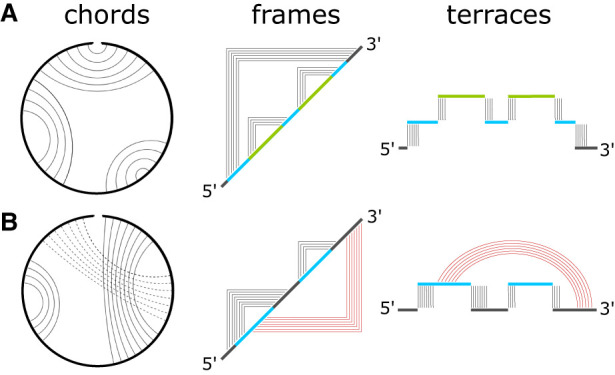
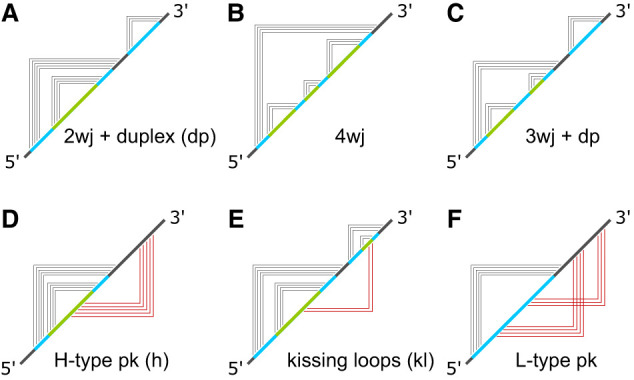
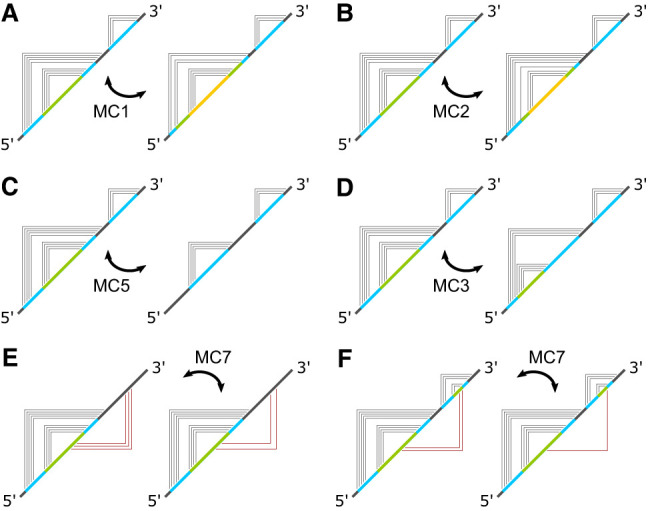
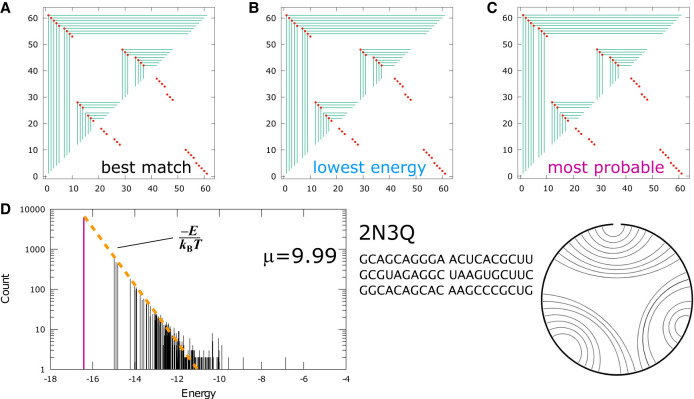
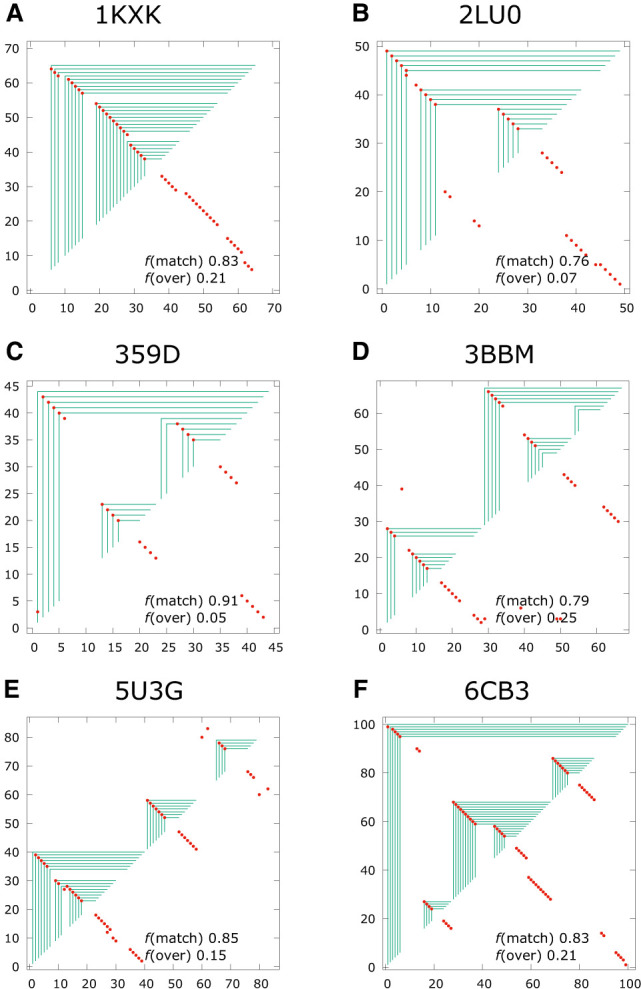
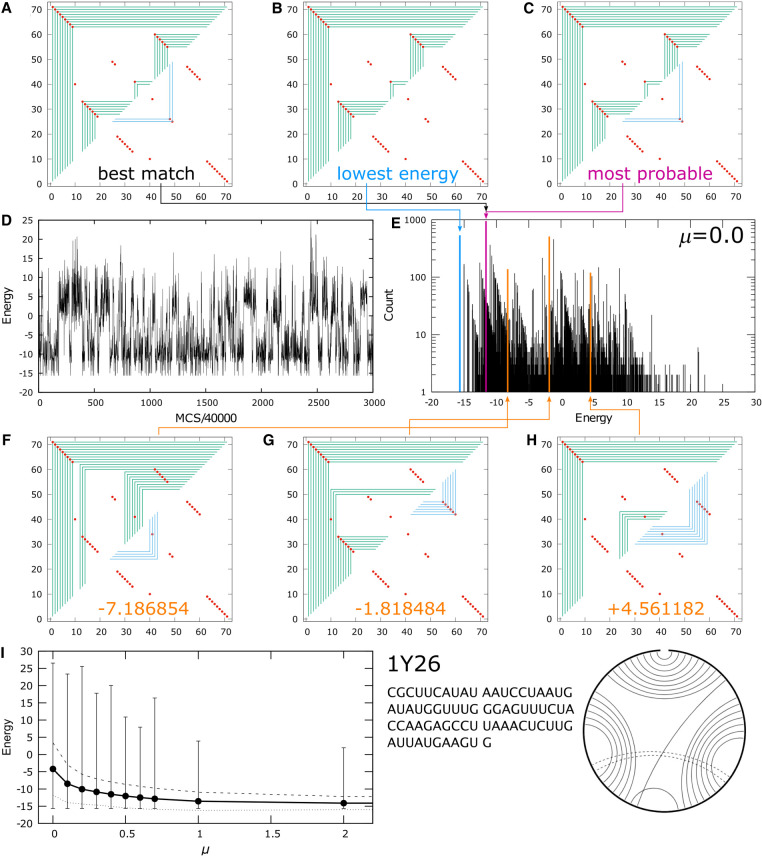
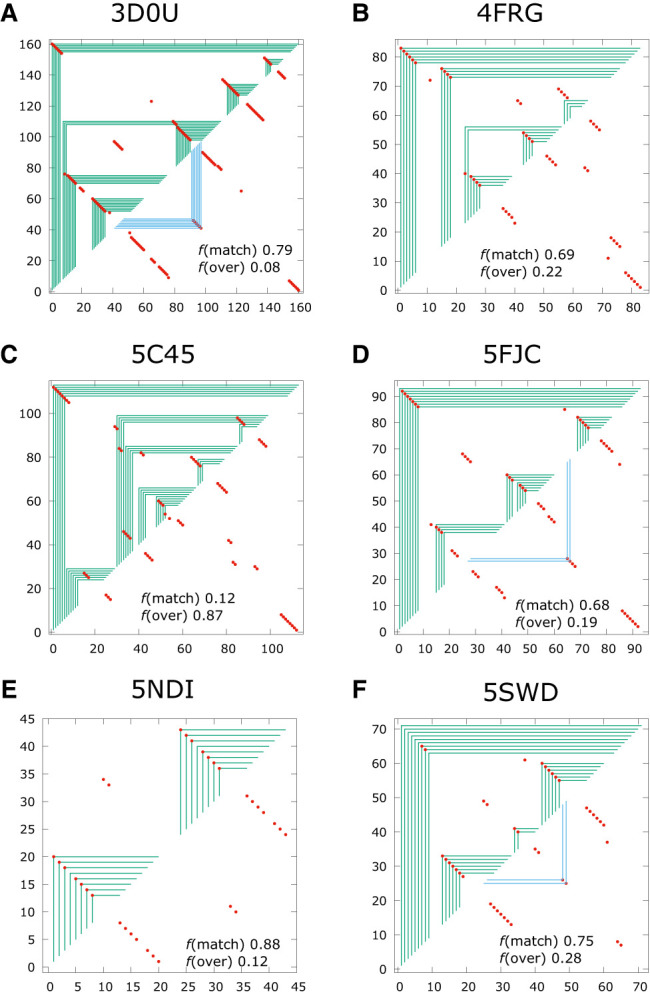
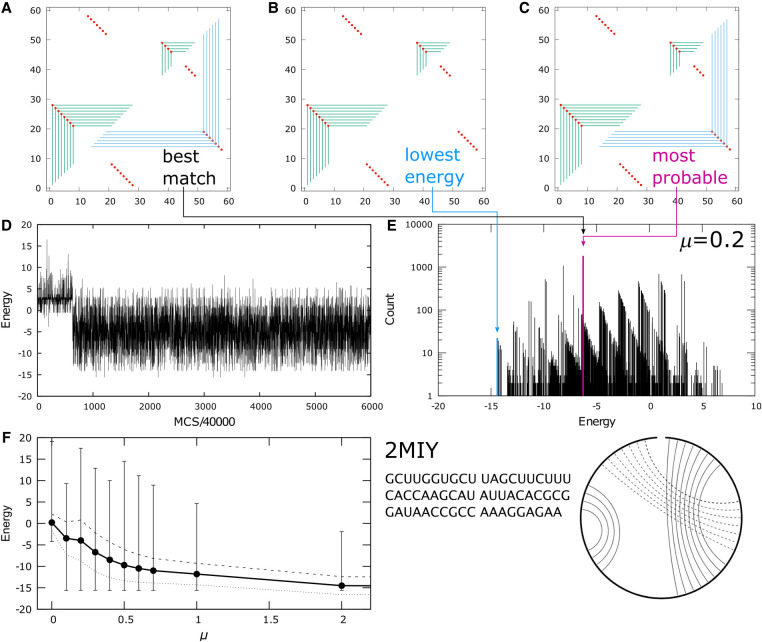
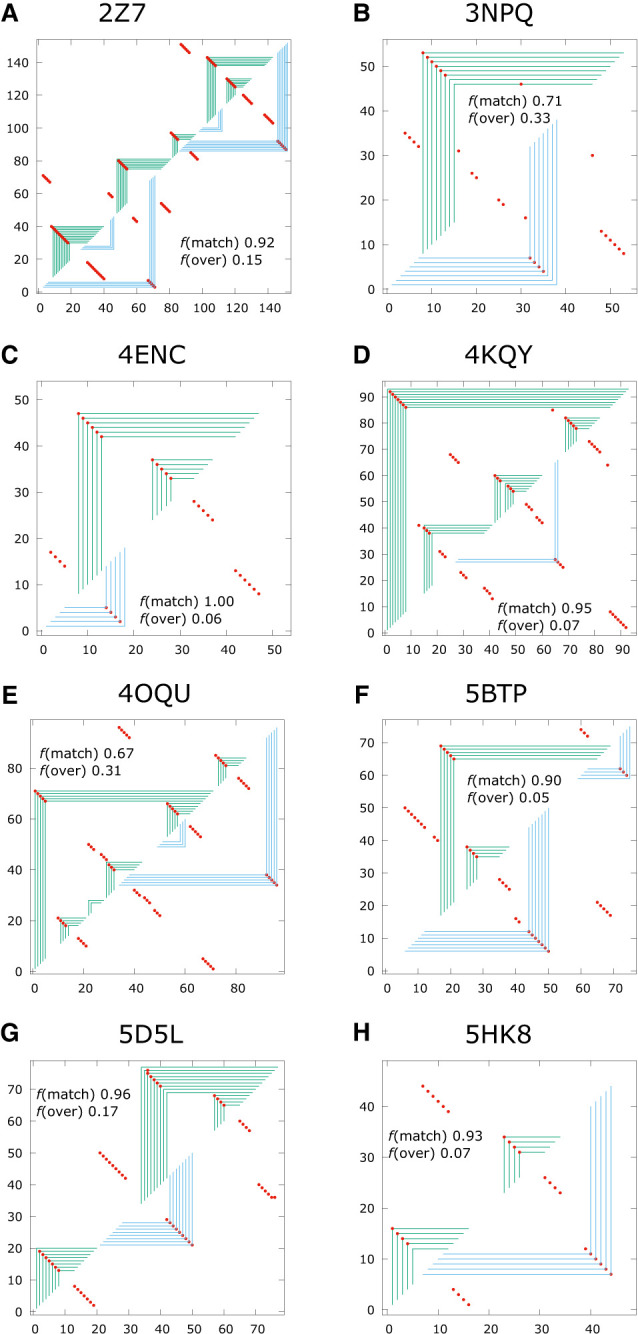
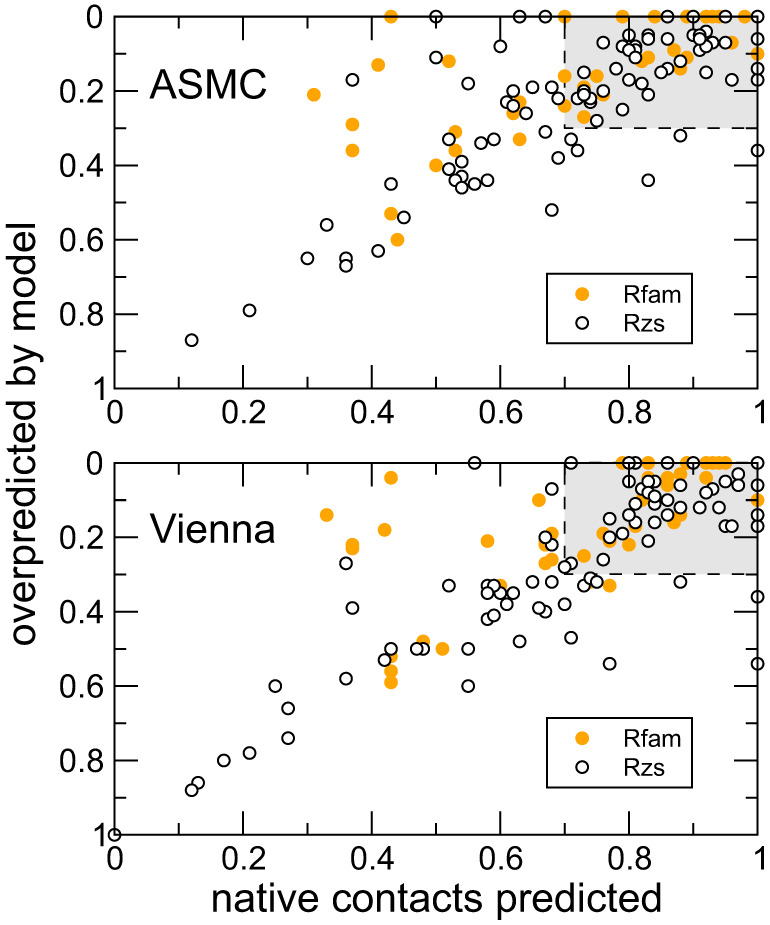
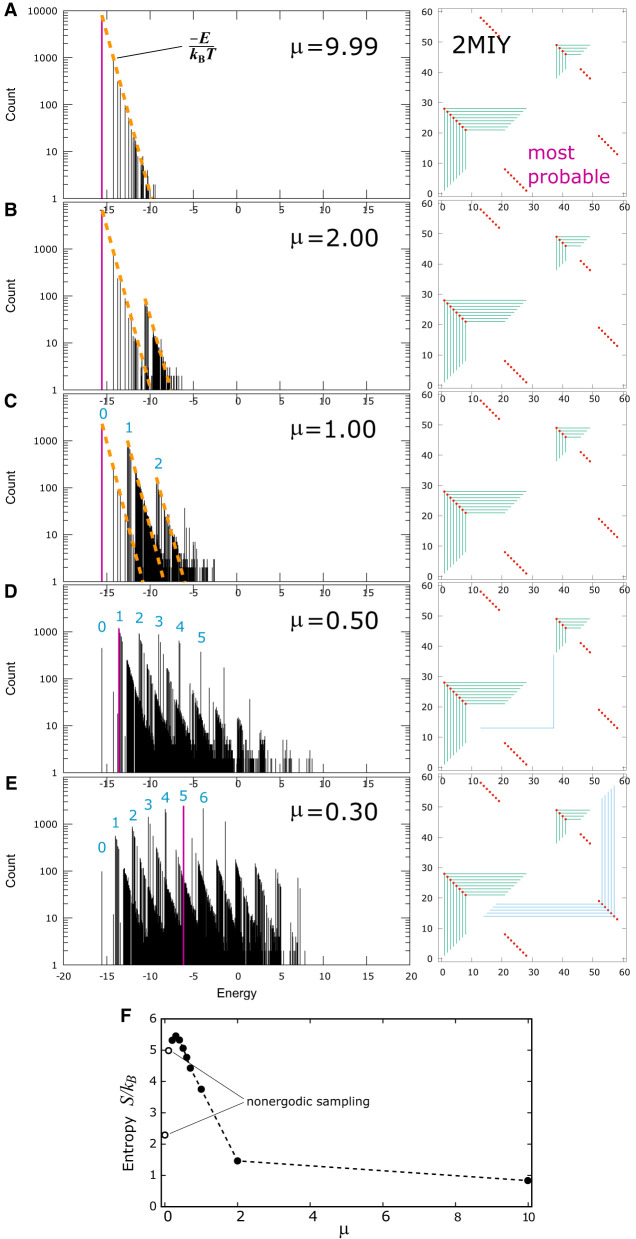
Using a graph representation of RNA structures, we have studied the ensembles of secondary and tertiary graphs of two sets of RNA with Monte Carlo simulations. The first consisted of 91 target ribozyme and riboswitch sequences of moderate lengths (<150 nt) having a variety of secondary, H-type pseudoknots and kissing loop interactions. The second set consisted of 71 more diverse sequences across many RNA families. Using a simple empirical energy model for tertiary interactions and only sequence information for each target as input, the simulations examined how tertiary interactions impact the statistical mechanics of the fold ensembles. The results show that the graphs proliferate enormously when tertiary interactions are possible, producing an entropic driving force for the ensemble to access folds having tertiary structures even though they are overall energetically unfavorable in the energy model. For each of the targets in the two test sets, we assessed the quality of the model and the simulations by examining how well the simulated structures were able to predict the native fold, and compared the results to fold predictions from ViennaRNA. Our model generated good or excellent predictions in a large majority of the targets. Overall, this method was able to produce predictions of comparable quality to Vienna, but it outperformed Vienna for structures with H-type pseudoknots. The results suggest that while tertiary interactions are predicated on real-space contacts, their impacts on the folded structure of RNA can be captured by graph space information for sequences of moderate lengths, using a simple tertiary energy model for the loops, the base pairs, and base stacks.

Keywords: Monte Carlo; RNA folding; fold prediction; graphs; secondary and tertiary structure.


Figures

FIGURE 1.
FIGURE 1.
Three types of graphs representing (A) RNA secondary and (B) RNA tertiary structures. In a cord graph, arcs connect bases that are paired. In a frame graph, telescoping picture frames connect paired bases. In a terrace graph, junctions (or loops) are visualized as flat terraces supported on top of pillars representing the two strands that make up the duplex bounding the junction. The terraces on the right are color-coded to match the junction sequences on the frame diagrams in the center. Tertiary contacts are represented by frames on the lower half plane in a frame diagram, and by rainbow arcs in a terrace diagram.
FIGURE 2.
FIGURE 2.
Examples of RNA secondary and tertiary structures and their corresponding frame graphs: (2wj) two-way junction, (3wj) three-way junction, (4wj) four-way junction, (dp) duplex, (pk) pseudoknot, (kl) kissing loop. Panels A–C show secondary graphs. D–F show tertiary graphs.
FIGURE 3.
FIGURE 3.
Some of the key MC moves used in the simulation. Panels AD depict four MC moves that rearrange the secondary structure of a graph. The moves are labeled according to the routines in which they were implemented inside the simulation. Panels (E) and (F) illustrate two MC moves that rearrange the tertiary structure of a graph, both were implemented in the simulation as MC7.
FIGURE 4.
FIGURE 4.
Fold prediction for 2N3Q: (A) best match for native structure, (B) lowest energy and (C) most probable graph in the MC simulated ensemble. (D) Spectrum of the ensemble at μ = 9.99 kBT, with the most probable graph in pink and a linear fit to the bottom of the spectrum as the orange dashed line. The sequence and the cord graph of the native fold (http://rna.bgsu.edu/rna3dhub/pdb/2N3Q/2d) are given on the lower right. Quality scores for the most probable fold are TPR = 0.91 and mFPR = 0.05.
FIGURE 5.
FIGURE 5.
Panels A–F show examples of fold predictions for sequences with only secondary interactions in their native structures.
FIGURE 6.
FIGURE 6.
Fold prediction for 1Y26: (A) best match for native structure, (B) lowest energy and (C) most probable graph in the MC simulated ensemble. (D) Energy of graphs sampled during a simulation with 0.12 billion MC passes. (E) Spectrum of the ensemble at μ = 0.0 kBT. (FH) Three sample structures corresponding to the energies indicated by the orange lines in the spectrum. (I) The ensemble average energy (black dots) of the simulations, the square root of the energy variance from the mean (dashed line above and dashed line below the average) and the entire span of the spectrum indicated by the vertical lines, as a function of μ in units of kBT. The sequence and the cord graph of the native fold (http://rna.bgsu.edu/rna3dhub/pdb/1Y26/2d) are given on the lower right. Quality scores for the most probable fold are TPR = 0.92 and mFPR = 0.04.
FIGURE 7.
FIGURE 7.
Panels A–F show examples of fold predictions for sequences with only kissing loops interaction in their native structures.
FIGURE 8.
FIGURE 8.
Fold prediction for 2MIY: (A) best match for native structure, (B) lowest energy and (C) most probable graph in the MC simulated ensemble. (D) Energy of graphs sampled during a simulation with 0.24 billion MC passes. (E) Spectrum of the ensemble at μ = 0.1 kBT, with the most probable graph in pink and the lowest energy graph in blue. (F) The ensemble average energy (black dots) of the simulations, the square root of the energy variance from the mean (dashed line above and dashed line below the average) and the entire span of the spectrum indicated by the vertical lines, as a function of μ in units of kBT. The sequence and the cord graph of the native fold (http://rna.bgsu.edu/rna3dhub/pdb/2MIY/2d) are given on the lower right. Quality scores for the most probable fold are TPR = 0.95 and mFPR = 0.
FIGURE 9.
FIGURE 9.
Panels A–G show examples of fold predictions for sequences with H-type pseudoknot interaction in their native structures.
FIGURE 10.
FIGURE 10.
Quality scores of each target are plotted with mFPR on the vertical axis (higher is better) and TPR on the horizontal axis (toward the right is better) for all Rfam targets in solid orange and all Rzs targets in open circles. ASMC predictions are shown in the top panel, and Vienna on the bottom. The gray area represents the region inside which a particular prediction is considered excellent.
FIGURE 11.
FIGURE 11.
Panels A–E show evolution of the spectrum of the simulated ensemble for 2MIY as a function of μ in units of kBT. The most probable graph in each is shown in pink, and its frame graph on the right. (F) Entropy of the ensemble in units of kB as a function of the chemical potential. The nonmonotonic behavior indicated by the white circles suggests possible sampling ergodicity issues. The dashed line is a guide to the eye.

Similar articles

References

    1. Bayrak CS, Kim N, Schlick T. 2017. Using sequence signatures and kink-turn motifs in knowledge-based statistical potentials for RNA structure prediction. Nucleic Acids Res 45: 5414–5422. 10.1093/nar/gkx045 - DOI - PMC - PubMed
    1. Berman HM, Olson WK, Beveridge DL, Westbrook J, Gelbin A, Demeny T, Hsieh SH, Srinivasan AR, Schneider B. 1992. The nucleic acid database. A comprehensive relational database of three-dimensional structures of nucleic acids. Biophys J 63: 751–759. 10.1016/S0006-3495(92)81649-1 - DOI - PMC - PubMed
    1. Bisaria N, Greenfeld M, Limouse C, Mabuchi H, Herschlag D. 2017. Quantitative tests of a reconstitution model for RNA folding thermodynamics and kinetics. Proc Natl Acad Sci 114: E7688–E7696. 10.1073/pnas.1703507114 - DOI - PMC - PubMed
    1. Bonneau E, Girard N, Lemieux S, Legault P. 2015. The NMR structure of the II–III–VI three-way junction from the Neurospora VS ribozyme reveals a critical tertiary interaction and provides new insights into the global ribozyme structure. RNA 21: 1621–1632. 10.1261/rna.052076.115 - DOI - PMC - PubMed
    1. Cao S, Chen S-J. 2006. Predicting RNA pseudoknot folding thermodynamics. Nucleic Acids Res 34: 2634–2652. 10.1093/nar/gkl346 - DOI - PMC - PubMed

LinkOut - more resources