. 2024 Oct;18(10):e70028.
doi: 10.1111/irv.70028.

Evolution of Influenza A(H3N2) Viruses in Bhutan for Two Consecutive Years, 2022 and 2023

Affiliations

Evolution of Influenza A(H3N2) Viruses in Bhutan for Two Consecutive Years, 2022 and 2023

Tshering Dorji et al. Influenza Other Respir Viruses. 2024 Oct.

Abstract

Background: Influenza A viruses pose a significant public health threat globally and are characterized by rapid evolution of the hemagglutinin (HA) gene causing seasonal epidemics. The aim of this study was to investigate the evolutionary dynamics of A(H3N2) circulating in Bhutan during 2022 and 2023.

Methods: We analysed 166 whole-genome sequences of influenza A(H3N2) from Bhutan, obtained from the GISAID database. We employed a Bayesian Markov Chain Monte Carlo (MCMC) framework, with a curated global dataset of HA sequences from regions with significant migration links to Bhutan. Phylogenetic, temporal, and phylogeographic analyses were conducted to elucidate the evolutionary dynamics and spatial dissemination of the viruses.

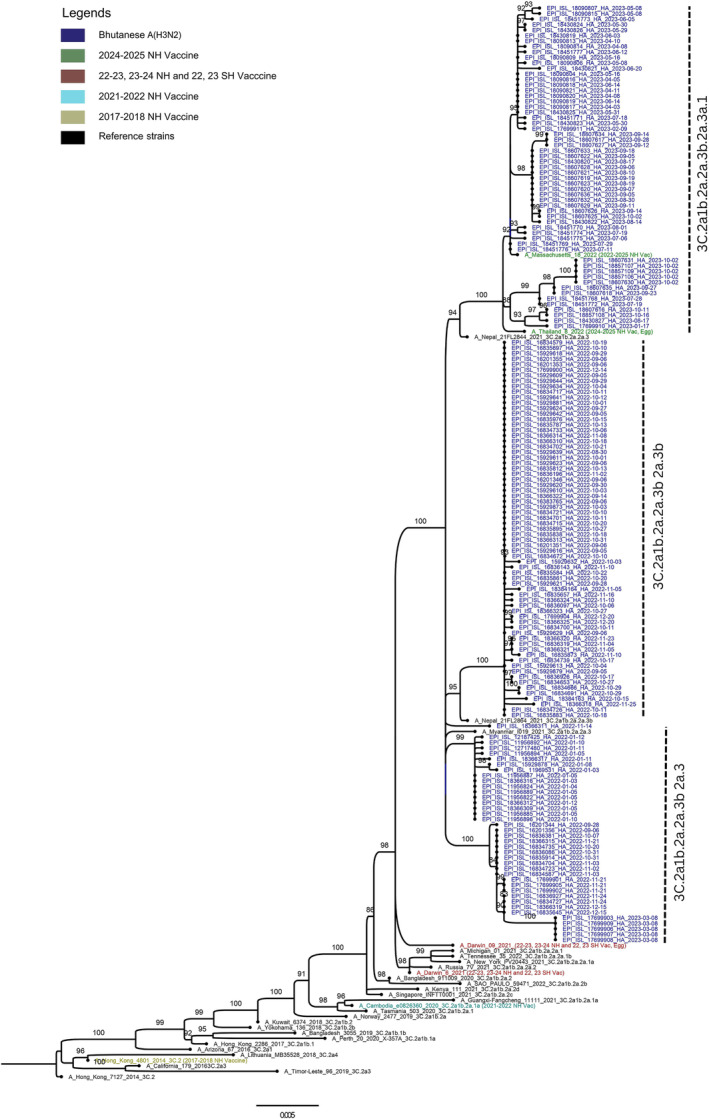
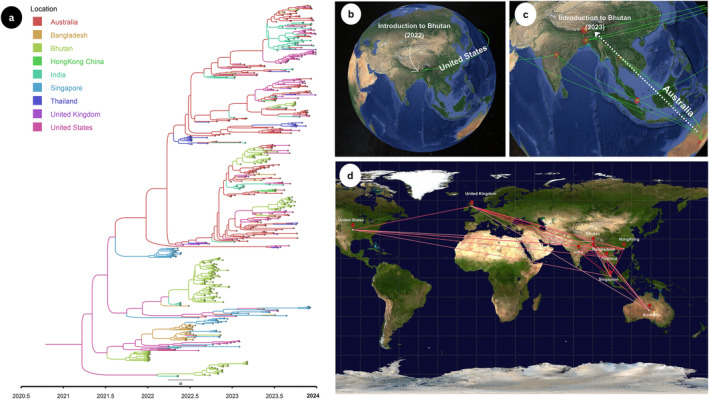
Results: Our phylogenetic analysis identified the circulation of influenza A(H3N2) Clade 3C.2a1b.2a.2 in Bhutan during 2022 and 2023, with viruses further classified into three subclades: 2a.3 (39/166), 2a.3a.1 (58/166) and 2a.3b (69/166). The TMRCA estimates suggest that these viral lineages originated approximately 1.93 years prior to their detection. Phylogeographic analysis indicates introductions from the United States in 2022 and Australia in 2023. The mean evolutionary rate across all gene segments was calculated to be 4.42 × 10⁻³ substitutions per site per year (95% HPD: 3.19 × 10⁻³ to 5.84 × 10⁻³), with evidence of purifying selection and limited genetic diversity. Furthermore, reassortment events were rare, with an estimated rate of 0.045 events per lineage per year.

Conclusion: Our findings show that primary forces shaping the local evolution of the influenza A(H3N2) in Bhutan are largely stochastic, with only sporadic instances of adaptive change, and thus underscore the importance of continuous surveillance to mitigate the impact of evolving strains.

Keywords: Bhutan; H3N2 subtype; influenza A virus; molecular evolution; mutation.


Conflict of interest statement

The authors declare no conflicts of interest.

Figures

FIGURE 1
FIGURE 1
Maximum‐likelihood (ML) phylogenetic tree of the hemagglutinin (HA) sequences of A(H3N2) strains from Bhutan during the period of study. The WHO recommended vaccine A(H3N2) strains of the northern hemisphere and reference clades from GISAID were included and annotated in the trees. The Bhutanese strains that belonged to 3C.2a1b.2a.2 are annotated in blue, and reference clades were shown in black. The phylogenetic tree was inferred by the maximum‐likelihood method using 1000 bootstrap replicates implemented in IQ‐TREE webserver. Branch values of >80% are indicated at the nodes.
FIGURE 2
FIGURE 2
Sequence alignment showing mutations in selected positions of HA sequences of Bhutanese influenza A(H3N2) strains. In the sequence alignment, mutations in specific positions of HA sequences from Bhutanese influenza A(H3N2) strains are highlighted. Dots indicate amino acids similar to those in the A/Darwin/06/2021 vaccine strain, whereas residue changes are highlighted in bold red. The amino acid positions are labelled with the corresponding antigenic sites.
FIGURE 3
FIGURE 3
Bayesian skyline plot of HA and NA genes. This plot depicts the temporal changes in genetic diversity for HA (a) and NA (b) genes. The x axis shows the timeline in years, whereas the y axis measures relative genetic diversity, expressed as (N e t), where (N e ) is the effective population size and (t) is the generation time. The mean trend is represented by the blue line, with the shaded area indicating 95% HPD.
FIGURE 4
FIGURE 4
Bayesian Maximum‐clade‐credibility (MCC) tree and phylogeographic analysis of the migratory patterns of Bhutanese influenza A(H3N2) viruses. (a) Global MCC tree for influenza A(H3N2) virus in 2022 and 2023. Branches were coloured according to most probable geographic origin. (b) 2022 epidemic was introduced from the United States (c) 2023 from Australia, and (d) Bayes factor (BF) test for significant nonzero rates. Only rates supported by a BF greater than 3 are indicated. The colour of the line represents the relative strength by which the rates are supported; white suggest relatively weak and red lines depicts strong rate support.

References

    1. WHO , “Influenza (Seasonal) Fact‐Sheets,” (2020). accessed November 13, 2023, https://www.who.int/news‐room/fact‐sheets/detail/influenza‐%28seasonal%29.
    1. Nair H., Brooks W. A., Katz M., et al., “Global Burden of Respiratory Infections Due to Seasonal Influenza in Young Children: A Systematic Review and Meta‐Analysis,” Lancet 378, no. 9807 (2011): 1917–1930, 10.1016/S0140-6736(11)61051-9. - DOI - PubMed
    1. Thapa B., Roguski K., Azziz‐Baumgartner E., et al., “The Burden of Influenza‐Associated Respiratory Hospitalizations in Bhutan, 2015–2016,” Influenza and Other Respiratory Viruses 13, no. 1 (2019): 28–35, 10.1111/IRV.12605. - DOI - PMC - PubMed
    1. Nuwarda R. F., Alharbi A. A., and Kayser V., “An Overview of Influenza Viruses and Vaccines,” Vaccine 9, no. 9 (2021): 1032, 10.3390/vaccines9091032. - DOI - PMC - PubMed
    1. Dadonaite B., Gilbertson B., Knight M. L., et al., “The Structure of the Influenza A Virus Genome,” Nature Microbiology 4, no. 11 (2019): 1781–1789, 10.1038/s41564-019-0513-7. - DOI - PMC - PubMed

MeSH terms

Substances

LinkOut - more resources