

Element Changes Occurring in Brain Point at the White Matter Abnormalities in Rats Exposed to the Ketogenic Diet During Prenatal Life
- PMID: 39443296
- PMCID: PMC11587514
- DOI: 10.1021/acschemneuro.4c00283
Element Changes Occurring in Brain Point at the White Matter Abnormalities in Rats Exposed to the Ketogenic Diet During Prenatal Life
Abstract
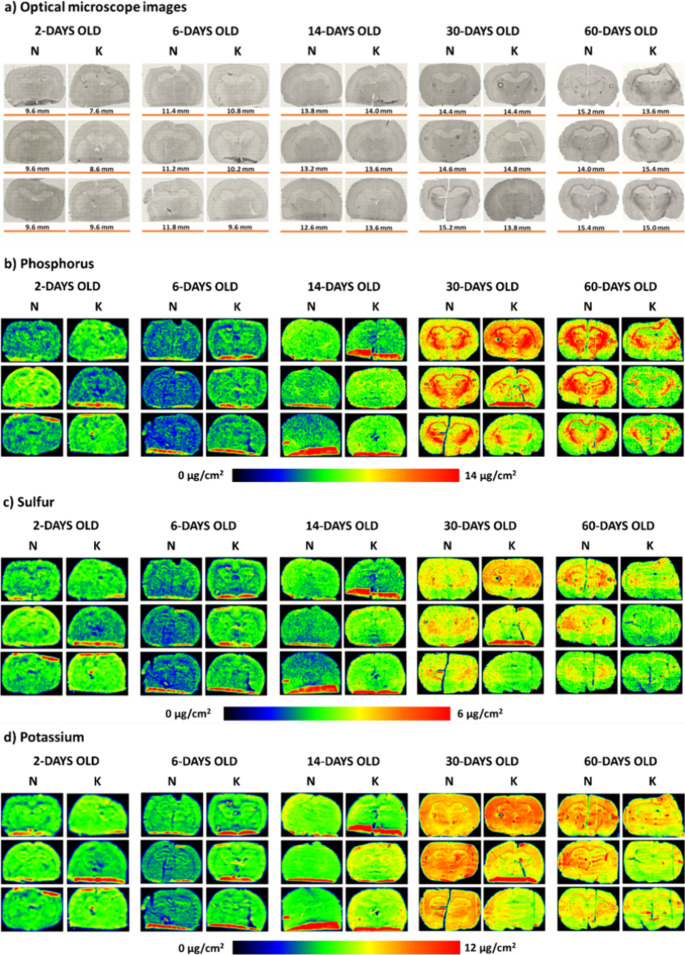
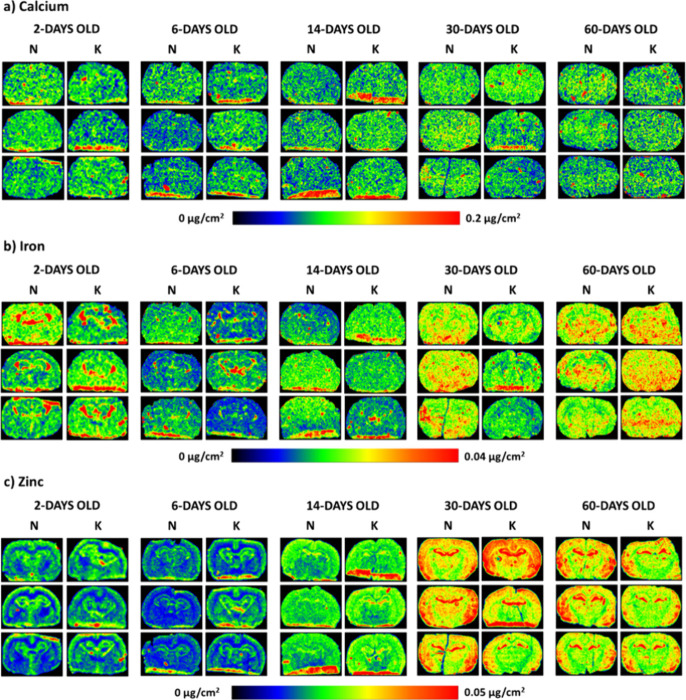
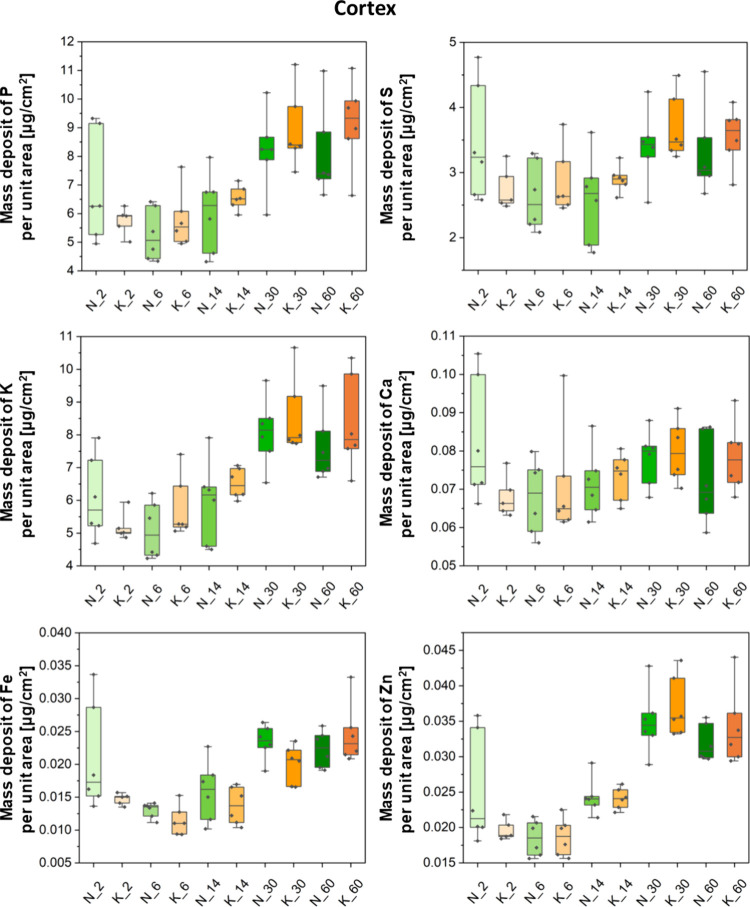
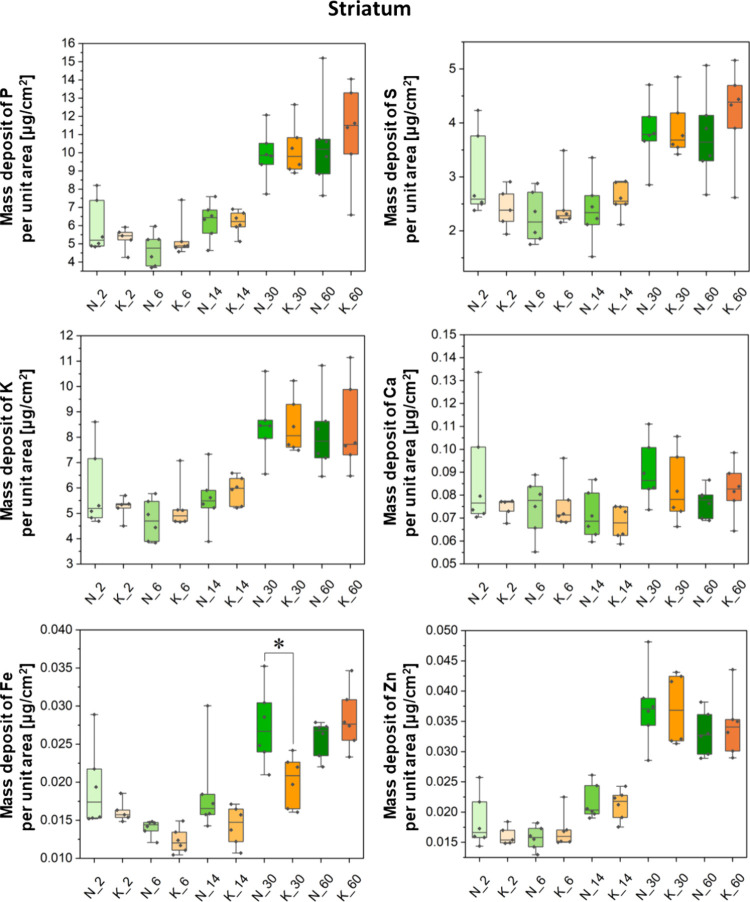
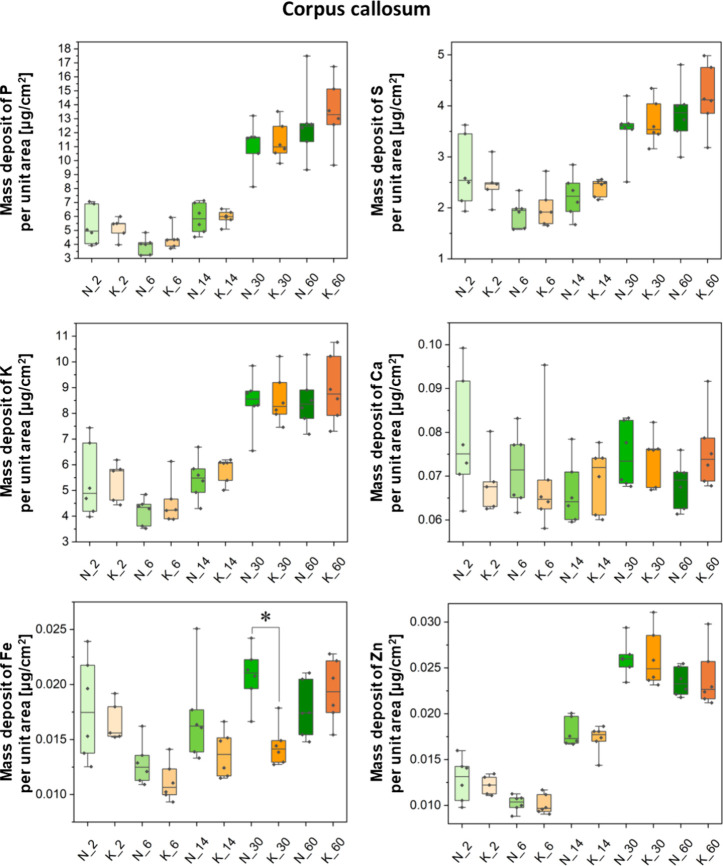
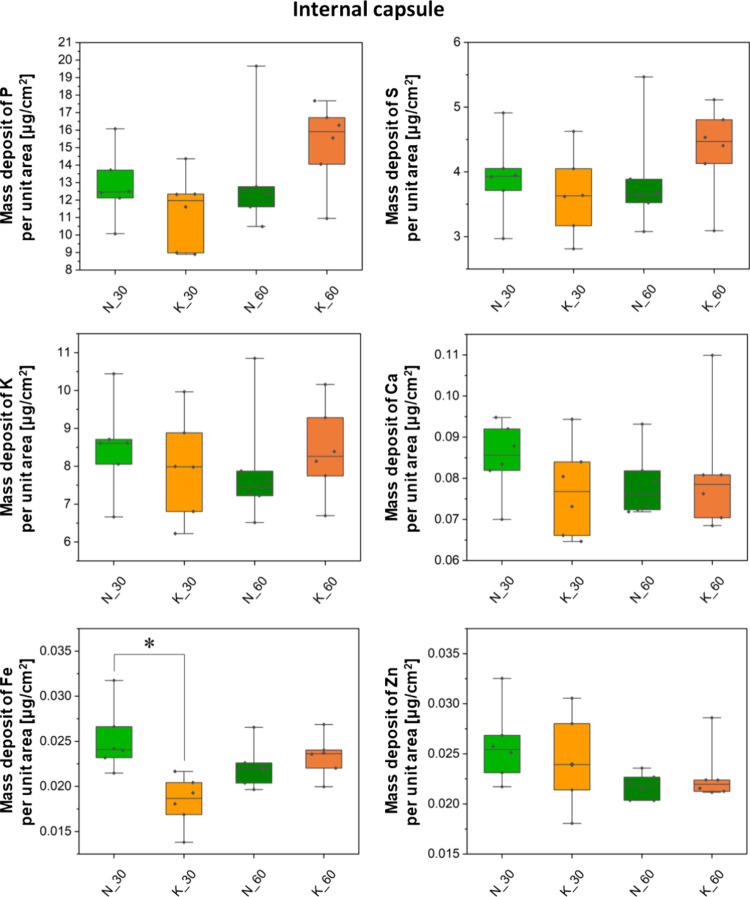
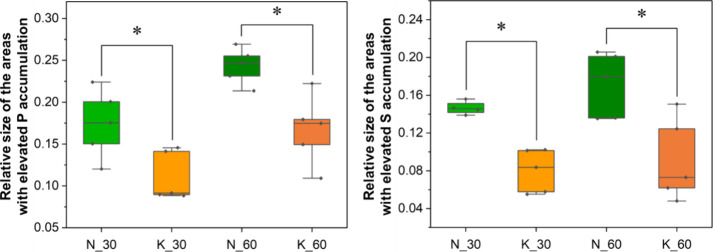
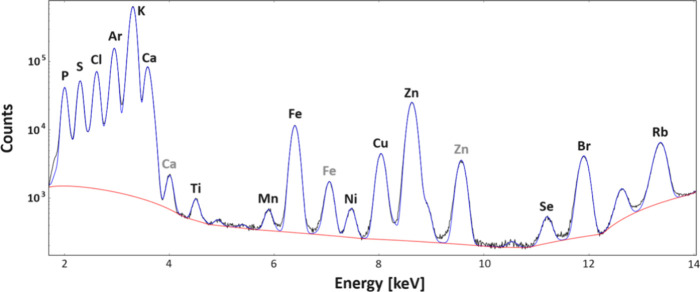
A large number of clinical studies demonstrate that the ketogenic diet (KD) may be an effective approach to the reduction of epileptic seizures in children and adults. Such dietary therapy could also help pregnant women with epilepsy, especially since most antiseizure drugs have teratogenic action. However, there is a lack of medical data, considering the safety of using KD during gestation for the progeny. Therefore, we examined the influence of KD used prenatally in rats on the elemental composition of the selected brain regions in their offspring. For this purpose, synchrotron radiation-induced X-ray fluorescence (SR-XRF) microscopy was utilized, and elements such as P, S, K, Ca, Fe, and Zn were determined. Moreover, to verify whether the possible effects of KD are temporary or long-term, different stages of animal postnatal development were taken into account in our experiment. The obtained results confirmed the great applicability of SR-XRF microscopy to track the element changes occurring in the brain during postnatal development as well as those induced by prenatal exposure to the high-fat diet. The topographic analysis of the brains taken from offspring of mothers fed with KD during pregnancy and appropriate control individuals showed a potential influence of such dietary treatment on the brain levels of elements such as P and S. In the oldest progeny, a significant reduction of the surface of brain areas characterized by an increased P and S content, which histologically/morphologically correspond to white matter structures, was noticed. In turn, quantitative elemental analysis showed significantly decreased levels of Fe in the striatum and white matter of 30-day-old rats exposed prenatally to KD. This effect was temporary and was not noticed in adult animals. The observed abnormalities may be related to the changes in the accumulation of sphingomyelin and sulfatides and may testify about disturbances in the structure and integrity of the myelin, present in the white matter.
Keywords: animal models; brain development; ketogenic diet; multielement analysis; prenatal exposure; synchrotron X-ray fluorescence microscopy.
Conflict of interest statement
The authors declare no competing financial interest.
Figures
Similar articles
-
Does Ketogenic Diet Used in Pregnancy Affect the Nervous System Development in Offspring?─FTIR Microspectroscopy Study.ACS Chem Neurosci. 2023 Aug 2;14(15):2775-2791. doi: 10.1021/acschemneuro.3c00331. Epub 2023 Jul 20. ACS Chem Neurosci. 2023. PMID: 37471579 Free PMC article.
-
The influence of the ketogenic diet on the elemental and biochemical compositions of the hippocampal formation.Epilepsy Behav. 2015 Aug;49:40-6. doi: 10.1016/j.yebeh.2015.04.042. Epub 2015 May 16. Epilepsy Behav. 2015. PMID: 25986320
-
Various ketogenic diets can differently support brain resistance against experimentally evoked seizures and seizure-induced elemental anomalies of hippocampal formation.J Trace Elem Med Biol. 2017 Jul;42:50-58. doi: 10.1016/j.jtemb.2017.04.002. Epub 2017 Apr 10. J Trace Elem Med Biol. 2017. PMID: 28595792
-
Ketogenic diets for drug-resistant epilepsy.Cochrane Database Syst Rev. 2018 Nov 7;11(11):CD001903. doi: 10.1002/14651858.CD001903.pub4. Cochrane Database Syst Rev. 2018. Update in: Cochrane Database Syst Rev. 2020 Jun 24;6:CD001903. doi: 10.1002/14651858.CD001903.pub5. PMID: 30403286 Free PMC article. Updated.
-
Interactions between the gut microbiome and ketogenic diet in refractory epilepsy.Int Rev Neurobiol. 2022;167:217-249. doi: 10.1016/bs.irn.2022.06.002. Epub 2022 Jun 25. Int Rev Neurobiol. 2022. PMID: 36427956 Review.
Cited by
-
Sex-dependent effects of a gestational ketogenic diet on offspring birth and lifespan.PLoS One. 2025 Jul 17;20(7):e0328455. doi: 10.1371/journal.pone.0328455. eCollection 2025. PLoS One. 2025. PMID: 40674330 Free PMC article.
References
Publication types
MeSH terms
LinkOut - more resources
Full Text Sources
Research Materials
