. 2024 Oct;28(20):e70173.
doi: 10.1111/jcmm.70173.

Mitogen-activated protein kinase kinase kinase 1 facilitates the temozolomide resistance and migration of GBM via the MEK/ERK signalling

Affiliations

Mitogen-activated protein kinase kinase kinase 1 facilitates the temozolomide resistance and migration of GBM via the MEK/ERK signalling

Sicheng Wu et al. J Cell Mol Med. 2024 Oct.

Abstract

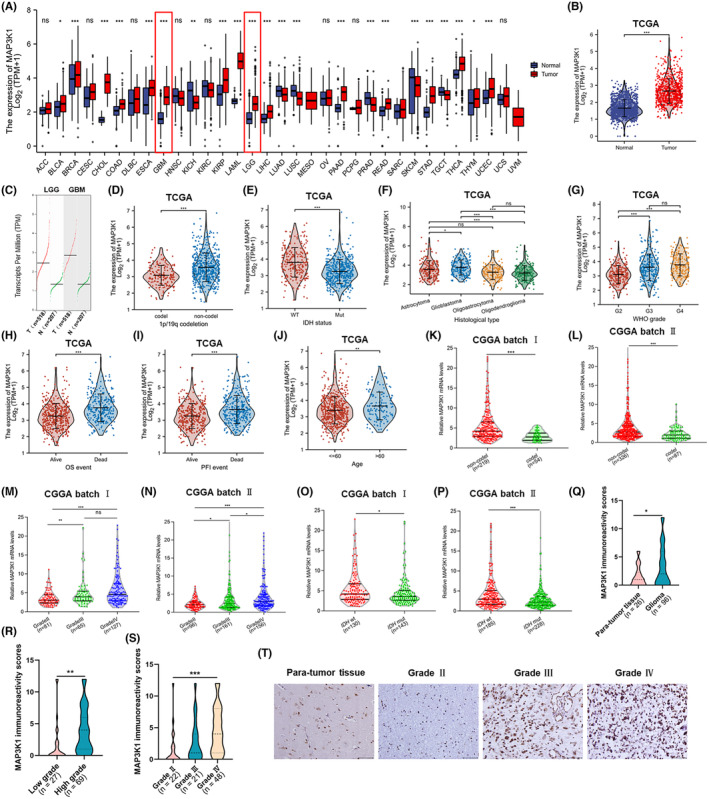
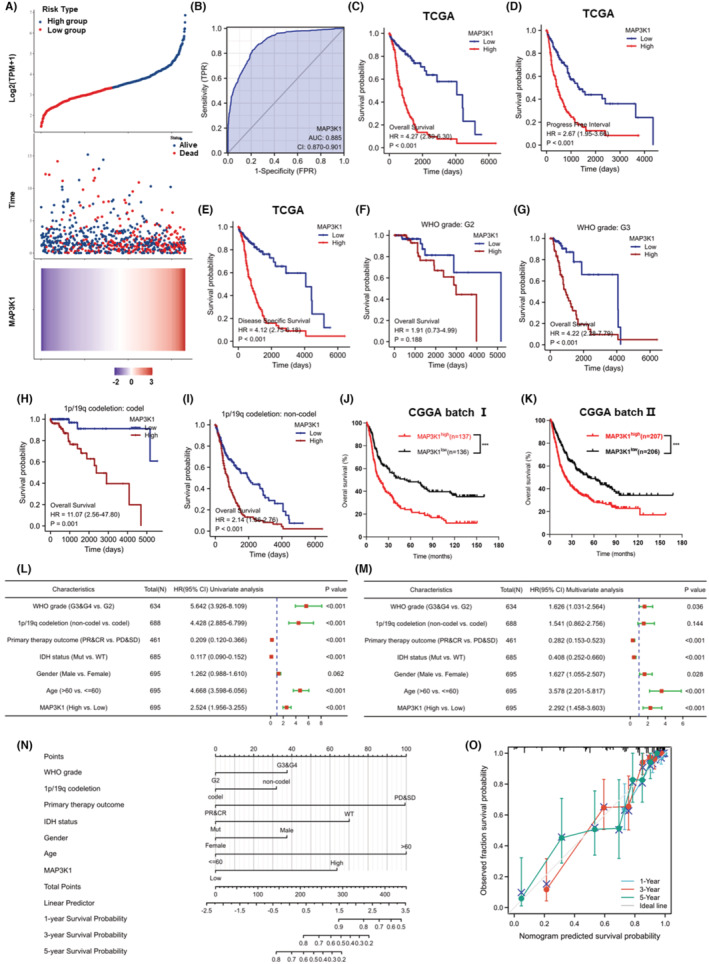
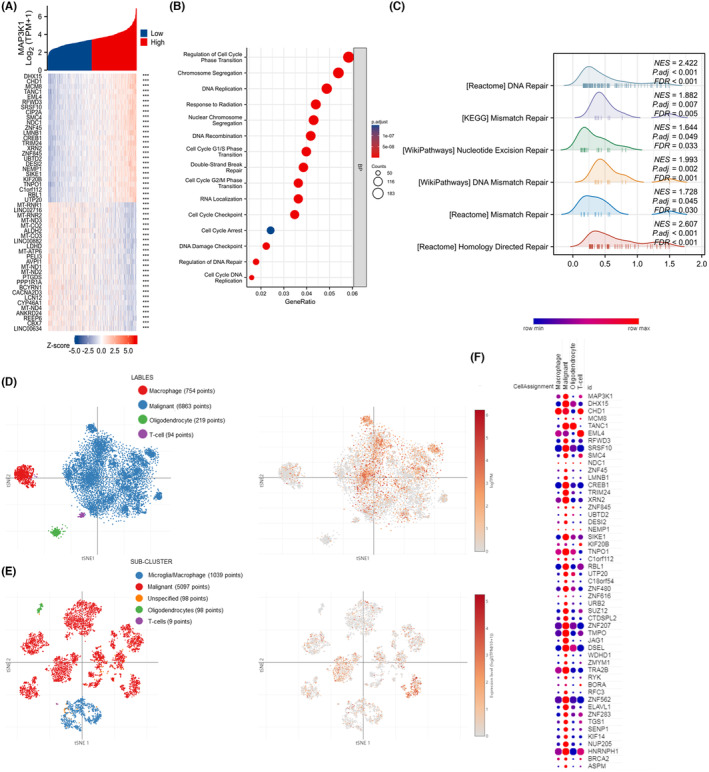
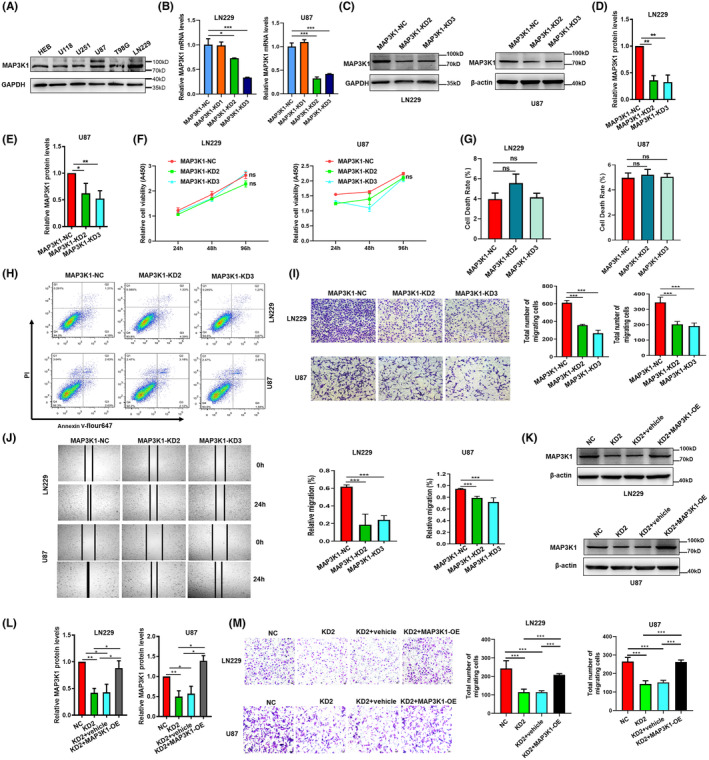
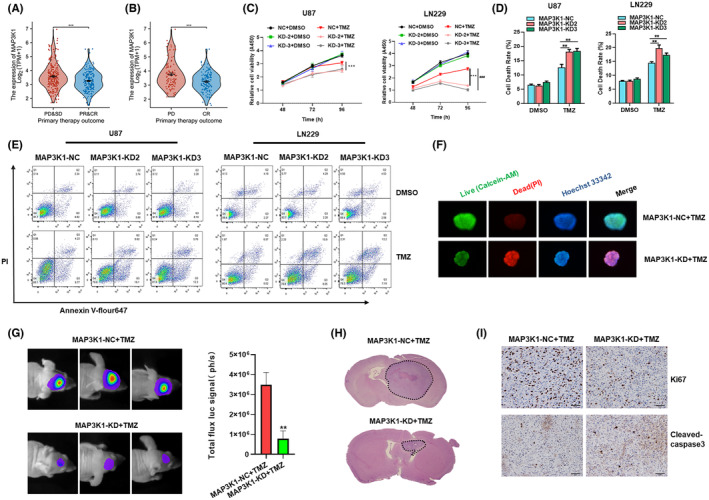
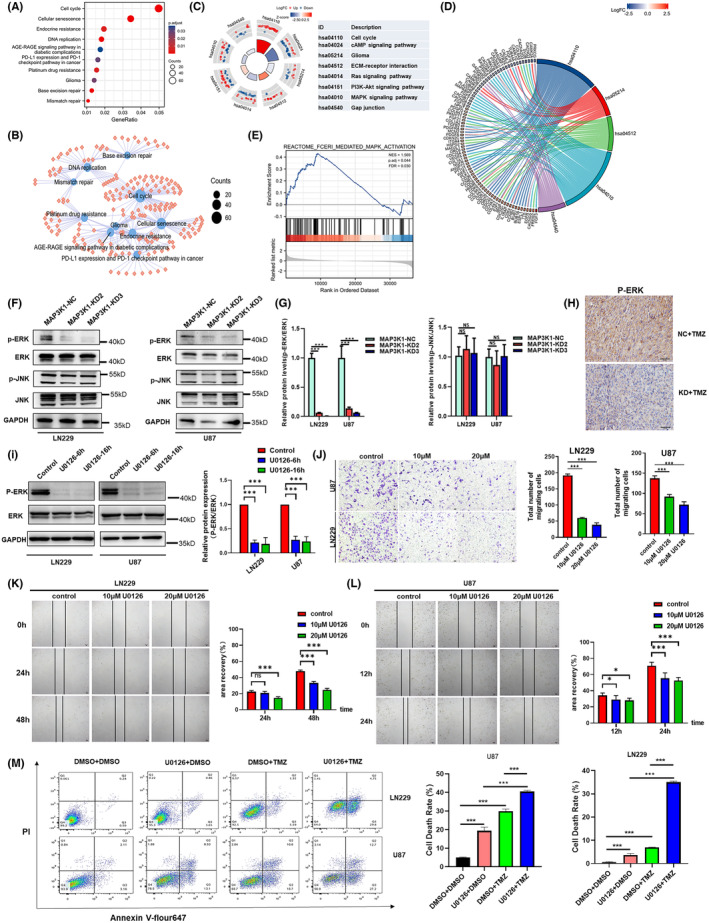
Mitogen-Activated Protein Kinase Kinase Kinase 1 (MAP3K1) is overexpressed in gliomas; however, its clinical significance, biological functions, and underlying molecular mechanisms remain unclear. Abnormal overexpression of MAP3K1 in glioma is strongly associated with unfavourable clinicopathological characteristics and disease progression. MAP3K1 could potentially serve as a reliable diagnostic and prognostic biomarker for glioma. MAP3K1 silencing suppressed the migration but had no effect on the proliferation and cell death of Glioblastoma Multiforme (GBM) cells. MAP3K1 knockdown exacerbated the temozolomide (TMZ) induced inhibition of glioma cell proliferation and death of GBM cells. In addition, MAP3K1 knockdown combined with TMZ treatment significantly inhibited the growth and increased cell death in organoids derived from GBM patients. MAP3K1 knockdown reversed TMZ resistance of GBM in intracranial glioma model. In terms of molecular mechanisms, the phosphorylation level of ERK was significantly decreased by MAP3K1 silencing. No significant change in the JNK pathway was found in MAP3K1-silenced GBM cells. Inhibition of ERK phosphorylation suppressed the migration and enhanced the TMZ sensibility of GBM cells. MAP3K1 was correlated with the immune infiltration in glioma. MAP3K1 could facilitate the migration and TMZ resistance of GBM cells through MEK/ERK signalling.

Keywords: MAP3K1; MEK/ERK; TMZ resistance; glioma; migration; patients‐derived organoids.


Conflict of interest statement

The authors declare that they have no competing interests.

Figures

FIGURE 1
FIGURE 1
Aberrantly expressed MAP3K1 was significantly associated with poor clinicopathological characters of glioma. (A) Comparison of MAP3K1 expression between 33 types of tumours and normal samples from TCGA and Genotype‐Tissue Expression (GTEx) databases. (B) The mRNA expression of MAP3K1 in glioma and normal tissues from TCGA database and GTEx. (C) The transcript levels of MAP3K1 in glioma and corresponding normal tissues from the Gene Expression Profiling Interactive Analysis (GEPIA) web server. T, tumour tissue; N, normal tissue. The expression levels of MAP3K1 in different 1p/19q statuses (D), isocitrate dehydrogenase (IDH) genotypes (E), histological types (F) and WHO grades (G) of glioma analysed by TCGA database. The expression of MAP3K1 in different groups in view of the prognosis of glioma patients, including the OS (H), and PFI (I) event of glioma patients from TCGA. (J) The comparison of MAP3K1 expression levels between the glioma patients under or over 60 years from TCGA database. The mRNA expression levels of MAP3K1 with different 1p/19q statuses analysed by CGGA batch I (K) and batch II (L). The mRNA expression levels of MAP3K1 with different WHO grades analysed by CGGA batch I (M) and batch II (N). The mRNA expression levels of MAP3K1 with different IDH genotypes analysed by CGGA batch I (O) and batch II (P). (Q) MAP3K1 immunoreactivity scores analysed in human para‐tumour and glioma tissues. (R) MAP3K1 immunoreactivity scores analysed in low‐grade and high‐grade glioma tissues. (S) MAP3K1 immunoreactivity scores analysed in grade II, grade III and grade IV glioma tissues. (T) Typical immunohistochemistry images of MAP3K1 in human para‐tumour and different grades of glioma tissues. Scale bar, 50 μm.*p < 0.05, **p < 0.01, ***p < 0.001.
FIGURE 2
FIGURE 2
MAP3K1 expression was negatively correlated with the prognosis of glioma. (A) Based on the risk score, patients in TCGA cohorts were divided into high‐ and low‐risk groups. Risk score distribution, survival overview and heatmap of MAP3K1 expression were showed. (B) ROC curve for MAP3K1 in normal tissue and glioma tissues. (C) The overall survival (OS) analysis from TCGA database. The progression free interval (PFI) (D) and disease specific survival (DSS) (E) in TCGA dataset. (F, G) The survival curves comparing the high and low expression of MAP3K1 with different WHO grades from TCGA dataset. (H, I) The survival curves comparing the high and low expression of MAP3K1 with different 1p/19q statuses from TCGA dataset. (J, K) The OS of MAP3K1 expression from the CGGA batch I (J) and batch II (K). Forest plot exhibiting univariate (L) and multivariate regression analysis (M) of MAP3K1 expression and other clinicopathologic parameters in glioma patients. (N) Nomogram for predicting 1‐, 3‐ and 5‐year survival probability of glioma patients in TCGA cohort. (O) Calibration plots of nomogram showing great consistency between predicted and observed 1‐, 3‐ and 5‐year survival probability in TCGA cohort. ***p < 0.001.
FIGURE 3
FIGURE 3
Function enrichment analysis of MAP3K1 in glioma. (A) The heatmap of the top 25 genes most positively or negatively correlated with MAP3K1. (B) GO enrichment analysis for biological process (BP) of MAP3K1 in TCGA dataset. (C) GSEA enrichment analysis of MAPK3K1 and its co‐expression genes in glioma by TCGA data was performed. The t‐SNE of MAP3K1 expression in different sub‐clusters of gliomas from study 1 (D) and study 2 (E). (F)The top 25 genes positively associated with MAP3K1 in glioma from TCGA mainly enriched in malignant tumor cells along with macrophage cells.
FIGURE 4
FIGURE 4
MAP3K1 Silencing suppresses the migration and had no effect on the proliferation of GBM cells. (A) Western blot were performed to analyse the expression of MAP3K1 in GBM cell lines and HEB. The cells were transfected with different MAP3K1‐siRNA (MAP3K1‐KD1, MAP3K1‐KD2 and MAP3K1‐KD3) and scramble sequence siRNA (MAP3K1‐NC). MAP3K1 was silenced by siRNA in U87 and LN229 cells. (B) Knockdown efficiency was evaluated by RT‐qPCR. (C–E) Knockdown efficiency was evaluated by western blot. Protein intensity was analysed by densitometry and the levels were normalized to β‐actin in U87 or GAPDH in LN229. (F) The viability of U87 and LN229 cells under MAP3K1 knockdown was evaluated by CCK8. Flow Cytometry analysed the cell death (G, H) of MAP3K1 knockdown in U87 and LN229 cells. (I) Transwell assay analysed the migration ability of U87 and LN229 cells under MAP3K1 knockdown. (J) Wound scratch assay analysed the migration ability of U87 and LN229 cells under MAP3K1 knockdown. (K, L) MAP3K1 was overexpressed in MAP3K1 silenced GBM cells. The cells were transfected with siRNA MAP3K1‐KD2 (KD2) and scramble sequence siRNA (NC). The MAP3K1 silenced GBM cells were transfected pcDNA3.1 (vehicle) or pcDNA3.1‐ MAP3K1 (MAP3K1‐OE). Western blot was performed to analyse the expression of MAP3K1 in U87 and LN229 cells. (M) Transwell assay analysed the migration ability of U87 and LN229 cells. Data represent three independent experiments. *p < 0.05, **p < 0.01, ***p < 0.001.
FIGURE 5
FIGURE 5
MAP3K1 silencing enhances the TMZ sensitivity of GBM. (A, B) The expression of MAP3K1 in different primary therapy outcome of glioma patients in TCGA database. PD, progressive disease; SD, stable disease; PR, partial response; CR, complete response. (C) The viability of MAP3K1 silenced U87 and LN229 cells under TMZ treatment was evaluated by CCK8. (D, E) Flow Cytometry analysed the cell death of MAP3K1 knockdown U87 and LN229 cells under TMZ (200 μM) treatment for 72 h. (F) MAP3K1 silenced GBM patients‐derived organoids were treated by TMZ, the growth and cell death of GBM patients‐derived organoids were detected by 3D live dead cell viability assay. (G) Representative bioluminescent images and the quantification of the U87 tumour‐bearing mice on Days 21. The data are shown as mean ± SD (n = 5). (H) The growth of the glioma from tumour‐bearing mice was evaluated by HE staining method. (I) Representative IHC images of the intracranial glioma tissue from tumour‐bearing mice stained by Ki67 and cleaved‐caspase3. **p < 0.01, ***p < 0.001, ###p < 0.001.
FIGURE 6
FIGURE 6
MAP3K1 could potentially enhance the migration and TMZ resistance of GBM cells via MEK/ERK pathway. (A) KEGG pathway analysis of MAP3K1 in glioma. (B) The enriched KEGG pathway terms of MAP3K1 and its co‐expression genes in glioma. (C) Circle plot of enriched KEGG pathway. The bar plots are shown in the inner ring which the height of the bar indicates the significance of the term, and colour corresponds to the z‐score. Expression levels (logFC) for the genes in each term are shown in the scatter plots of outer ring. (D) Chord plot of enriched KEGG pathway; the genes are linked via ribbons to their assigned terms. (E) GSEA of MAP3K1 and its co‐expression genes in glioma. (F, G) Western blot analysed the level of ERK, p‐ERK, JNK and p‐JNK in the MAP3K1 silenced GBM cells. (H) Representative IHC images of the intracranial glioma tissue from tumour‐bearing mice stained by p‐ERK. (I) U87 and LN229 cells were treated with U0126 (10 uM) for 6 and16 h. Western blot analysed the level of ERK and p‐ERK in U87 and LN229 cells. (J) Transwell assay analysed the migration ability of U87 and LN229 cells under the treatment with U0126. (K, L) Wound scratch assay analysed the migration ability of U87 and LN229 cells under the treatment with U0126. (M) Flow Cytometry analysed the cell death of U87 and LN229 cells under indicated treatment for 72 h. TMZ (200 μM) and U0126 (10 uM) were used. Data represent three independent experiments. *p < 0.05, ***p < 0.001.

Similar articles

References

    1. Yao M, Li S, Wu X, et al. Cellular origin of glioblastoma and its implication in precision therapy. Cell Mol Immunol. 2018;15(8):737‐739. - PMC - PubMed
    1. Cloughesy TF, Cavenee WK, Mischel PS. Glioblastoma: from molecular pathology to targeted treatment. Annu Rev Pathol. 2014;9:1‐25. - PubMed
    1. Weller M, Wick W, Aldape K, et al. Glioma. Nat Rev Dis Primers. 2015;10:15017. - PubMed
    1. Louis DN, Perry A, Wesseling P, et al. The 2021 WHO classification of tumors of the central nervous system: a summary. Neuro‐Oncology. 2021;23(8):1231‐1251. - PMC - PubMed
    1. Wang J, Zuo J, Wahafu A, Wang MD, Li RC, Xie WF. Combined elevation of TRIB2 and MAP3K1 indicates poor prognosis and chemoresistance to temozolomide in glioblastoma. CNS Neurosci Ther. 2020;26(3):297‐308. - PMC - PubMed

MeSH terms

LinkOut - more resources