

Unveiling the Spectrum of Glucose Variability: A Novel Perspective on FreeStyle Libre Monitoring Data
- PMID: 39443334
- PMCID: PMC11561226
- DOI: 10.1007/s13300-024-01647-x
Unveiling the Spectrum of Glucose Variability: A Novel Perspective on FreeStyle Libre Monitoring Data
Abstract
Introduction: Since the introduction of insulin therapy, it has become apparent that type 1 diabetes (T1D) is accompanied by long-term microvascular and macrovascular complications. In the context of the many benefits of continuous glucose monitoring (CGM), there remain opportunities to study the large amount of data now available in order to maximise its potential in the endeavour to reduce the occurrence of diabetes tissue complications in the longer term.
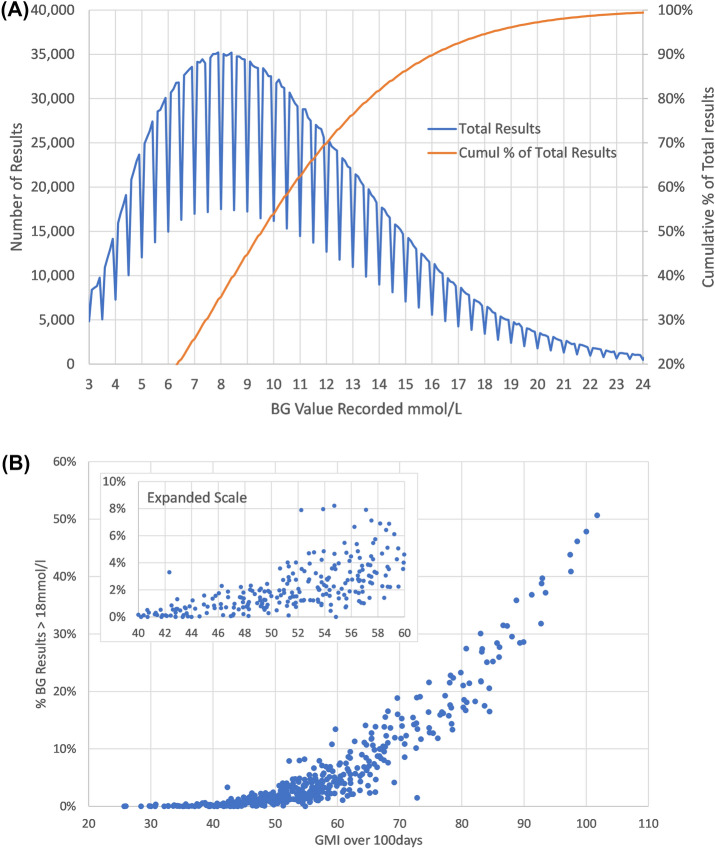
Methods: Continuous glucose monitoring values were downloaded for 89 type 1 diabetes mellitus (T1D) individuals for up to 18 months from 2021 to 2023. Data for patient demographics was also taken from the patient record which included Sex, Date of Birth, and Date of Diagnosis. The recorded laboratory glycated haemoglobin (HbA1c) test results were also recorded. The glucose management index (GMI) was calculated from average glucose readings for 18 months using the formula GMI (%) = (0.82 - (Average glucose/100)). This was then adjusted to give GMI (mmol/mol) = 10.929 * (GMI (%) - 2.15). Average Glucose Fluctuation (AGF) was calculated by adding up the total absolute change value between all recorded results over 18 months and dividing by the number of results minus one. The % Above Critical Threshold (ACT) was calculated by summing the total number of occurrences for each result value. A cumulative 95% limit was then applied to identify the glucose value that only 5% of results exceeded in the overall population. Using this value, we estimated the percentage of total tests that were above the Critical Threshold (ACT).
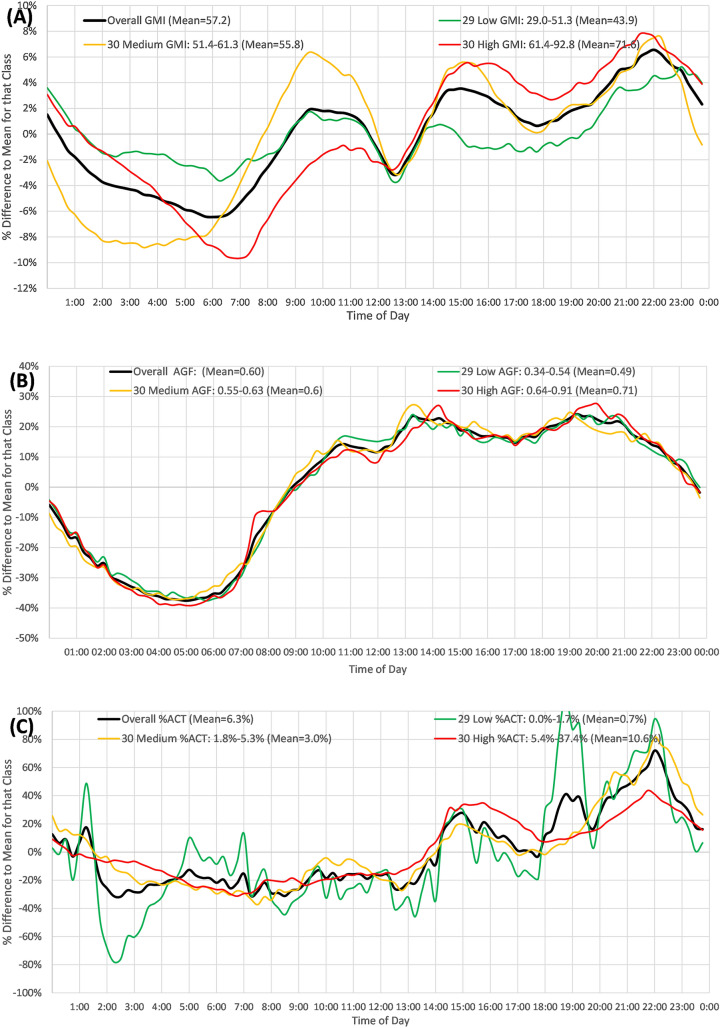
Results: The mean age of the participants was 42.6 years, and the mean duration of T1D was 18.4 years. A total of 3.22 million readings were analysed, yielding an average blood glucose level of 10.3 mmol/l and a GMI of 57.2 mmol/mol. There was a strong correlation between GMI and measured HbA1c (r2 = 0.82). However, there were patients who had an above-critical threshold (ACT) of 4-10% at a GMI of 60 mmol/mol or less. The percentage average value at the time of day (%AVTD) was applied to all blood glucose readings at each 15-min interval throughout the day, averaged over 18 months. The %AVTD of GMI (overall average 57.2 mmol/mol) increased after midday, dipped at 18:00, and peaked at 22:00. The %AVTD of AGF (overall average 0.60 mmol/l) showed higher change rates after 09:00 declining at the end of the day. The %AVTD of ACT peaked at 22:00, with those having the highest %ACT showing an additional peak at 15:00.
Conclusions: We have shown here that the percentage glucose results above 18 mmol/l (top 5% of distribution) increased exponentially above 54 mmol/mol HbA1c. The %AVTD is introduced as a useful measure. Our data indicate that over the 24-h period, improvement in metabolic control could be focussed on the afternoon and evening, when there are higher-than-average levels of GMI, a higher-than-average degree of glucose change, and higher-than-average risks of being above the critical threshold. In conclusion, a measure of glycaemic variation based on the amplitude of glucose change to a population mean could be used to provide valuable clinical insights into glucose change over a 24-h period.
Keywords: Continuous glucose monitoring; Glucose variability; Glycated haemoglobin (HbA1c); Type 1 diabetes (T1D).
© 2024. The Author(s).
Conflict of interest statement
Figures


References
-
- Deckert T, Poulsen JE, Larsen M. Prognosis of diabetics with diabetes onset before the age of thirty-one. survival, causes of death, and complications. Diabetologia. 1978;14(6):363–70. - PubMed
-
- Diabetes Control and Complications Trial Research Group, Nathan DM. The effect of intensive treatment of diabetes on the development and progression of long-term complications in insulin-dependent diabetes mellitus. N Engl J Med. 1993;329(14):977–86. - PubMed
LinkOut - more resources
Full Text Sources
