. 2024 Oct 23;260(6):124.
doi: 10.1007/s00425-024-04551-7.

Chromosome-level genome assembly and functional annotation of Citrullus colocynthis: unlocking genetic resources for drought-resilient crop development

Affiliations

Chromosome-level genome assembly and functional annotation of Citrullus colocynthis: unlocking genetic resources for drought-resilient crop development

Anestis Gkanogiannis et al. Planta. .

Abstract

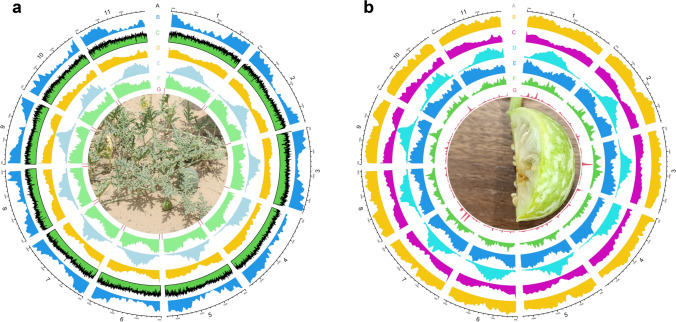
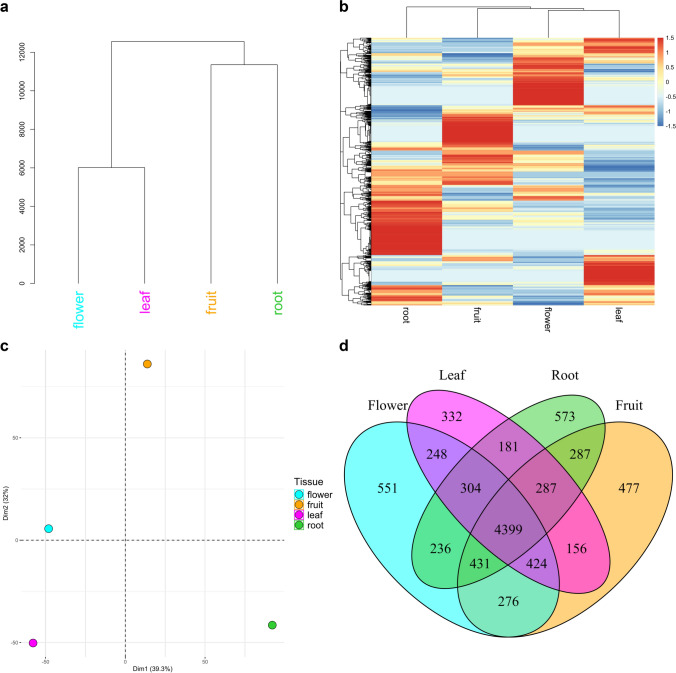
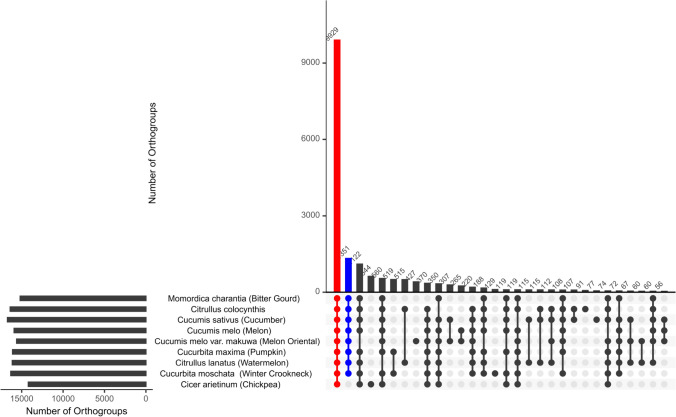
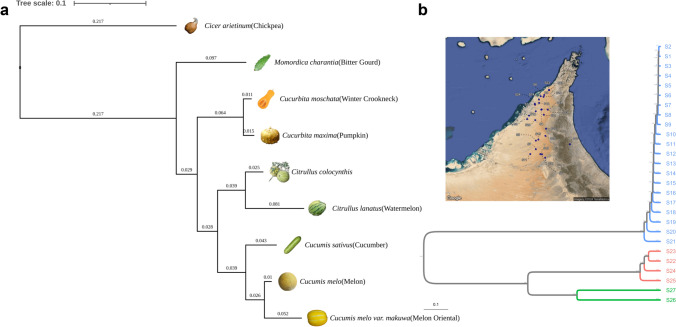
The chromosome-level genome assembly of Citrullus colocynthis reveals its genetic potential for enhancing drought tolerance, paving the way for innovative crop improvement strategies. This study presents the first comprehensive genome assembly and annotation of Citrullus colocynthis, a drought-tolerant wild close relative of cultivated watermelon, highlighting its potential for enhancing agricultural resilience to climate change. The study achieved a chromosome-level assembly using advanced sequencing technologies, including PacBio HiFi and Hi-C, revealing a genome size of approximately 366 Mb with low heterozygosity and substantial repetitive content. Our analysis identified 23,327 gene models, that could encode stress response mechanisms for species' adaptation to arid environments. Comparative genomics with closely related species illuminated the evolutionary dynamics within the Cucurbitaceae family. In addition, resequencing of 27 accessions from the United Arab Emirates (UAE) identified genetic diversity, suggesting a foundation for future breeding programs. This genomic resource opens new avenues for the de novo domestication of C. colocynthis, offering a blueprint for developing crops with enhanced drought tolerance, disease resistance, and nutritional profiles, crucial for sustaining future food security in the face of escalating climate challenges.

Keywords: Comparative genomics; Desert plant; Drought tolerance; Gene annotation; Genetic variation; Wild crop relatives.


Conflict of interest statement

The authors declare that they have no conflict of interest.

Figures

Fig. 1
Fig. 1
Circos diagrams that provides a comprehensive visualization of the chromosomal and genomic features of C. colocynthis a The outermost ring (A) displays the chromosomal karyotype. The second ring (B) illustrates the distribution of genes across the chromosomes, providing insights into gene density and localization. The third ring (C) represents the HiFi coverage of sequencing data across the chromosomes, indicating the depth of coverage for genomic regions. The fourth ring (D) highlights simple repeats, while the fifth ring (E) maps the distribution of retrotransposons, emphasizing regions with high transposable element activity. The sixth ring (F) shows low-complexity repeat elements, which are typically associated with genomic regions prone to structural variation. The innermost ring (G) marks the telomeric regions of the chromosomes, indicating the ends of linear chromosomes that protect the genome from degradation. Gene features were annotated with Funannotate (Palmer 2020), whereas repeat regions were identified with RepeatModeler (Flynn 2020) and RepeatMasker (Smit et al. 2013). b Detailed representation of repeated elements across the genome. The first track (A) displays the chromosomal karyotype. The second track (B) represents the density of unknown type repeats. The third (C), fourth (D), and fifth (E) tracks show the density of simple, retro and low-complexity repeats, respectively. The sixth track (F) represents the density of DNA type, whereas the final track (G) the density of RNA type repeats along C. colocynthis chromosomes
Fig. 2
Fig. 2
Comparative transcriptome analysis for different tissues (root, leaf, flower, fruit) of the C. colocynthis sample. a Dendrogram showing the hierarchical clustering of the four tissues, based on Euclidean distances calculated from raw gene expression counts. Tissues that are closer on the dendrogram have more similar gene expression profiles. Leaf and flower tissues cluster together, indicating similar transcriptomic profiles, while root and fruit tissues form separate clusters. b Heatmap displaying gene expression levels across the four tissues. Rows represent genes, and columns represent tissues. The color gradient from blue (low) to red (high) indicates relative expression levels. Both genes and tissues were clustered hierarchically, revealing tissue-specific expression patterns and the overall similarities and differences among the tissues. c PCA plot that visualizes the variance in gene expression across the four plant tissues. Each point represents a tissue, plotted according to its principal component scores. The plot shows clear separation among the tissues, with root and fruit being distinct from the closely related leaf and flower tissues, highlighting their differing gene expression profiles. d Venn diagram that illustrates the overlap gene sets expressed in the tissues. Each oval represents the genes expressed in one tissue. The overlaps show shared genes, with 4399 genes expressed in all tissues. The diagram also highlights unique genes in each tissue, indicating specialized functions in each tissue type
Fig. 3
Fig. 3
Intersection relationships of orthogroups (groups of orthologous genes) among C. colocynthis and seven other species from the Cucurbitales order, plus one outgroup species (chickpea). Orthogroups are defined with OrthoFinder (Emms and Kelly 2015, 2019) and their intersection and plot with UpSetR (Conway 2017). The diagram illustrates the shared and unique orthogroups among the species, providing insights into their evolutionary relationships and functional conservation
Fig. 4
Fig. 4
Phylogenetic relationship and genetic diversity a Phylogenetic tree showing the relationship between C. colocynthis and closely related species within the Cucurbitaceae family. Chickpea is used as outgroup. The rooted tree is based on orthologous gene families that were identified by OrthoFinder (Emms and Kelly 2015, 2019). It is inferred with STAG (Emms and Kelly 2018) and is rooted with STRIDE (Emms and Kelly 2017). It is shown that C. colocynthis is a close relative to C. lanatus (watermelon). b Genetic diversity and clustering of 27 C. colocynthis samples collected from different regions of the UAE, showing their narrow genetic diversity and grouping into 3 distinct clusters. The tree was constructed with the Neighbor-Joining method (Saitou and Nei 1987) by first identifying Single Nucleotide Polymorphisms (SNPs) between them, that were then used to calculate their Euclidean distance matrix in the fastreeR R package (Gkanogiannis 2023). It was finally plotted with iTOL (Letunic and Bork 2007). This analysis underpins the evolutionary dynamics and potential founder effects within the C. colocynthis populations in the UAE
Fig. 5
Fig. 5
Distribution of heterozygous Single Nucleotide Polymorphisms (SNPs) and insertion-deletion variants (INDELs) across the C. colocynthis genome. Variants were identified with GATK (Van der Auwera and O'Connor 2020) and annotated with snpEff (Cingolani et al. 2012). a Genome-wide distribution of heterozygous variants, identified in the Haplotype I assembly of C. colocynthis. The distribution highlights the density and location of these variants across the genome. b Functional impact of these variants, distinguishing between those with predicted low or negligible impact and those affecting coding sequences, introns, and regulatory regions. This analysis underscores the low overall heterozygosity of the genome, with most variants located in non-coding regions, reflecting the genetic stability of this species in its arid environment

Similar articles

References

    1. Altschul SF et al (1990) Basic local alignment search tool. J Mol Biol 215:403–410 - PubMed
    1. Al-Snafi AE (2016) Chemical constituents and pharmacological effects of Citrullus colocynthis—A review. IOSR J Pharm 6(3):57–67
    1. Ashburner M et al (2000) Gene ontology: tool for the unification of biology. Nat Genet 25:25–29. 10.1038/75556 - PMC - PubMed
    1. Assis JG et al (2000) Implications of the introgression between Citrulluscolocynthis and C. lanatus characters in the taxonomy, evolutionary dynamics and breeding of watermelon. Pl Genet Resources Newslett. 121:15–19
    1. Badr A, Zaki H (2024) Genetic diversity of Citrullus colocynthis populations using phytochemical analysis and SCoT marker variations. Genet Resour Crop Evol 71:2341–2353

LinkOut - more resources