. 2024 Oct 23;15(1):9129.
doi: 10.1038/s41467-024-53088-6.

SpliceTransformer predicts tissue-specific splicing linked to human diseases

Affiliations

SpliceTransformer predicts tissue-specific splicing linked to human diseases

Ningyuan You et al. Nat Commun. .

Abstract

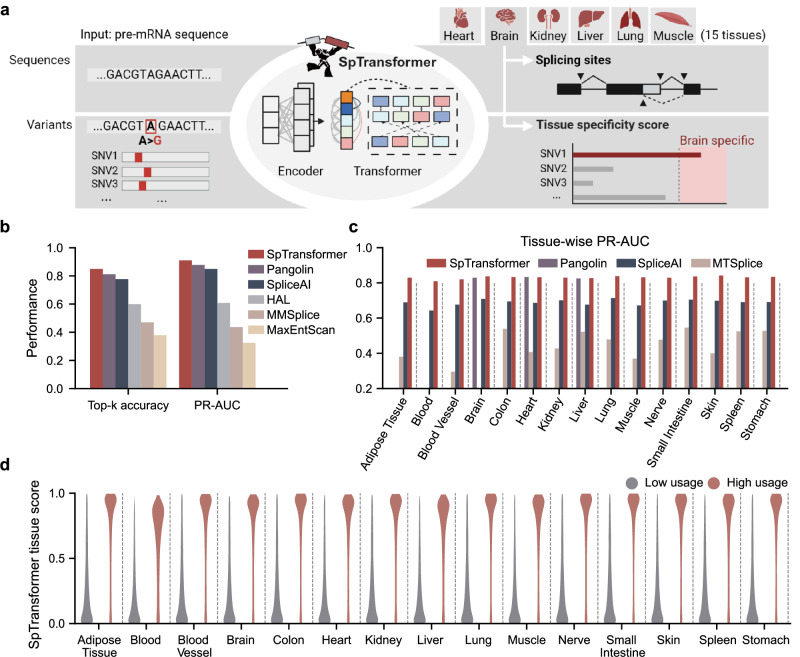
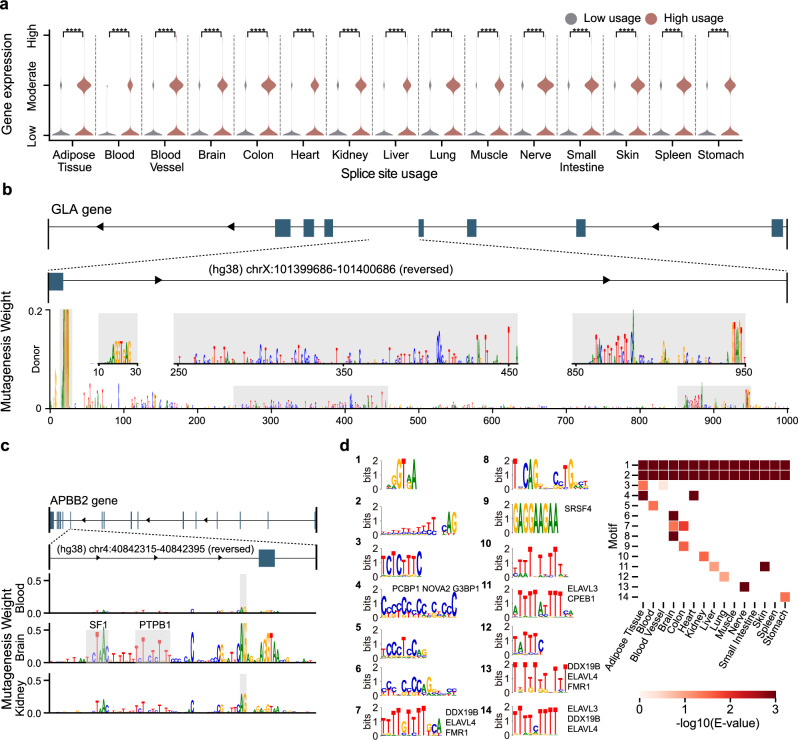
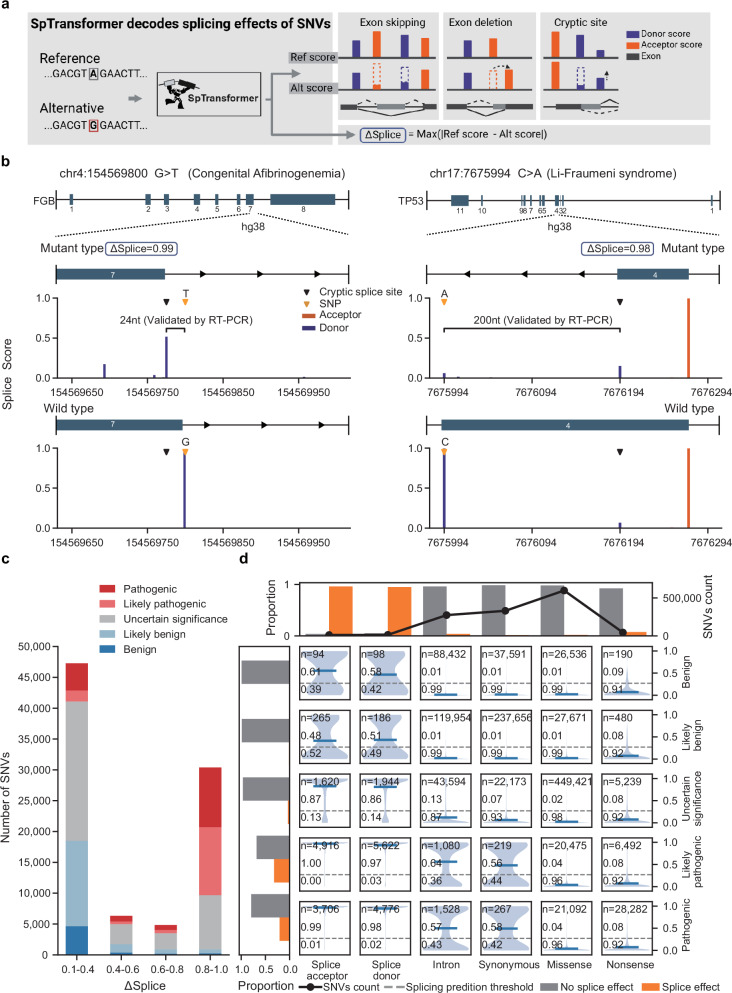
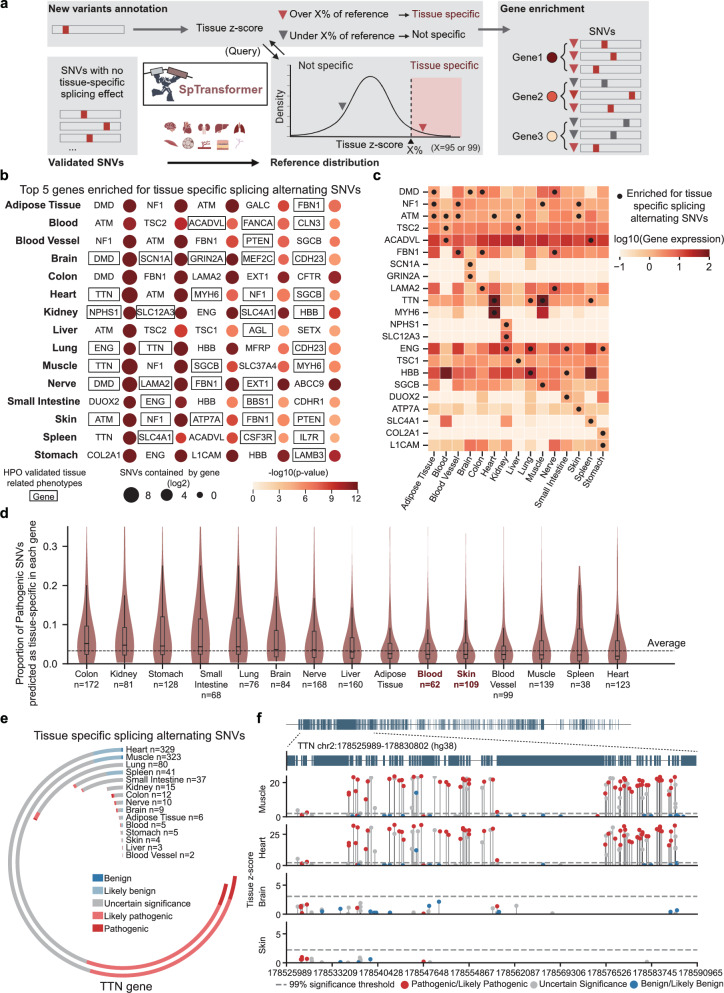
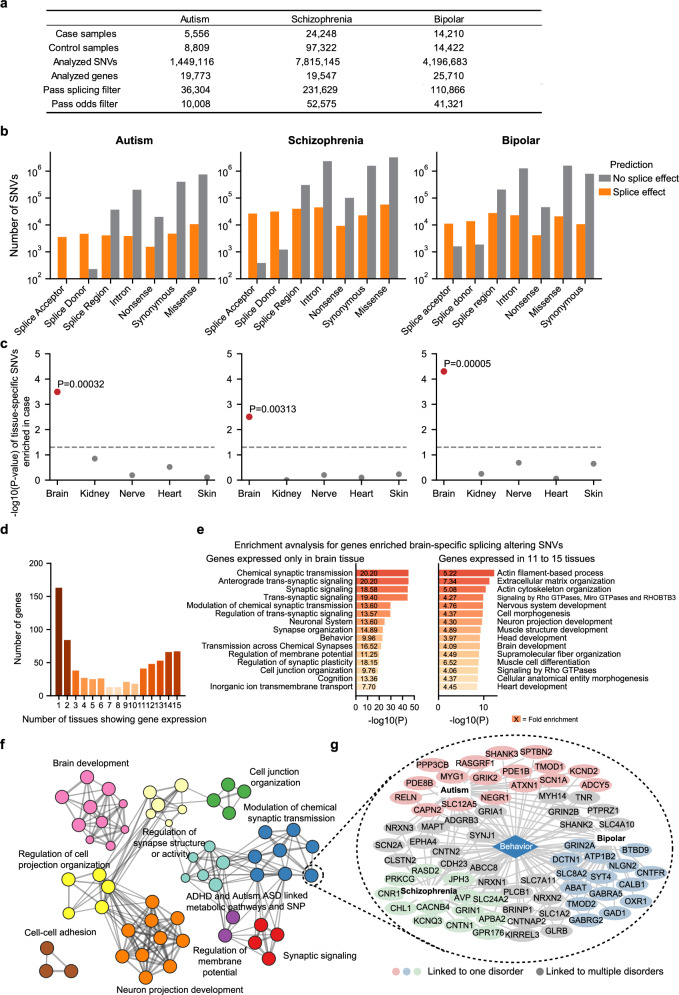
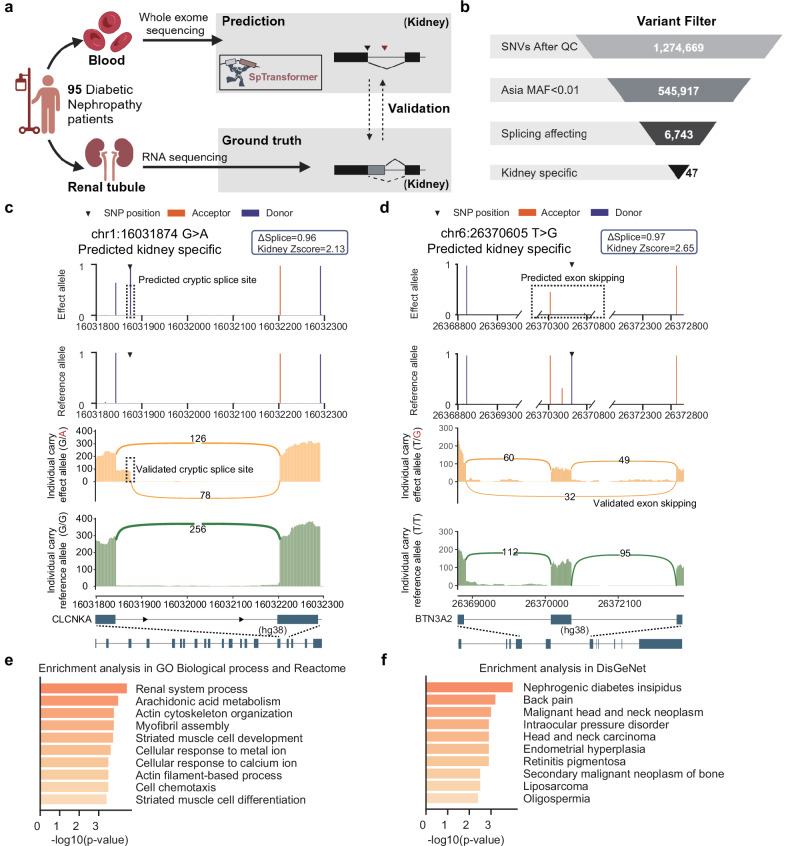
We present SpliceTransformer (SpTransformer), a deep-learning framework that predicts tissue-specific RNA splicing alterations linked to human diseases based on genomic sequence. SpTransformer outperforms all previous methods on splicing prediction. Application to approximately 1.3 million genetic variants in the ClinVar database reveals that splicing alterations account for 60% of intronic and synonymous pathogenic mutations, and occur at different frequencies across tissue types. Importantly, tissue-specific splicing alterations match their clinical manifestations independent of gene expression variation. We validate the enrichment in three brain disease datasets involving over 164,000 individuals. Additionally, we identify single nucleotide variations that cause brain-specific splicing alterations, and find disease-associated genes harboring these single nucleotide variations with distinct expression patterns involved in diverse biological processes. Finally, SpTransformer analysis of whole exon sequencing data from blood samples of patients with diabetic nephropathy predicts kidney-specific RNA splicing alterations with 83% accuracy, demonstrating the potential to infer disease-causing tissue-specific splicing events. SpTransformer provides a powerful tool to guide biological and clinical interpretations of human diseases.


Conflict of interest statement

The authors have submitted a patent application for the method. Other than this, the authors declare that they do not have any competing interests.

Figures

Fig. 1
Fig. 1. Predicting tissue-specific splicing with SpTransformer.
a The SpTransformer model takes an only sequence as input and predicts tissue-specific splicing in 15 human tissues. The model can be used to evaluate genetic variants and predict tissue-specific splicing alterations. b Performance of 6 algorithms in splice site prediction task. Top-k accuracy is calculated by choosing a threshold to make predicted positive sites and actual splice sites have the same number, then computing the fraction of correctly predicted splice sites. PR-AUC is the area under the precision-recall curve. c Tissue-usage prediction of SpTransformer in comparison with other models. d The distribution of SpTransformer prediction score for tissue usages of splice sites in the test dataset. Tissue usages were grouped into low (<0.5) and high (≥0.5) by their original usage ratio across all samples in the same tissue types. a Created with BioRender.com, was released under a Creative Commons Attribution-NonCommercial-NoDerivs 4.0 International license.
Fig. 2
Fig. 2. SpTransformer recognized sequence features related to tissue-specific splicing.
a Corresponding gene expression of tested splice sites in the test dataset, grouped by tissue usage of splice sites. The two-sided Fisher’s test revealed a significant association between tissue usage and gene expression of splice sites (“Low” vs “Moderate”/“High”. “Low”: 0–1 NAUC, “Moderate”: 1–20 NAUC, ''High'': over 20 NAUC. The NAUC is an estimation of a gene’s expression level, annotated by the ASCOT database.). Tissue usage was not totally dominated by gene expression. b Impact of in silico mutation around intron in the GLA gene. SpTransformer considers sequence features both proximal and distal to the splice donor site. Mutagenesis weight was calculated by the decrease in the predicted strength of the splice site when that nucleotide is mutated. c Impact of in silico mutation around exons in the APBB2 gene. Several known RBP motifs were found in regions of large weight. d De novo motifs that influence the tissue-usage prediction of SpTransformer (left) and their presentations in different tissues (right). The names of similar RBP motifs, as reported by MEME tools, are marked.
Fig. 3
Fig. 3. Application of splicing prediction on ClinVar database.
a SpTransformer is applied to evaluate the splicing effect of a single nucleotide variant by calculating an ΔSplice score and matching graphical representations. b Examples of two pathogenic mutations in the ClinVar database. SpTransformer successfully predicted splicing changes even far from variants (right panel). Both cases were validated by RT-PCR in previous studies c The distribution of mutations classified by clinical significance within several intervals of ΔSplice scores. As the ΔSplice score increases, the ratio of pathogenic mutations becomes larger. d Distributions of ΔSplice scores of all SNVs, grouped by both pathogenicity in ClinVar database and annotated variant type. The number of SNVs and the proportion of SNVs above/below the cutoff were annotated. The bar chart on the left aggregates the data by rows, while the bar chart at the top tabulates the data by columns. SNVs with alternative pathogenicity annotations (e.g., “conflicting interpretations”) were excluded from the analysis. a Created with BioRender.com, was released under a Creative Commons Attribution-NonCommercial-NoDerivs 4.0 International license.
Fig. 4
Fig. 4. Predicting tissue-specific splicing alterations on all ClinVar variants.
a The strategy to derive tissue specificity variants from model prediction. We created a reference set of common splicing sites to derive background distribution and calculate tissue-specific z-scores for new variants in order to make fair comparisons across tissues, and gene enrichment is calculated based on tissue-specific splice-altering SNVs. b Top five genes enriched for tissue-specific splice-altering SNVs for each of the 15 tissues as predicted by SpTransformer. The size of the bubbles represents the number of SNVs in each gene, and the color of the bubbles represents the significant level of enrichment, one-sided hypergeometric test was used for statistics. We manually examined genes associated with tissue-specific phenotypes from the HPO database and marked by a black rectangle box. c Expression pattern of top 3 genes in enrichment result of each tissue. d Proportion of pathogenic SNVs predicted as tissue-specific splice altering in different tissues. Only genes that have a p-value < 0.05 in enrichment were included. The box extends from the first quartile to the third quartile of the data, with a line at the median. The dashed line represents the median proportions of SNVs in each tissue. e Number of tissue-specific splice-altering SNVs grouped by pathogenic classifications on TTN gene in different tissues. f Genome coordinate and Tissue z-score of SNVs on a sub-region of TTN gene. SNVs are labeled with ClinVar annotation. Panel a, created with BioRender.com, was released under a Creative Commons Attribution-NonCommercial-NoDerivs 4.0 International license.
Fig. 5
Fig. 5. Brain-specific splicing alteration analysis for autism (ASD), SCZ, and BD.
a Statistical data for the three analyzed databases. b Splicing effect prediction for different variant types in the three brain disorder datasets: ASC, SCHEMA, and BipEx. c Enrichment of tissue-specific splicing alterations in ASD, SCZ, and BD across five tissues. A two-sided z-test for two groups was performed. The dashed line represents threshold powers for p = 0.05. d Number of tissues showing expression for genes filtered by brain-specific splicing altering SNVs in the case group. e Enriched GO term for genes in (d) that are expressed only in brain tissue (left) and those expressed in 11–15 tissues (right). f Network view of enriched biological processes of genes carrying brain-specific splice-altering SNVs from case group in three brain disorders. g Detailed visualization of genes enriched in GO pathway GO:0007610 “Behavior” in three brain disorders.
Fig. 6
Fig. 6. Tissue-specific splice alteration analysis for jointly profiled WES and RNA-seq data from patients with DN.
a Overview of DN patients involved and samples collected for SpTransformer prediction and RNA-seq-based validation. b Flow chart showing the filtering steps of kidney-specific splicing variants for variants called directly from WES data. c, d Examples of heterozygous variants predicted as kidney-specifically splice altering validated by matched renal tubule RNA-seq. SpTransformer prediction on WES identified variants (upper) and sashimi plot of matched RNA-seq data (lower) for CLCNKA (c) and BTN3A2 (d) gene. e Top ten GO terms enriched from genes harboring kidney-specific splicing SNVs. f Top ten terms enriched in the DisGeNet database from genes harboring kidney-specific splicing SNVs. a Created with BioRender.com, was released under a Creative Commons Attribution-NonCommercial-NoDerivs 4.0 International license.

Similar articles

Cited by

  • Generative modeling for RNA splicing predictions and design.
    Wu D, Maus N, Jha A, Yang K, Wales-McGrath BD, Jewell S, Tangiyan A, Choi P, Gardner JR, Barash Y. Wu D, et al. bioRxiv [Preprint]. 2025 Jan 24:2025.01.20.633986. doi: 10.1101/2025.01.20.633986. bioRxiv. 2025. PMID: 39896553 Free PMC article. Preprint.
  • Translating Muscle RNAseq Into the Clinic for the Diagnosis of Muscle Diseases.
    Segarra-Casas A, Domínguez-González C, Natera-de Benito D, Kapetanovic S, Hernández-Laín A, Estévez-Arias B, Llansó L, Ortez C, Jou C, Martí-Carrera I, López-Márquez A, Rodríguez MJ, González-Mera L, Nedkova V, Fernández-Torrón R, Rodríguez-Santiago B, Jimenez-Mallebrera C, Juntas-Morales R, López-de Munain A, Surrallés J, Nascimento A, Gallardo E, Olivé M, Gallano P, González-Quereda L. Segarra-Casas A, et al. Ann Clin Transl Neurol. 2025 Jul;12(7):1465-1479. doi: 10.1002/acn3.70078. Epub 2025 May 25. Ann Clin Transl Neurol. 2025. PMID: 40413734 Free PMC article.

References

    1. Tazi, J., Bakkour, N. & Stamm, S. Alternative splicing and disease. Biochim. Biophys. Acta1792, 14–26 (2009). - PMC - PubMed
    1. Wang, Z. & Burge, C. Splicing regulation: from a parts list of regulatory elements to an integrated splicing code. RNA14, 802–13 (2008). - PMC - PubMed
    1. Pagani, F. & Baralle, F. Genomic variants in exons and introns: identifying the splicing spoilers. Nat. Rev. Genet.5, 389–96 (2004). - PubMed
    1. Ahmed, M. S., Ikram, S., Bibi, N. & Mir, A. Hutchinson–Gilford progeria syndrome: a premature aging disease. Mol. Neurobiol.55, 4417–4427 (2018). - PubMed
    1. Yeo, G. & Burge, C. Maximum entropy modeling of short sequence motifs with applications to rna splicing signals. J. Comput. Biol.11, 377–94 (2004). - PubMed

Publication types

LinkOut - more resources