. 2024 Oct 23;15(1):9143.
doi: 10.1038/s41467-024-53112-9.

Dominant immune tolerance in the intestinal tract imposed by RelB-dependent migratory dendritic cells regulates protective type 2 immunity

Affiliations

Dominant immune tolerance in the intestinal tract imposed by RelB-dependent migratory dendritic cells regulates protective type 2 immunity

Anna-Lena Geiselhöringer et al. Nat Commun. .

Abstract

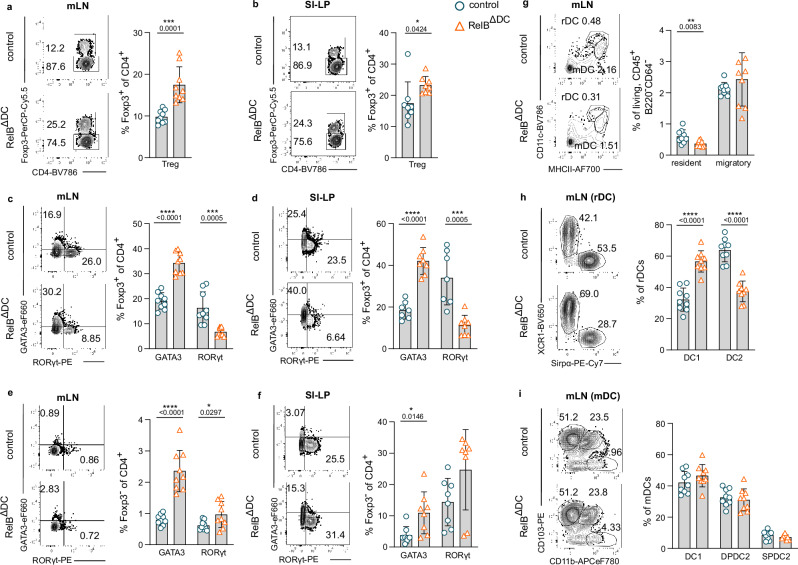
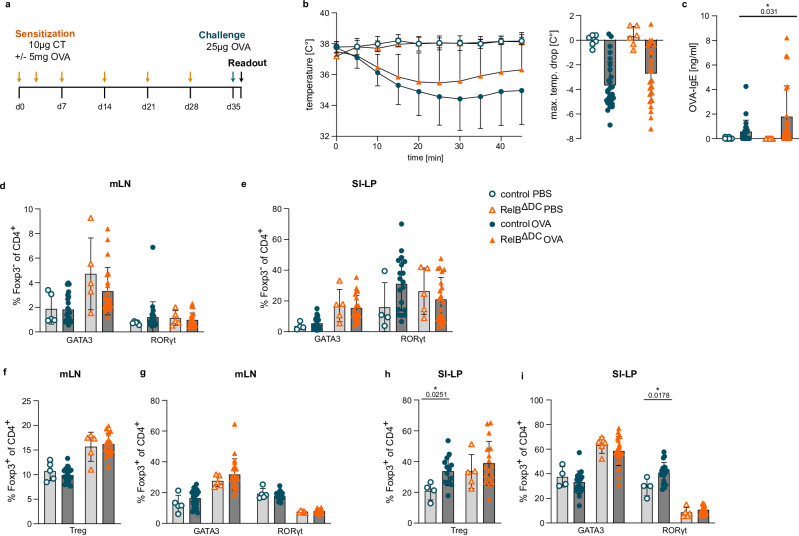
Dendritic cells (DCs) are crucial for initiating protective immune responses and have also been implicated in the generation and regulation of Foxp3+ regulatory T cells (Treg cells). Here, we show that in the lamina propria of the small intestine, the alternative NF-κB family member RelB is necessary for the differentiation of cryptopatch and isolated lymphoid follicle-associated DCs (CIA-DCs). Moreover, single-cell RNA sequencing reveals a RelB-dependent signature in migratory DCs in mesenteric lymph nodes favoring DC-Treg cell interaction including elevated expression and release of the chemokine CCL22 from RelB-deficient conventional DCs (cDCs). In line with the key role of CCL22 to facilitate DC-Treg cell interaction, RelB-deficient DCs have a selective advantage to interact with Treg cells in an antigen-specific manner. In addition, DC-specific RelB knockout animals show increased total Foxp3+ Treg cell numbers irrespective of inflammatory status. Consequently, DC-specific RelB knockout animals fail to mount protective Th2-dominated immune responses in the intestine after infection with Heligmosomoides polygyrus bakeri. Thus, RelB expression in cDCs acts as a rheostat to establish a tolerogenic set point that is maintained even during strong type 2 immune conditions and thereby is a key regulator of intestinal homeostasis.


Conflict of interest statement

The authors declare no competing interests.

Figures

Fig. 1
Fig. 1. RelB deficiency in CD11c+ cells results in a reduction of resident cDC2s in gut-draining mesenteric lymph nodes and elevated GATA3+ T and Treg cells.
af Flow cytometric analysis of T cell populations in mesenteric lymph nodes (mLN) and the lamina propria of the small intestine (SI-LP) of control and RelBΔDC mice at steady-state. a, b Representative flow cytometry plots (left) and quantification (right) of frequency of Foxp3+ Treg cells among CD4+ T cells in mLN (a control n = 9, RelBΔDC n = 9) and SI-LP (b control n = 8, RelBΔDC n = 8). c, d Representative flow cytometry plots (left) and quantification (right) of frequency of GATA3- and RORγt-expressing Foxp3+ Treg cells in mLN (c control n = 9, RelBΔDC n = 9) and SI-LP (d control n = 7, RelBΔDC n = 8). e, f Representative contour plots (left) and quantification (right) of frequency of GATA3 and RORγt expression in Foxp3 CD4+ Th cells in mLN (e, control n = 9, RelBΔDC n = 9) and SI-LP (f control n = 8, RelBΔDC n = 8). gi Flow cytometric analysis of dendritic cell populations in mLN of control and RelBΔDC mice at steady-state. g Representative contour plots (left) of resident cDCs (rDCs; live deadCD45+B220CD64CD11chighMHCIIint) and migratory cDCs (mDCs; live deadCD45+B220CD64CD11cintMHCIIhigh) (left) and quantification of indicated frequencies (right) in mLN at steady-state (control n = 9, RelBΔDC n = 9). h Representative contour plots (left) of resident DCs subsets (rDC1: XCR1+Sirpα; rDC2: XCR1+Sirpα+) and frequencies (right) in mLN (control n = 9, RelBΔDC n = 9). i Representative contour plots (left) of migratory DC subsets (mDC1: CD103+CD11b double-positive DCs (DPDC2): CD103+CD11b+; single-positive DCs (SPDC2): CD103CD11b+) and frequencies (right) in mLN (control n = 9, RelBΔDC n = 9). Each dot represents an individual mouse and mean ± SD from two independent experiments is shown. Statistical analysis was performed using two-tailed students t-test. P value of <0.05 was considered statistically significant with *p < 0.05, **p < 0.01, ***p < 0.001, ****p < 0.0001. Source data are provided as a Source Data file.
Fig. 2
Fig. 2. RelB is crucial for the differentiation of CIA-DCs in the lamina propria.
a UMAP projection of scRNAseq gene expression profiling from CD11c+MHCIIhigh DCs (among live/deadCD45+B220CD64) sorted from the lamina propria of the small intestine (SI-LP) of steady-state control (left) and RelBΔDC (right) mice. b Comparison of CIA-DC signature genes across clusters identified in (a). c Representative flow cytometry plots of Plet1+CD103 DCs (cryptopatch and isolated lymphoid follicle-associated DCs; CIA-DCs) in SI-LP of control and RelBΔDC mice at steady-state (left), quantification of frequencies (middle) and total cell numbers (right) (control n = 5, RelBΔDC n = 5). di Flow cytometric analysis of T cell populations in mesenteric lymph node (mLN) and SI-LP of control and LtbRΔDC mice at steady-state. d, e Representative flow cytometry plots (left) and quantification (right) of Foxp3+ Treg cell frequencies among CD4+ T cells in mLN (d, control n = 6, LtbRΔDC n = 7) and SI-LP (e control n = 3, LtbRΔDC n = 4). f, g Representative flow cytometry plots (left) and quantification of frequencies (right) of GATA3- and RORγt-expressing Foxp3+ Treg cells in mLN (f control n = 6, LtbRΔDC n = 7) and SI-LP (g control n = 3, LtbRΔDC n = 4). h, i Representative contour plots (left) and quantification of frequencies (right) for GATA3 and RORγt expression among Foxp3CD4+ Th cells in mLN (h control n = 6, LtbRΔDC n = 7) and SI-LP (i control n = 3, LtbRΔDC n = 4). scRNAseq experiments were performed from sort-purified DCs pooled from three individual mice per genotype. Each dot represents an individual mouse and mean ± SD of two independent experiments is shown. Statistical analysis was performed using two-tailed students t-test. P value of <0.05 was considered statistically significant with *p < 0.05, **p < 0.01, ***p < 0.001, ****p < 0.0001, n.s. not significant. Source data are provided as a Source Data file.
Fig. 3
Fig. 3. RelB regulates gene expression of migratory DCs in the mesenteric lymph node.
a UMAP projection of scRNAseq gene expression profiling from CD11c+MHCIIhi DCs (among live/deadCD45+B220CD64) sorted from mesenteric lymph node (mLN) of naïve control (left) and RelBΔDC (right) mice. b Volcano plot of differentially expressed genes comparing ArcZeb2+ migratory DCs from cluster 2 (control) and cluster 1 (RelBΔDC). c Volcano plot of differentially expressed genes comparing Arc+Zeb2 migratory DCs from cluster 7 (control) and cluster 8 (RelBΔDC). d Heatmap depicting a RelB-dependent core signature in CCR7+ DCs in mLN. e Levels of Ccl22, Ccl17, and IL-6 in supernatant of CD11c-enriched cells cultured for 16 h in the absence of any stimulation (control n = 6, RelBΔDC n = 5). f, g Representative cluster formation (phase contrast) and fluorescence images (Treg cells: red; non-Treg cells: green) (left) and quantification (right) 270 min (f control n = 4, RelBΔDC n = 4) and 360 min (g control n = 4, RelBΔDC n = 4) after coculture. h Expression of CD200 (left, control n = 5, RelBΔDC n = 4) and CD63 (right, control n = 6, RelBΔDC n = 4) in resident and migratory DCs defined in Fig. 1 from mLN of control and RelBΔDC mice. i, j Representative contour plots (left) and quantification (right) showing the expression of CD117 in total mLN DCs (i) and resident and migratory DCs and their respective subsets j from control and RelBΔDC mice at steady-state (control n = 8, RelBΔDC n = 5). scRNAseq experiments were performed from sort-purified DCs pooled from three individual mice per genotype. Each dot represents an individual mouse and mean ± SD of one representative experiment (ah) or two independent experiments (i, j) is shown. Statistical analysis was performed using two-tailed students t-test. P value of <0.05 was considered statistically significant with *p < 0.05, **p < 0.01, ***p < 0.001, ****p < 0.0001. Source data are provided as a Source Data file.
Fig. 4
Fig. 4. RelBΔDC mice do not show stronger anaphylaxis in a model of food allergy.
a Experimental scheme of a food allergy regime with OVA as a model antigen for sensitization. CT cholera toxin, OVA chicken ovalbumin. b Core body temperature drop (left) and maximal temperature drop (right) after challenge with OVA on day 35 in control and RelBΔDC mice (control (PBS) n = 6, RelBΔDC (PBS) n = 6, control (OVA) n = 27 and RelBΔDC (OVA) n = 21/25). c OVA-specific IgE levels in serum in food allergic control and RelBΔDC mice on day 36 (control before n = 34, RelBΔDC before n = 33, control (OVA) n = 24 and RelBΔDC (OVA) n = 22). d, e Quantification of intracellular GATA3 and RORγt expression in Foxp3 CD4+ Th cells of food allergic mice in mesenteric lymph node (mLN) (d control (PBS) n = 5, RelBΔDC (PBS) n = 5, control (OVA) n = 25 and RelBΔDC (OVA) n = 22) and lamina propria of the small intestine (SI-LP) (e control (PBS) n = 4, RelBΔDC (PBS) n = 5, control (OVA) n = 19 and RelBΔDC (OVA) n = 22). f, g Quantification of Foxp3+ CD4+ T cells (f control (PBS) n = 5, RelBΔDC (PBS) n = 5, control (OVA) n = 20 and RelBΔDC (OVA) n = 17) and intracellular GATA3 and RORγt expression in Foxp3+ CD4+ Tregs (g control (PBS) n = 5, RelBΔDC (PBS) n = 5, control (OVA) n = 25/20 and RelBΔDC (OVA) n = 22/17) in mLN of food allergic animals. h, i Quantification of Foxp3+ CD4+ T cells (h control (PBS) n = 4, RelBΔDC (PBS) n = 5, control (OVA) n = 14 and RelBΔDC (OVA) n = 17) and intracellular GATA3 and RORγt expression in Foxp3+ CD4+ Tregs (i control (PBS) n = 4, RelBΔDC (PBS) n = 5, control (OVA) n = 19 and RelBΔDC (OVA) n = 22) in SI-LP of food allergic animals. Each dot represents an individual mouse and mean ± SD from two to four independent experiments is shown. Statistical analysis was performed using two-tailed students t-test. P value of <0.05 was considered statistically significant with *p < 0.05, **p < 0.01, ***p < 0.001, ****p < 0.0001. Source data are provided as a Source Data file.
Fig. 5
Fig. 5. RelBΔDC mice show impaired Th2 effector cell differentiation and parasite clearance after Hpb infection.
a Experimental scheme of primary Heligmosomoides polygyrus bakeri (Hpb) infection and Hpb re-infection (secondary infection) regimen. b, c Intestinal worm counts after primary (day 21, panel b, control (primary Hpb infection) n = 10 and RelBΔDC (primary Hpb infection) n = 13) and secondary (day 63, panel c, control (secondary Hpb infection) n = 12 and RelBΔDC (secondary Hpb infection) n = 13) Hpb infection of control and RelBΔDC mice. d Representative H&E staining of small intestinal tissue sections after secondary Hpb infection. Arrows indicate detected granulomas. e Representative flow cytometry plots (left) and quantification (right) of intracellular GATA3 and RORγt expression among Foxp3 CD4+ Th cells from mesenteric lymph node (mLN) of control and RelBΔDC mice at steady-state, primary and secondary Hpb infection. Control (steady-state) n = 9, control (primary Hpb infection) n = 10, and control (secondary Hpb infection) n = 12. RelBΔDC (steady-state) n = 9, RelBΔDC (primary Hpb infection) n = 13, and RelBΔDC (secondary Hpb infection) n = 13. f Representative flow cytometry plots of intracellular IL-4 and IL-10 expression (left) and quantification (right) of cytokine expression of Foxp3 Treg cells in mLN after secondary Hpb infection control (secondary Hpb infection) n = 7 and RelBΔDC (secondary Hpb infection) n = 7). g Quantification of percentage of resident (rDCs) and migratory (mDCs) cDCs (upper panel), resident DC1s and resident DC2s (lower left panel) as well as migratory DC1s, double-positive DCs (DPDC2) and single-positive DCs (SPDC2) (lower right panel) in mLN at steady-state, after primary and secondary Hpb infection. Control (steady-state) n = 9, control (primary Hpb infection) n = 11, and control (secondary Hpb infection) n = 12. RelBΔDC (steady-state) n = 9, RelBΔDC (primary Hpb infection n = 13, and RelBΔDC (secondary Hpb infection) n = 13. Each dot represents an individual mouse and mean ± SD from at least two independent experiments is shown. Statistical analysis was performed using two-tailed students t-test (b, c, f) or one-way ANOVA with Tukey correction for multiple comparison (e, g). P value of <0.05 was considered statistically significant with *p < 0.05, **p < 0.01, ***p < 0.001, ****p < 0.0001. Source data are provided as a Source Data file.
Fig. 6
Fig. 6. Dominant immune tolerance results in reduced parasite clearance in RelBΔDC mice.
a UMAP projection of scRNAseq gene expression profiling from CD11c+MHCIIhi cells (among live/deadCD45+ B220CD64) sorted from mesenteric lymph node (mLN) of control and RelBΔDC mice 4 days and 14 days after Heligmosomoides polygyrus bakeri (Hpb) infection. b Percentage distribution of DC clusters from the data of Fig. 2c (steady-state), day 4 and day 14 after Hpb infection (a). Levels of Ccl22 (c), Ccl17(d), and IL-6 (e) in supernatant of CD11c-enriched cells from mLN of control and RelBΔDC mice after 16 h stimulation with LPS, or GM-CSF or Hpb extract (control n = 6, RelBΔDC n = 5). f Experimental scheme of secondary Hpb combined with anti-CD25 antibody/isotype control antibody treatment. g Percentage of GATA3+ of Foxp3 CD4+ T cells in blood at indicated timepoints before and after Hpb infection. h Representative H&E staining of histology slides after secondary Hpb infection ± anti-CD25/isotype control antibody treatment. Arrows indicate detected granulomas and are representative of 4 control, 5 RelBΔDC mice and 5 RelBΔDC ± anti-CD25/isotype-treated individual mice from one experiment. i Intestinal worm counts on day 63 after secondary Hpb infection of control and RelBΔDC mice ± anti-CD25/isotype control antibody treatment. j Quantification of Foxp3+ CD4+ Tregs in mLN after secondary Hpb infection ± anti-CD25/isotype control antibody treatment. Each dot represents an individual mouse and mean ± SD from one (gj) or two independent experiments (ce) is shown. control n = 4, RelBΔDC n = 5, RelBΔDC (αCD25) n = 5, RelBΔDC (isotype) n = 5. Statistical analysis was performed using two-tailed students t-test (ce). For g, RelBΔDC mice were compared to anti-CD25 treated RelBΔDC mice with two-tailed students t-test. One-way ANOVA with Tukey correction for multiple comparison was used for (i, j). P value of <0.05 was considered statistically significant with *p < 0.05, **p < 0.01, ***p < 0.001, ****p < 0.0001. Source data are provided as a Source Data file.

References

    1. Gause, W. C., Rothlin, C. & Loke, P. Heterogeneity in the initiation, development and function of type 2 immunity. Nat. Rev. Immunol.20, 603–614 (2020). - PMC - PubMed
    1. Kim, K. S. et al. Dietary antigens limit mucosal immunity by inducing regulatory T cells in the small intestine. Science351, 858–863 (2016). - PubMed
    1. Arpaia, N. et al. Metabolites produced by commensal bacteria promote peripheral regulatory T-cell generation. Nature504, 451–455 (2013). - PMC - PubMed
    1. Ohnmacht, C. et al. MUCOSAL IMMUNOLOGY. The microbiota regulates type 2 immunity through RORgammat(+) T cells. Science349, 989–993 (2015). - PubMed
    1. Josefowicz, S. Z. et al. Extrathymically generated regulatory T cells control mucosal TH2 inflammation. Nature482, 395–399 (2012). - PMC - PubMed

Publication types

MeSH terms

Associated data

LinkOut - more resources