. 2024 Oct 23;15(1):8996.
doi: 10.1038/s41467-024-53214-4.

Chemical inhibition of stomatal differentiation by perturbation of the master-regulatory bHLH heterodimer via an ACT-Like domain

Affiliations

Chemical inhibition of stomatal differentiation by perturbation of the master-regulatory bHLH heterodimer via an ACT-Like domain

Ayami Nakagawa et al. Nat Commun. .

Abstract

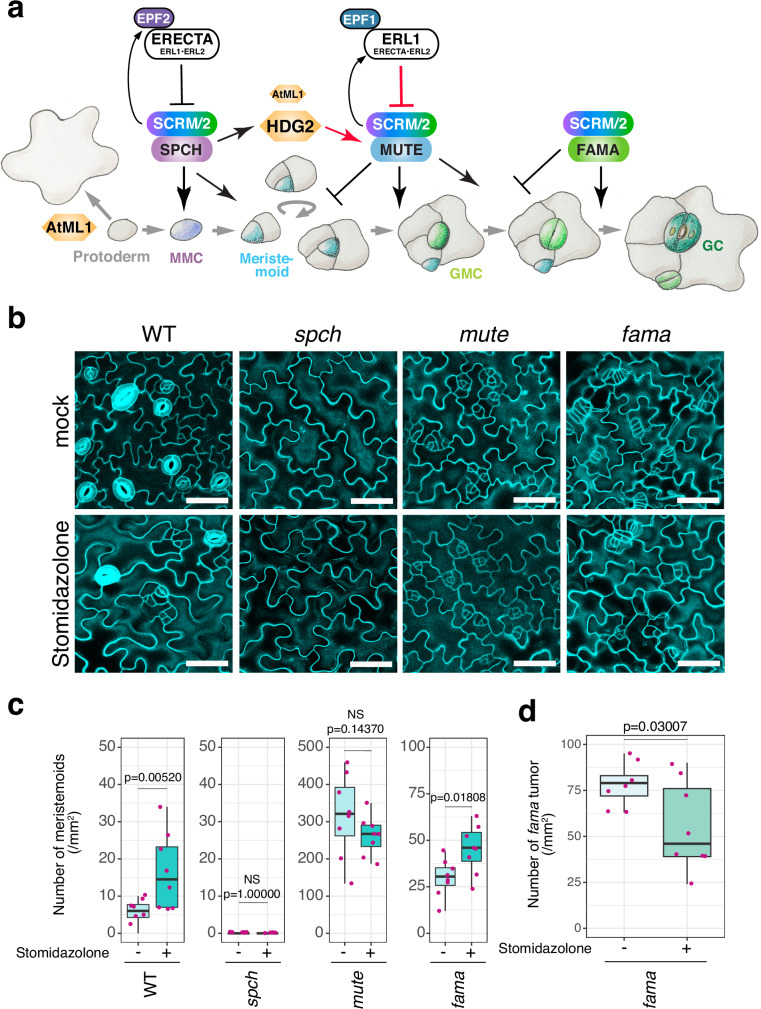
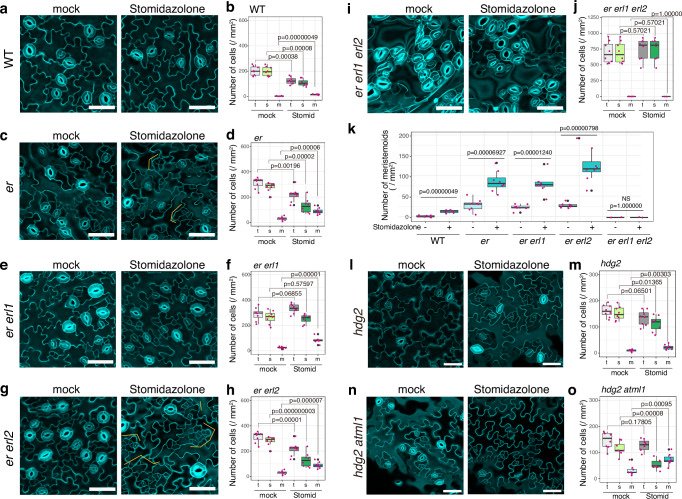
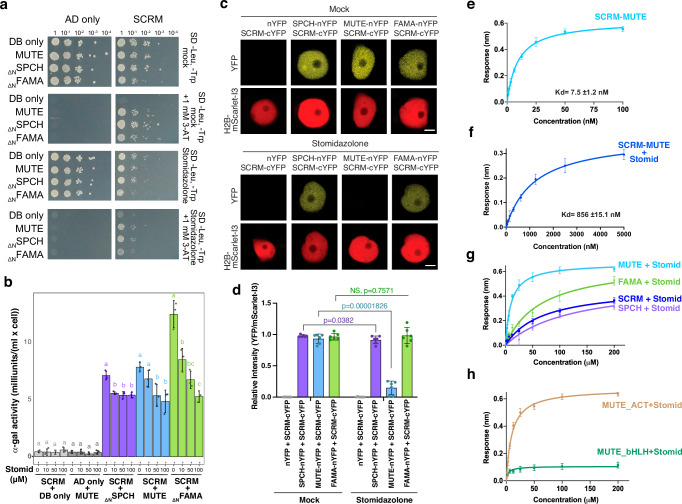
Selective perturbation of protein interactions with chemical compounds enables dissection and control of developmental processes. Differentiation of stomata, cellular valves vital for plant growth and survival, is specified by the basic-helix-loop-helix (bHLH) heterodimers. Harnessing a new amination reaction, we here report a synthesis, derivatization, target identification, and mode of action of an atypical doubly-sulfonylated imidazolone, Stomidazolone, which triggers stomatal stem cell arrest. Our forward chemical genetics followed by biophysical analyses elucidates that Stomidazolone directly binds to the C-terminal ACT-Like (ACTL) domain of MUTE, a master regulator of stomatal differentiation, and perturbs its heterodimerization with a partner bHLH, SCREAM in vitro and in plant cells. On the other hand, Stomidazolone analogs that are biologically inactive do not bind to MUTE or disrupt the SCREAM-MUTE heterodimers. Guided by structural docking modeling, we rationally design MUTE with reduced Stomidazolone binding. These engineered MUTE proteins are fully functional and confer Stomidazolone resistance in vivo. Our study identifies doubly-sulfonylated imidazolone as a direct inhibitor of the stomatal master regulator, further expanding the chemical space for perturbing bHLH-ACTL proteins to manipulate plant development.


Conflict of interest statement

The authors declare no competing interests.

Figures

Fig. 1
Fig. 1. Stomidazolone is a potent chemical for meristemoid arrest.
a Schematics of chemical synthesis. Supplementary Data 1 for the details of the synthesis. Bottom right, structure of Stomidazolone (ID: AYSJ929, compound 3). b X-ray crystal structure of Stomidazolone shown as a stick model (White, H; Beige, C; Blue, N; Yellow, S; Red, O). c Confocal microscopy images of representative cotyledon abaxial epidermis from Arabidopsis wild-type (WT) seedlings 9-days-after germination (dag) grown in the presence of 0 (mock), 20, 50, and 100 μM Stomidazolone. Orange brackets, stomatal-lineage cells with an arrested meristemoid in the center. Scale bars, 50 μm. d Arrested meristemoids by Stomidazolone express proper meristemoid markers. Shown are confocal microscope images of 9-dag representative abaxial cotyledons epidermis expressing TMMpro::GUS-GFP (top) and MUTEpro::nucYFP (bottom) grown in the presence of 0 (mock: Left) and 50 μM Stomidazolone (Right). Scale bars, 50 μm (e) Stomidazolone treatment reduces the number of stomata but increases that of meristemoids. Quantitative analysis of stomatal (s; green), meristemoid (m; cyan), and stomata+meristemoid (t; gray) density per mm2 of cotyledon abaxial epidermis from seedlings grown in the presence of 0 (mock), 20, 50, and 100 μM Stomidazolone. One-way ANOVA followed by Tukey’s HSD analysis were performed for each cell type (stomata and meristemoids). Letters (a, b, c) indicate groups that are statistically different from other groups within each cell type. See “Methods” for the definition of the boxplots. See Source Data for the exact p values. n = 8 (f) Stomidazolone does not impact seedling growth. Shown are two representative 9-dag WT seedlings, grown in the presence of 0 (mock), 20, 50, and 100 μM Stomidazolone. Scale bars, 10 mm.
Fig. 2
Fig. 2. Identification of biologically inactive Stomidazolone analogs.
a Chemical structures of Stomidazolone (3) and its derivatives AYSJ1059 (5) and AYSJ1061 (6). See Supplementary Data 1 for detailed procedures of synthesis and analysis. b Representative confocal images of cotyledon abaxial epidermis from seedlings 9-days-after-germination grown with mock, or 50 μM Stomidazolone, or its derivatives grown on liquid culture medium. Scale bars, 50 μm. c Quantitative analysis. Number of stomata per 1 mm2 of cotyledon abaxial epidermis from seedlings grown in the presence of mock or 50 μM Stomidazolone and its derivatives. Two-tailed Student’s T test was performed, and p values are indicated. ***, p < 0.0005. See “Methods” for the definition of the boxplots. n = 8.
Fig. 3
Fig. 3. spch and mute, but not fama, are epistatic to Stomidazolone.
a Schematic diagram showing the genetic control of stomatal cell-state transitions. Key genes/gene products and their roles are indicated in the cartoon. See main text for details of each step. Arrows, positive regulation; T-bars, negative regulation. Upregulation of MUTE by HDG2 and inhibition of MUTE by ERL1 are highlighted in red. MMC, meristemoid mother cell; GMC, guard mother cell; GC, guard cell. Cartoons modified from Han and Torii (2016). b Representative cotyledon abaxial epidermis of mock and 50 μM Stomidazolone-treated WT, spch (spch-3), mute (mute-1), and fama. Scale bars, 50 μm. c, d Quantitative analysis of meristemoids density per 1 mm2 (c) and fama tumors (d) of cotyledon abaxial epidermis from seedlings grown in the presence of 0 (mock) and 50 μM Stomidazolone. Two-tailed Student’s T test was performed for each plant. p values and NS (not significant) are indicated above each boxplot. See “Methods” for the definition of the boxplots. n = 8.
Fig. 4
Fig. 4. Stomidazolone is a potent inhibitor of cell-state transition at the MUTE-step.
aj Effects of Stomidazolone on the epidermis of wild-type (WT: a, b), er (c, d), er erl1 (e, f), er erl2 (g, h), and er erl1 erl2 (i, j). Representative cotyledon abaxial epidermis of mock- (left) and 50 μM Stomidazolone (right). Orange brackets, clusters of arrested meristemoids. Scale bars, 50 μm. (b, d, f, h, j) Quantitative analysis of stomatal (s; green), meristemoid (m; cyan), and stomata+meristemoid (t; gray) density per mm2 of cotyledon abaxial epidermis from seedlings grown in the presence of 0 (mock) and 50 μM Stomidazolone (Stomid). Two-tailed Student’s T test was performed for each plant. p values are indicated above each boxplot. See “Methods” for the definition of the boxplots. n = 8. k Number of meristemods, data replotted from other panels. Two-tailed Student’s T test was performed for each plant. p values are indicated above each boxplot. See “Methods” for the definition of the boxplots. n = 8. lo Effects of Stomidazolone on the epidermis of hdg2 (hdg2-2: l, m) and hdg2 atml1 (hdg2-2 atml1-3: n, o). All experiments and analyses were performed as described above. Scale bars, 50 μm. n = 8.
Fig. 5
Fig. 5. SCRM activity dictates in vivo potency and selectivity of Stomidazolone.
a, c, e, g, i Abaxial epidermis of cotyledons in wild-type (WT: a), scrm (ice1-2: c), scrm2-1 (e), scrm scrm2-1 (g), and scrm-D (e) 9-dag seedlings treated with mock or 50 μM Stomidazolone. scrm loss-of-function mutants occasionally exhibit parallelly paired-stomata, so called ‘four-lips’ phenotype (orange plus) as well as stomata made with an extra guard cell (orange asterisk) likely due to FAMA mis-regulation. Scale bars, 50 μm. b, d, f, h, j Stomatal index (SI, %) for mock- or Stomidazolone-treated (Stomid) WT (b), scrm (d), scrm2-1 (f), scrm scrm2-1 (h), and scrm-D (j). See “Methods” for the definition of the boxplots. n = 8. (n = 7 for scrm scrm2-1 (h)). Two-tailed Student’s T-test was performed for pairwise comparison. k, m, o Abaxial epidermis of cotyledons in WT (k) and the intragenic scrm-D suppressors: scrm-D_S343 (m) and scrm_D_S423 (o) 9-dag seedlings treated with mock or 50 μM Stomidazolone. Clustered meristemoids and their sister stomatal-lineage ground cells (SLGCs: orange brackets) become exaggerated. Scale bars, 50 μm. Experiments were repeated twice. l, n, p Stomatal and small cell (SC) index (%) for Mock- or Stomidazolone-treated (Stomid) WT (l), scrm-D_S343 (n) and scrm_D_S423 (p). See “Methods” for the definition of the boxplots. n = 8. Two-tailed Student’s T-test was performed for pairwise comparisons. Experiments were repeated three times. q, r Abaxial epidermis of cotyledons in the intragenic scrm-D suppressors in the absence of SCRM2: scrm-D_S343 scrm2-1 (q) and scrm_D_S423 scrm2-1 (r) 9-dag seedlings treated with mock or 50 μM Stomidazolone. Experiments were repeated three times. Scale bars, 20 μm.
Fig. 6
Fig. 6. Stomidazolone primarily disrupts SCRM-MUTE heterodimers through direct binding.
a Y2H analysis. Yeasts expressing control and pairs of stomatal bHLH proteins were spotted in 10-fold serial dilutions on appropriate selection media with or without 50 μM Stomidazolone. 1 mM 3-AT treatment shows that Stomidazolone reduces the interactions of SCRM with stomatal bHLH proteins. 3-AT, 3-amino-1,2,4-triazole. b Quantitative α-galactosidase assays. Yeasts expressing control and pairs of stomatal bHLH proteins were cultured in 0, 10, 50, and 100 μM Stomidazolone and enzyme assays were performed. Values indicate mean ± SD. One-way ANOVA followed by Tukey’s HSD analysis were performed. Letters (a, b, c) indicate that the enzyme activities are statistically different within the group. See Source Data for the exact p values. Experiments were repeated 3 times. c Ratiometric BiFC analysis. N. benthamiana leaves were infiltrated with Histone H2B (H2B)-mScarlet-I3 and pairs of stomatal bHLH proteins. Subsequently, leaf disks were treated either with mock (top) or 100 μM Stomidazolone (bottom). Shown is a representative nucleus from each combination imaged simultaneously for mScarlet-I3 (control) and YFP (interaction) signals. Scale bars, 5 μm. Experiments were repeated three times. Values indicate mean ± SD. d Quantitative analysis of BiFC YFP signal intensity ratio normalized by the signal intensity of H2B-mScarlet-I3. Two-tailed Student T-test was performed for each pairwise comparison. NS, not significant. n = 6. Experiments were repeated three times. e, f Quantitative analysis of SCRM-MUTE interactions in the absence (e), and presence (f) of Stomidazolone. In vitro binding response curves are provided for SCRM with MUTE and with/without Stomidazolone. The data represent the mean ± SD and are representative of two independent experiments. g Quantitative analysis of Stomidazolone binding with SCRM (blue), MUTE (cyan), FAMA (green), and SPCH (lavender). The MUTE protein exhibit higher affinity to Stomidazolone. In vitro binding response curves are provided Stomidazolone with SCRM/MUTE/SPCH/MUTE/FAMA. The data represent the mean ± SD and are representative of two independent experiments. h Quantitative analysis of Stomidazolone binding with MUTE bHLH (green) and ACTL (brown) domains. In vitro binding response curves are provided for Stomidazolone with MUTEbHLH and MUTEACTL. The data represent the mean ± SD and are representative of two independent experiments.
Fig. 7
Fig. 7. Engineering Stomidazolone-resistant plants based on the MUTE-Stomidazolone docking model.
a, b MUTE-Stomidazolone binding models. a Alphafold2 predicted full-length MUTE protein is shown as ribbon representation. MUTE bHLH domain, green; ACTL domain, peach; Linker region, red. Stomidazolone is shown as stick model (gray). b Magnified view of MUTE-Stomidazolone binding interface. The key binding residues (R133, R134, E162 and E163) sidechains are highlighted in magenta. (c) Quantitative analysis of Stomidazolone binding to wild-type MUTE and MUTE site-directed mutants (MUTER133A_R134A, MUTEE162A_E163A, MUTER133A_R134A_E162A_E163A) by BLI. In vitro binding response curves are presented for Stomidazolone with MUTE and its mutants. Stomidazolone compound was tested at seven different concentrations (200, 100, 50, 25, 12.5, 6.25, and 3.125 μM). The data represent the mean ± SD and are representative of two independent experiments. d Site-directed mutant versions of MUTE that disrupt Stomidazolone binding are expressed normally and biologically functional. Representative cotyledon abaxial epidermis of 5-day-old mute-2 seedlings expressing MUTEpro::MUTE-GFP (left), MUTEpro::MUTEE162A_E163A -GFP (center), and MUTEpro::MUTER133A_R134A-GFP (right). Insets, representative late meristemoids from each panel with MUTE-GFP signals in nucleus. Confocal images are inverted for clear cellular outlines. Observations were repeated at least 3 times, each with 8 to 10 seedlings per line. Scale bars, 20 μm. e, f MUTE mutant versions that disrupt Stomidazolone binding confer drug resistance in vivo. e Representative cotyledon abaxial epidermis of 9-day-old mute-2 seedlings expressing MUTEpro::MUTE-GFP (left), MUTEpro::MUTEE162A_E163A -GFP (center), and MUTEpro::MUTER133A_R134A -GFP (right) with mock- (top) and 20 μM Stomidazolone for eight days (bottom). Scale bars, 50 μm. f Quantitative analysis of total (t: stomata and meristemoids), stomatal (s: green) or meristemoid (m: light cyan) density per mm2 of cotyledon abaxial epidermis from seedlings grown in the presence of 0 (mock) and 20 μM Stomidazolone. Two-tailed Student’s T test was performed were performed for each cell type (total, stomata and meristemoids) and p values are indicated. *, p < 0.05, ***, p < 0.0005. See “Methods” for the definition of the boxplots. Experiments were repeated twice. n = 8.

References

    1. Hetherington, A. M. & Woodward, F. I. The role of stomata in sensing and driving environmental change. Nature424, 901–908 (2003). - PubMed
    1. Hsu, P. K., Dubeaux, G., Takahashi, Y. & Schroeder, J. I. Signaling mechanisms in abscisic acid-mediated stomatal closure. Plant J.105, 307–321 (2021). - PMC - PubMed
    1. Kim, T. H., Bohmer, M., Hu, H., Nishimura, N. & Schroeder, J. I. Guard cell signal transduction network: advances in understanding abscisic acid, CO2, and Ca2+ signaling. Annu Rev. Plant Biol.61, 561–591 (2010). - PMC - PubMed
    1. Qi, X. & Torii, K. U. Hormonal and environmental signals guiding stomatal development. BMC Biol.16, 21 (2018). - PMC - PubMed
    1. Bertolino, L. T., Caine, R. S. & Gray, J. E. Impact of Stomatal density and morphology on water-use efficiency in a changing world. Front Plant Sci.10, 225 (2019). - PMC - PubMed

Publication types

MeSH terms

Substances

LinkOut - more resources