. 2024 Oct 23;15(10):771.
doi: 10.1038/s41419-024-07158-8.

Enhanced mGluR5 intracellular activity causes psychiatric alterations in Niemann Pick type C disease

Affiliations

Enhanced mGluR5 intracellular activity causes psychiatric alterations in Niemann Pick type C disease

Ana Toledano-Zaragoza et al. Cell Death Dis. .

Abstract

Niemann-Pick disease Type C (NPC) is caused by mutations in the cholesterol transport protein NPC1 leading to the endolysosomal accumulation of the lipid and to psychiatric alterations. Using an NPC mouse model (Npc1nmf164) we show aberrant mGluR5 lysosomal accumulation and reduction at plasma membrane in NPC1 deficient neurons. This phenotype was induced in wild-type (wt) neurons by genetic and pharmacological NPC1 silencing. Extraction of cholesterol normalized mGluR5 distribution in NPC1-deficient neurons. Intracellular accumulation of mGluR5 was functionally active leading to enhanced mGluR-dependent long-term depression (mGluR-LTD) in Npc1nmf164 hippocampal slices. mGluR-LTD was lower or higher in Npc1nmf164 slices compared with wt when stimulated with non-membrane-permeable or membrane-permeable mGluR5 agonists, respectively. Oral treatment with the mGluR5 antagonist 2-chloro-4-((2,5-dimethyl-1-(4-(trifluoromethoxy)phenyl)-1H-imidazol-4-yl)ethynyl)pyridine (CTEP) reduced mGluR-LTD and ameliorated psychiatric anomalies in the Npc1nmf164 mice. Increased neuronal mGluR5 levels were found in an NPC patient. These results implicate mGluR5 alterations in NPC psychiatric condition and provide a new therapeutic strategy that might help patients suffering from this devastating disease.


Conflict of interest statement

The authors declare no competing interests.

Figures
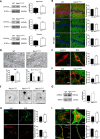
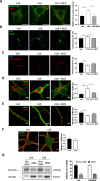
Fig. 1
Fig. 1. Increased levels and altered localization of mGluR5 in NPC1 deficient neurons.
A Western blot analysis of mGluR5 and GAPDH levels in extracts from the hippocampus, cortex and cerebellum of age-matched wt and Npc1nmf164 mice. Graphs show mean ± SEM levels of mGluR5 normalized to GAPDH levels that were used as loading control (Phippoccampus = 0.0482; P cortex = 0.0272; Pcerebellum = 0.0359) n = 6; Student’s t test). B Immunofluorescence analysis (IFA) of mGluR5 co-stained with markers for neurons (MAP2), astrocytes (GFAP) or microglia (F4/80) in the hippocampus of wt and Npc1nmf164 mice. Graphs show mean ± SEM fluorescence intensity of mGluR5 in each type of cell as a percentage of the levels in the wt images. (Pneurons = 0.0445; n = 5; Student’s t test). Scale bar 10 µm. C IFA of mGluR5 and MAP2 (marker for soma and dendrites of neurons) in the hippocampus of control child and NPC patient. Graph shows mean ± SEM fluorescence intensity as a percentage of the levels in the control child (n = 20 neurons). Scale bar 10 µm. D Immunoelectron microscopy showing mGluR5 in pyramidal neurons of the hippocampus from wt and Npc1nmf164 mice. Left graph: mean ± SEM number of mGluR5-associated gold particles per μm2 P = 0.0304; n = 4; Student’s t test); Right graph: mean ± SEM number of plasma membrane or intracellular mGluR5-associated gold particles as a percentage of the total gold particles (Pplasma membrane < 0.0001; Pintracellular < 0.0001; n = 4; 2-way ANOVA Bonferroni post-hoc). E Crops of immunoelectron micrographs showing mGluR5- associated gold particles in membranous structures compatible with endolysosomes in pyramidal neurons from Npc1nmf164 mice. Scale bar 250 nm. F IFA of mGluR5 co-stained with the endolysosomal marker Lamp1 in a pyramidal neuron of the hippocampus from wt and Npc1nmf164 mice. Graph shows mean ± SEM Manders’ coefficient of co-localization between mGluR5 and Lamp1 (P = 0.0134; n = 4; Student’s t test). Scale bar 5 µm. G Western blot analysis of mGluR5 and Lamp1 levels in lysosomal-enriched fractions from the brain of wt and Npc1nmf164 mice. Graphs show mean ± SEM levels of mGluR5 normalized to Lamp1 (P = 0.0381; n = 3; Paired t test). H. IFA of mGluR5 in cultured hippocampal neurons permeabilized (upper panels, Total mGluR5) or not (lower panels, Surface mGluR5) from wt mice treated with vehicle (Veh) or with U18 (NPC1 inhibitor). Graphs show mean ± SEM fluorescence intensity as percentage of the levels in the wt images (PmGluR5 = 0.0197; Psurface mGluR5 = 0.0363 n = 5; paired Student’s t test). Scale bar 10 µm. I. IFA of mGluR5 co-stained with the markers of endolysosomes Lamp1 or of surface Homer1 in cultured hippocampal neurons from wt mice treated with U18 or Veh. Graphs show mean ± SEM Manders’ coefficient of co-localization between mGluR5 and Lamp1 or Homer1 (PmGluR5-Lamp1 = 0.0182; PmGluR5-Homer1 = 0.0071 n = 5–6; paired Student’s t test). Scale bar 5 µm.
Fig. 2
Fig. 2. Cholesterol alterations induce mGluR5 changes upon NPC1 deficiency.
A Image of BODIPY-cholesterol and Lamp1 staining in cultured neurons from wt mice treated with Veh, U18 alone or with U18 plus MCD. Graph shows mean ± SEM BODIPY-cholesterol fluorescence intensity (a.u.) in Lamp1 positive area compared to cytosol (P Veh-U18 = 0.0383; P U18-U18+MCD = 0.0290; n = 3; Paired two-tailed t test). Scale bar 5 µm. BE IFA of mGluR5 in cultured neurons from wt mice treated with Veh, U18 alone or with U18 plus MCD. B mGluR5 total staining in permeabilized neurons. C mGluR5 surface staining using anti-mGluR5 N-terminal in non -permeabilized neurons. D mGluR5 co-staining with Lamp1. E mGluR5 co-staining with Homer 1. Graphs in (B, C) show mean ± SEM mGluR5 fluorescence intensity as a percentage of the levels in the neurons treated with Veh that were considered 100% (PB. Veh-U18 = 0.0243; PB. U18-U18+MCD = 0.0378; PC. Veh-U18 = 0.0471; n = 4–6; Grouped one-way ANOVA Bonferroni post hoc). Scale bar 10 µm. Graphs in (D, E) show mean ± SEM Manders’ coefficient of co-localization between mGluR5 and Lamp1 or Homer1 (PD. Veh-U18 = 0.0094; PD. U18-U18+MCD = 0.0314; PE. Veh-U18 = 0.0419; n = 4–6; Grouped one-way ANOVA Bonferroni post hoc). Scale bar 5 µm. F IFA of mGluR5 co-stained with the raft marker caveolin1 in cultured neurons from wt mice treated with Veh or with U18. Graphs show mean ± SEM Manders’ coefficient of co-localization between mGluR5 and caveolin1 (n = 4). Scale 10 µm. G Western blot showing mGluR5 in the supernatant (detergent-resistant membrane; DRM) or pellet (non DRM) obtained after cold detergent extraction in cultured neurons from wt mice treated with U18 or Veh. The DRM canonical marker flotilin was used as control for the isolation protocol. Graph shows mean ± SEM levels of mGluR5 expressed as a percentage of the total levels (n = 6; Two-way ANOVA Bonferroni post hoc).
Fig. 3
Fig. 3. Altered mGluR5 function upon NPC1 deficiency.
A Western blot showing puromycin in the SUnSET assay in hippocampal slices from wt and Npc1nmf164 mice. Graph shows mean ± SEM total intensity associated with puromycin as a percentage of the wt values (P = 0.0011; n = 17–18; Student’s t test). B mGluR-LTD expressed as excitatory postsynaptic field responses (fEPSP) registered in the CA1 pyramidal region of wt and Npc1nmf164 mice. Graphs represent fEPSP slope over baseline (left) or mGluR-LTD expressed as mean ± SEM percentage of fEPSP slope over baseline from minute 45 to minute 55 of the LTD recording (right) ((PWT Veh = 0.0110; PNpc1 Veh = 0.0080; PWT-Npc1 = 0.0004; n = 5 slices from 5 WT mice and n = 5 slices from 5 Npc1nmf164 mice; Student’s t test; # comparison of baseline versus LTD for the same genotype; *comparison between different genotypes). Representative traces of responses to stimulation are included (upper trace: wt; bottom trace: Npc1nmf164). Scale bar: −1 mV/5 ms. C mGluR-LTD expressed as excitatory postsynaptic field responses (fEPSP) registered in the CA1 pyramidal region of wt and Npc1nmf164 mice before and after 10 min of incubation with DHPG (non-membrane permeable mGluR5 agonist). Graphs represent fEPSP slope over baseline (left) or mGluR-LTD expressed as mean ± SEM percentage of fEPSP slope over baseline from minute 45 to minute 55 of the LTD recording (right) (PWT < 0.0001; n = 7–9; Student’s t test; # comparison of baseline versus LTD for the same genotype; *comparison between different genotypes). Representative traces of responses to stimulation are included (upper trace: wt; bottom trace: Npc1nmf164). Scale bar: −1 mV/5 ms. D mGluR-LTD expressed as excitatory postsynaptic field responses (fEPSP) registered in the CA1 pyramidal region of wt and Npc1nmf164 mice before and after 15 min of incubation with CHPG (membrane-permeable mGluR5 agonist). Graphs represent fEPSP slope over baseline (left) or mGluR-LTD expressed as mean ± SEM percentage of fEPSP slope over baseline from minute 55 to minute 65 of the LTD recording (right) (PNpc1 = 0.0004; PWT-Npc1 = 0.0425; n = 5-10; Student’s t test, # comparison of baseline versus LTD for the same genotype; *comparison between different genotypes). Representative traces of responses to stimulation are included (upper trace: WT; bottom trace: Npc1nmf164). Scale bar: −1 mV/5 ms.
Fig. 4
Fig. 4. Behavioral alterations in Npc1nmf164 mice.
A Graph showing mean ± SEM time spent in the open arm of the elevated plus maze as a percentage of the total exploring time by wt or Npc1nmf164 mice (P < 0.0001; n = 9-10; Student’s t test). B Graph showing mean ± SEM immobility time spent in the tail suspension test as a percentage of the total time by wt or Npc1nmf164 mice (P < 0.0001; n = 9-11; Student’s t test). C Graph showing mean ± SEM of time spent self-grooming by wt or Npc1nmf164 mice (P < 0.0001; n = 7–8; Student’s t test). D Graph showing mean ± SEM of number of marbles buried by wt or Npc1nmf164 mice (P < 0.0001; n = 7–9; Student’s t test). E Graphs show mean ± SEM of nest-building test score (left) and unused cotton material in grams (right) by wt or Npc1nmf164 mice in the nest-building test (Pleft < 0.0001; Pright < 0.0001 n = 7-9; Student’s t test). F Graph showing mean ± SEM of sucrose solution consumption in the sucrose preference test by wt or Npc1nmf164 mice (n = 4; Student’s t test). G Graph showing mean ± SEM of preference index for sociability (stranger 1 vs. empty cage) in the three-chamber test by wt or Npc1nmf164 mice (n = 3–4; Student’s t test). H Graph showing mean ± SEM Graph shows mean ± SEM of preference index for social novelty (stranger 2 vs. stranger 1) in the three-chamber test by wt or Npc1nmf164 mice (n = 3–4; Student’s t test).
Fig. 5
Fig. 5. The mGluR5 antagonist CTEP normalizes mGluR5 function and psychiatric alterations in Npc1nmf164 mice.
A Graph showing mean ± SEM time spent in the open arm of the elevated plus maze as a percentage of the total exploring time by wt or Npc1nmf164 mice treated with vehicle (Veh) (data from Fig. 4 are represented here in (AE) for clarity) or with CTEP (membrane-permeable mGluR5 antagonist) (PWT Veh – Npc1 Veh < 0.0001; PNpc1 Veh – Npc1 CTEP = 0.0006; PWT Veh – Npc1 CTEP = 0.0008; n = 9–10; grouped one-way ANOVA Bonferroni post hoc). B Graph showing mean ± SEM immobility time spent in the tail suspension test as a percentage of the total time by wt or Npc1nmf164 mice treated with Veh or CTEP (PWT Veh – WT CTEP = 0.0169; PWT Veh – Npc1 Veh < 0.0001; PNpc1 Veh – Npc1 CTEP = 0.0111; PWT Veh – Npc1 CTEP < 0.0001; n = 9–11; grouped one-way ANOVA Bonferroni post hoc). C Graph showing mean ± SEM of time spent self-grooming by wt or Npc1nmf164 mice treated with Veh or CTEP (PWT Veh – Npc1 Veh < 0.0001; PNpc1 Veh – Npc1 CTEP = 0.002; PWT Veh – Npc1 CTEP = 0.001; n = 5–8; grouped one-way ANOVA Bonferroni post hoc). D Graph showing mean ± SEM of number of marbles buried by wt or Npc1nmf164 mice treated with Veh or CTEP (PWT Veh – Npc1 Veh < 0.0001; PNpc1 Veh – Npc1 CTEP = 0.0407; PWT Veh – Npc1 CTEP < 0.0001; n = 5–9; grouped one-way ANOVA Bonferroni post hoc). E Graphs showing mean ± SEM of nest-building test score (left) and unused cotton material in the nest-building test (right) by wt or Npc1nmf164 mice treated with Veh or CTEP (PLeft WT Veh – Npc1 Veh < 0.0001; PLeft WT Veh – Npc1 CTEP < 0.0001; PRight WT Veh – Npc1 Veh < 0.0001; PRight WT Veh – Npc1 CTEP < 0.0001; n = 5–9; Grouped one-way ANOVA Bonferroni post hoc). F mGluR-LTD expressed as excitatory postsynaptic field responses (fEPSP) registered in the CA1 pyramidal region of wt and Npc1nmf164 mice treated with CTEP or Veh. Graphs represent fEPSP slope over baseline (left) or mGluR-LTD expressed as mean ± SEM percentage of fEPSP slope over baseline from minute 45 to minute 55 of the LTD recording (right) (PWT Veh = 0.0110; PWT CTEP = 0.0087; PNpc1 Veh = 0.0080; PNpc1 CTEP = 0.0003; PWT-Npc1 < 0.0001; PNpc1 Veh – Npc1 CTEP = 0.0136; n = 5 slices from 5 wt mice treated with CTEP or Veh and n = 5 slices from 5 Npc1nmf164 mice treated CTEP or Veh; # comparison of baseline versus LTD for the same genotype; *comparison between different genotypes; grouped one-way ANOVA Bonferroni post hoc). Representative traces of responses to stimulation are included (upper left trace: wt Veh; upper right trace: wt CTEP; bottom left trace: Npc1nmf164 Veh; bottom right trace: Npc1nmf164 CTEP). Scale bar: −1 mV/5 ms. G Western blot showing puromycin in the Sunset assay in slices from the hippocampus from wt and Npc1nmf164 mice treated with CTEP or Veh. Graph shows mean ± SEM total intensity associated with puromycin as a percentage of the values obtained in wt slices treated with Veh (P = 0.0051; n = 9–18; grouped one-way ANOVA Bonferroni post hoc).

References

    1. Pentchev PG, Comly ME, Kruth HS, Vanier MT, Wenger DA, Patel S, et al. A defect in cholesterol esterification in Niemann-Pick disease (type C) patients. Proc Natl Acad Sci USA. 1985;82:8247. - PMC - PubMed
    1. Vanier MT Niemann-Pick disease type C. Orphanet J Rare Dis. 2010;5:16. - PMC - PubMed
    1. Patterson MC, Hendriksz CJ, Walterfang M, Sedel F, Vanier MT, Wijburg F Recommendations for the diagnosis and management of Niemann-Pick disease type C: an update. Mol Genet Metab. 2012;106:330–44. - PubMed
    1. Karten B, Campenot RB, Vance DE, Vance JE The Niemann-Pick C1 protein in recycling endosomes of presynaptic nerve terminals. J Lipid Res. 2006;47:504–14. - PubMed
    1. Yadid G, Sotnik-Barkai I, Tornatore C, Baker-Cairns B, Harvey-White J, Pentchev PG, et al. Neurochemical alterations in the cerebellum of a murine model of Niemann-Pick type C disease. Brain Res. 1998;799:250–6. - PubMed

MeSH terms

Substances

LinkOut - more resources