. 2024 Oct 23;15(1):9148.
doi: 10.1038/s41467-024-53429-5.

Remyelination protects neurons from DLK-mediated neurodegeneration

Affiliations

Remyelination protects neurons from DLK-mediated neurodegeneration

Greg J Duncan et al. Nat Commun. .

Abstract

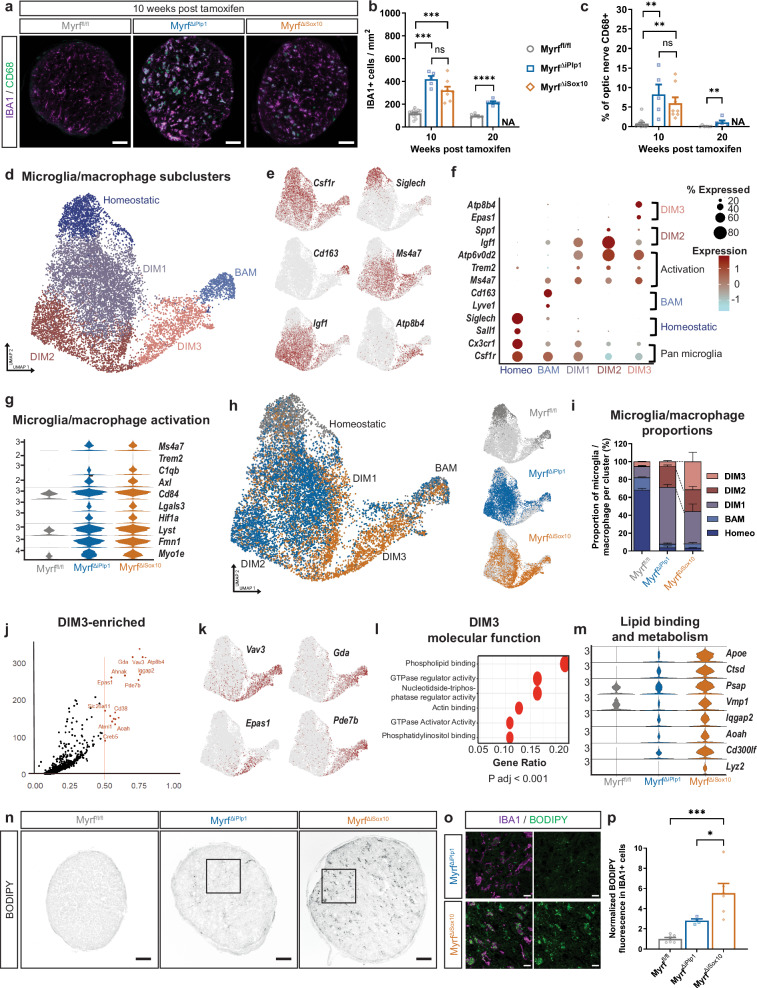
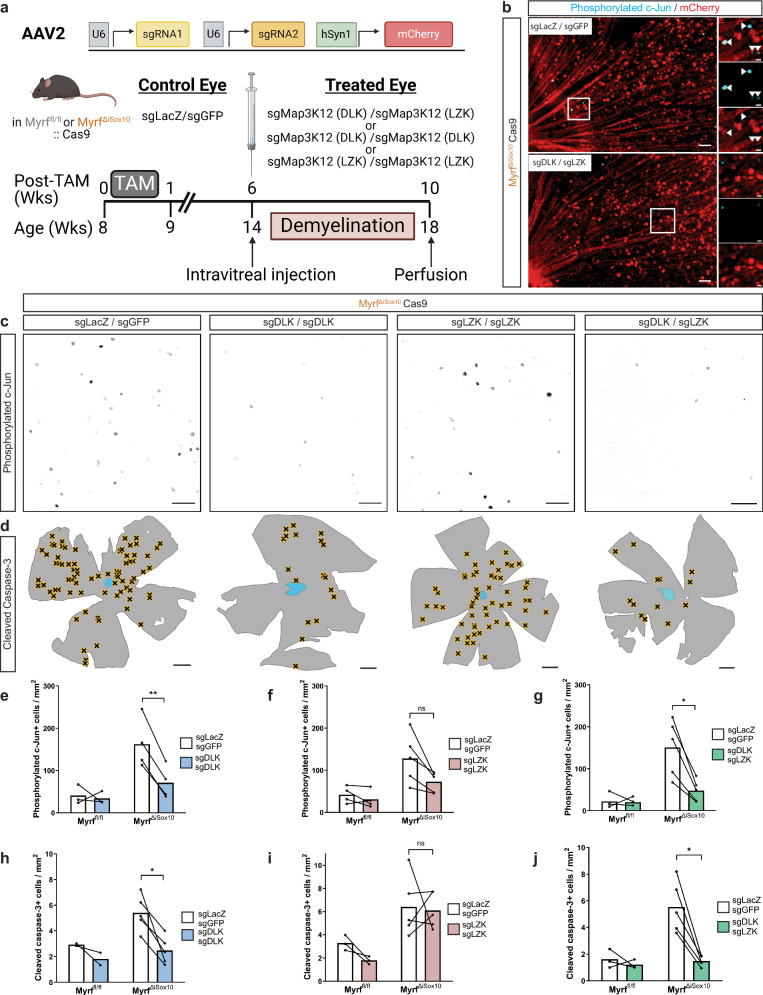
Chronic demyelination and oligodendrocyte loss deprive neurons of crucial support. It is the degeneration of neurons and their connections that drives progressive disability in demyelinating disease. However, whether chronic demyelination triggers neurodegeneration and how it may do so remain unclear. We characterize two genetic mouse models of inducible demyelination, one distinguished by effective remyelination and the other by remyelination failure and chronic demyelination. While both demyelinating lines feature axonal damage, mice with blocked remyelination have elevated neuronal apoptosis and altered microglial inflammation, whereas mice with efficient remyelination do not feature neuronal apoptosis and have improved functional recovery. Remyelination incapable mice show increased activation of kinases downstream of dual leucine zipper kinase (DLK) and phosphorylation of c-Jun in neuronal nuclei. Pharmacological inhibition or genetic disruption of DLK block c-Jun phosphorylation and the apoptosis of demyelinated neurons. Together, we demonstrate that remyelination is associated with neuroprotection and identify DLK inhibition as protective strategy for chronically demyelinated neurons.


Conflict of interest statement

T.S.S. and B.E. are co-founders of Autobahn Therapeutics, B.E. has received consulting fees from Autobahn Therapeutics and T.S.S. is a Senior Advisor to Autobahn Therapeutics. B.E. and G.J.D. have received licensing fees for the use of Myrf inducible conditional knockout mice. These potential conflicts of interest have been reviewed and managed by OHSU. The remaining authors declare no competing interests.

Figures

Fig. 1
Fig. 1. MyrfΔiSox10 mice undergo CNS demyelination with limited remyelination.
a Transgenic strategy to induce demyelination with the aim of permitting (MyrfΔiPlp1 mice) or inhibiting (MyrfΔiSox10 mice) remyelination. b Timeline of tamoxifen administration, demyelination and remyelination in MyrfΔiPlp1 and MyrfΔiSox10 mice. c Electron micrographs of the optic nerve of Myrffl/fl, MyrfΔiPlp1 and MyrfΔiSox10 mice. d Quantification of the percentage of myelinated axons in the optic nerve. ****p < 0.0001 and **p = 0.0017. Week 10 Myrffl/fl n = 7, Week 10/20 MyrfΔiPlp1 n = 3, MyrfΔiSox10 n = 5 mice. e Optic nerve cross sections stained for MBP (myelin) and BCAS1 (new OLs/myelin). f Percentage of optic nerve that is BCAS1+. ***p = 0.0003 and *p = 0.0104. Week 10 Myrffl/fl n = 14, MyrfΔiPlp1 n = 7, MyrfΔiSox10 n = 8, Week 20 Myrffl/fl n = 7, MyrfΔiPlp1 n = 6 mice. g Representative CAPs from the optic nerve. h CAP latency during de- and remyelination. Week 10 MyrfΔiPlp1 relative to Myrffl/fl **p = 0.0069 and Week 20 MyrfΔiPlp1 relative to Myrffl/fl **p = 0.0012, *p = 0.0342, ****p < 0.0001. Week 10 Myrffl/fl n = 12, MyrfΔiPlp1 n = 5, MyrfΔiSox10 n = 5, and week 20 Myrffl/fl n = 4, MyrfΔiPlp1 n = 4 mice. i CAP area during de- and remyelination. MyrfΔiPlp1 relative to Myrffl/fl at 10 weeks *p = 0.0287 and 20 weeks *p = 0.0205, ***p = 0.0010. Week 10 Myrffl/fl n = 12, MyrfΔiPlp1 n = 5, MyrfΔiSox10 n = 5, week 20 Myrffl/fl n = 4, MyrfΔiPlp1 n = 5 mice. j VEPs measured over time. **p = 0.0025, *p = 0.0372. Myrffl/fl n = 13, MyrfΔiPlp1 n = 8, MyrfΔiSox10 n = 7 mice. One-way ANOVA with Tukey’s post hoc for (d), and used for week 10 in (hj). Kruskal–Wallis with Dunn’s test for (f). Week 20 comparisons used Student’s t test for (h) and with Welch correction for (i). Mann–Whitney U test was used for week 20 comparison in (f). All statistical tests are two-sided. Scale bar is 1 µm in (c), 50 µm in (e). NA not applicable. Error bars are SEM. Source data for this Figure are provided as a Source Data file. a created in BioRender. Duncan (2024) BioRender.com/a35m876. b created in BioRender. Duncan (2023) BioRender.com/g44t478. Schematic in g created in BioRender. Duncan (2023) BioRender.com/h38j796. Schematic in j created in BioRender. Duncan (2023) BioRender.com/v92t428.
Fig. 2
Fig. 2. Differentiation of OPCs is blocked at the COP stage following demyelination in MyrfΔiSox10 mice.
a Schematic of approach used to isolate and sequence nuclei from the optic nerve. b Uniform manifold approximation and projection (UMAP) of 49,806 nuclei. COP committed OL precursor cells, NFOL newly-formed OL, MFOL myelin-forming OLs, MOL mature OLs, KOOL knockout OLs, VLMC vascular and leptomeningeal cells, ABC arachnoid barrier cells. c Dot plot showing cluster-specific markers. d UMAP displaying expression of key markers of the OL lineage (Sox10), OPCs (Pdgfra), COP1s (Gpr17), NFOLs (Tcf7l2), MFOLs (Mobp) and MOLs (Anln, Mobp). e UMAP of OL lineage cell nuclei broken down by genotype. f Stacked bar graph showing the proportions of oligodendroglial cell clusters across genotypes. g Violin plots for selected transcripts expressed in OL lineage cells across genotypes. h Optic nerve cross sections stained with the OL lineage marker OLIG2, along with PDGFRα (expressed in OPCs) and CC1 (in OLs). i Quantification of the density of OLIG2+ oligodendrocyte lineage cells. **p = 0.0013 and ****p < 0.0001. j Graph of the density of OLIG2+PDGFRα+ OPCs. **p = 0.0016, ****p < 0.0001 and nsp = 0.2529. k Quantification of OLIG2+CC1+ OLs. *p = 0.0397 and ****p < 0.0001. Week 10 Myrffl/fl n = 14, MyrfΔiPlp1 n = 5, MyrfΔiSox10 n = 6, and Week 20 Myrffl/fl n = 5, MyrfΔiPlp1 n = 4 mice for (ik). One-way ANOVA with Tukey’s post hoc for week 10 pairwise comparisons in (i, j) with Kruskal–Wallis with Dunn’s test in (k). Week 20 comparisons used Student’s t test in (i, j) and Mann–Whitney U in (k). All statistical tests are two-sided. Error bars are SEM. Scale bar is 50 µm in (h). NA not applicable. ns not statistically significant. Source data for this Figure are provided as a Source Data file. a created in BioRender. Duncan (2024) BioRender.com/t20c114.
Fig. 3
Fig. 3. Remyelination failure in MyrfΔiSox10 mice is associated with microglia/macrophages with elevated transcription of lipid metabolism genes and accumulated neutral lipids.
a Optic nerve cross-sections stained with IBA1 for microglia/macrophages and the lysosomal marker CD68. b IBA1+ cell quantification in the optic nerve. MyrfΔiPlp1 relative to Myrffl/fl at week 10 ***p = 0.0005 and MyrfΔiSox10 relative to Myrffl/fl at week 10 ***p = 0.0010, nsp = 0.1173 ****p < 0.0001. c Quantification of the percent of the optic nerve occupied by CD68 staining. MyrfΔiPlp1 relative to Myrffl/fl at week 10 post tamoxifen (**p = 0.0030), MyrfΔiPlp1 relative to Myrffl/fl at week 20 post tamoxifen (**p = 0.0087) and MyrfΔiSox10 relative to Myrffl/fl at 10 weeks post tamoxifen **p = (0.0038), nsp > 0.9999. Week 10 Myrffl/fl n = 13, MyrfΔiPlp1 n = 5, MyrfΔiSox10 n = 8 and week 20 Myrffl/fl n = 6, MyrfΔiPlp1 n = 5 mice for (b, c). d UMAP plot of reclustered microglia/macrophage nuclei identifying five annotated subclusters (homeostatic microglia, barrier associated macrophages (BAM), demyelination induced microglia/macrophages (DIM 1–3). N = 11,402 nuclei. e UMAP of key subcluster transcripts enriched within microglial/macrophage population; pan microglial/macrophage marker (Csf1r), homeostatic microglia (Siglech), BAMs (Cd163), DIMs (Ms4a7), DIM2 (Igf1) and DIM3 (Atp8b4). f Dot plot showing expression of sub-cluster specific markers. g Violin plots for selected transcripts associated with activation in microglia/macrophage nuclei. h UMAP of microglia/macrophage lineage cell nuclei broken down by genotype. i Stacked bar graph of microglia/macrophage subcluster composition by genotype. j Volcano plot of key enriched transcripts in DIM3. Log2(fold change) >0.5 adjusted p < 0.05. Wilcoxon rank-sum test. k UMAPs of genes enriched in DIM3 cluster. l DIM3 gene ontology top six terms for molecular function. Two-sided Wilcoxon rank-sum test with padj <0.05. m Violin plots showing expression of select lipid binding and metabolism genes in the microglia/macrophage lineage by genotype. n BODIPY fluorescence in the optic nerve of Myrffl/fl, MyrfΔiPlp1 and MyrfΔiSox10 mice at 10 weeks post tamoxifen. o Magnified region of the optic nerve from MyrfΔiPlp1 and MyrfΔiSox10 demonstrating the majority of BODIPY signal colabels with IBA1. p BODIPY fluorescence in the optic nerve. *p = 0.0258 and ***p = 0.001. Myrffl/fl n = 7, MyrfΔiPlp1 n = 4, MyrfΔiSox10 n = 6 mice. One-way Welch’s ANOVA with Dunnett’s T3 post hoc for week 10 in (b), Kruskal–Wallis with Dunn’s test for 10 week comparison in (c) and one-way ANOVA with Tukey’s post hoc in (p). For week 20 comparisons Student’s t test was used in (b) and Mann–Whitney U in (c). All statistical tests are two-sided. Error bars are SEM. Scale bars 50 µm in (a, n) and 10 µm in (o). NA not applicable, ns not statistically significant. Source data for this Figure are provided as a Source Data file.
Fig. 4
Fig. 4. MyrfΔiSox10 mice incur axon loss and have increased neuronal apoptosis relative to remyelinating MyrfΔiPlp1 mice.
a Electron micrographs of the optic nerve demonstrating axons with organelle accumulations in MyrfΔiPlp1 and MyrfΔiSox10 mice. Boxed areas show individual axons with organelle accumulation enlarged to the right. b Quantification of the number of axons with organelle accumulation. ****p < 0.0001, ***p = 0.0004 and *p = 0.0437. n = 5 mice per group. c Serum neurofilament levels measured at 10 and 20 weeks post tamoxifen. ****p < 0.0001, ***p = 0.0004 and nsp = 0.1111. Week 10 Myrffl/fl n = 22, MyrfΔiPlp1 n = 7, MyrfΔiSox10 n = 19, and week 20 n = 4, MyrfΔiPlp1 n = 5 mice. d The total number of axons within the optic nerve. *p = 0.0202. n = 5 mice per group. e Overview of retina with locations of cleaved caspase-3+ cells in the GCL indicated by black X. f RBPMS in the retina across genotypes. g Density of cleaved caspase-3+ cells in retinal flatmounts. MyrfΔiSox10 ****p < 0.0001. h Density of cleaved caspase-3 and RBPMS double-labeled cells. ****p < 0.0001 and **p = 0.0018. Week 10 Myrffl/fl n = 11, MyrfΔiPlp1 n = 7, MyrfΔiSox10 n = 5, Week 12 Myrffl/fl n = 8, MyrfΔiPlp1 n = 4, MyrfΔiSox10 n = 5, and Week 20 Myrffl/fl n = 10, MyrfΔiPlp1 n = 8 mice for (g, h). i Co-labeling between cleaved caspase-3 and RBPMS or AP-2 α/β in the retina. Arrowhead indicates cleaved-caspase-3+RBPMS+ cell. Arrow indicates cleaved caspase-3+AP-2α/β-negative cell. j The majority of cleaved-caspase-3+ in MyrfΔiSox10 mice are RBPMS+ and AP-2α/β-negative. k Total density of RBPMS+ RGCs. Week 10 Myrffl/fl n = 18, MyrfΔiPlp1 n = 7, MyrfΔiSox10 n = 13, Week 12 Myrffl/fl n = 13, MyrfΔiPlp1 n = 8, MyrfΔiSox10 n = 9, and Week 20 Myrffl/fl n = 10, MyrfΔiPlp1 n = 10 mice. One-way ANOVA with Tukey’s post hoc for pairwise comparisons in (b, d). Kruskal–Wallis with Dunn’s test for comparisons at week 10 for (c). For week 20, Student’s t test used in (g, h, k) and Mann–Whitney U for (c). Two-ANOVA with Tukey’s post hoc for comparisons at week 10 and 12 in (g, h, k). All statistical tests are two-sided. Error bars are SEM. Scale bars are 1 µm in (a), 50 µm in (f) and overview images in (i) and insets are 5 µm. Scale bars are 500 µm (e). NA not applicable, ns not statistically significant. Source data for this Figure are provided as a Source Data file.
Fig. 5
Fig. 5. Activation of the DLK/JNK/c-Jun pathway in chronically demyelinated MyrfΔiSox10 mice.
a Experimental schematic and images of laser microdissection of the GCL of the retina. b Heatmap of expression of RGC-specific transcripts in the micro-dissected GCL samples relative to whole retina. c Heatmap of select transcripts from the GCL known to be activated by c-Jun/DLK signaling compared between genotypes. In situ hybridization in the retina at 10 weeks post tamoxifen with probes against Rbpms and Hrk (d) or Ecel1 (e). Arrowheads indicate double-positive cells. f Retina at 10 weeks post tamoxifen stained with phosphorylated (Ser63) c-Jun. g Quantification of phosphorylated c-Jun cells in the retinae of each genotype. ****p < 0.0001, and MyrfΔiPlp1 relative to Myrffl/fl at 10 (**p = 0.0088) and 20 weeks post tamoxifen (**p = 0.0092). Week 10 Myrffl/fl n = 16, MyrfΔiPlp1 n = 4, MyrfΔiSox10 n = 8, week 12 Myrffl/fl n = 7, MyrfΔiPlp1 n = 3, MyrfΔiSox10 n = 3, and week 20 Myrffl/fl n = 5, MyrfΔiPlp1 n = 7 mice. h Phosphorylated c-Jun costained with RBPMS cells in MyrfΔiSox10 mice. Inlays are of boxed area. Arrowheads indicate colabeled cells. i Representative images of phosphorylated c-Jun stained with AP-2α/β in MyrfΔiSox10 retinae. Inlays are of boxed area. Arrows indicate phosphorylated c-Jun positive cells negative for AP-2α/β. j Quantification of RBPMS and AP-2α/β expression in phosphorylated c-Jun+ cells. k Image of retinal layers stained with phosphorylated c-Jun, RBPMS and DAPI. Inlays are of boxed area. l Schematic of the DLK-mediated MAPK cascade and c-Jun. m Western blot of optic nerves for DLK, pMKK4, MKK4, pJNK, JNK, MOG and β-actin loading control from optic nerves of Myrffl/fl, MyrfΔiPlp1 and MyrfΔiSox10 mice. n Quantification of western blots in MyrfΔiPlp1 mice relative to Myrffl/fl. ***p = 0.0007 and *p = 0.0309. n = 4 per group. o Quantification of western blots in MyrfΔiSox10 mice relative to Myrffl/fl. pMKK4 (*p = 0.0434), pJNK (**p = 0.0072), total JNK (**p = 0.0034) and MOG **p = 0.0038). Myrffl/fl n = 4 and MyrfΔiSox10 n = 3. Scale bars are 50 µm in (a, f, h, i, k), and 5 µm in (d, e), insets in (h, i, k). Two-way ANOVA with Tukey’s post hoc at 10 and 12 weeks post tamoxifen, and Student’s t test to compare groups at 20 weeks post tamoxifen in (g). Student’s t test in (n, o). All statistical tests are two-sided. Error bars are SEM. NA not applicable. Source data for this Figure are provided as a Source Data file. Schematic in a created in BioRender. Duncan (2023). BioRender.com/n39a548. l created in BioRender. Duncan (2023) BioRender.com/g94u157.
Fig. 6
Fig. 6. Pharmacological inhibition of DLK reduces c-Jun phosphorylation and blocks neuronal apoptosis in demyelinated MyrfΔiSox10 mice.
a Schematic of the DLK MAPK cascade and timeline of GNE-3511 administration. b Serum levels of GNE-3511 following 3 days of oral gavage. c Representative retinal flatmount images of vehicle and GNE-3511 treated mice stained with phosphorylated c-Jun and RBPMS at 10 weeks post-tamoxifen. d Overview of retinas with locations of cleaved caspase-3+ cells in the ganglion cell layer (GCL) indicated by black X. e Quantification of phosphorylated c-Jun+ cells in vehicle or GNE-3511-treated retinae. ****p < 0.0001. Vehicle Myrffl/fl n = 8, MyrfΔiSox10 n = 11 and GNE-3511 Myrffl/fl n = 6, MyrfΔiSox10 n = 9. f Cleaved caspase-3 density in vehicle or GNE-3511-treated retinae. ***p = 0.0002 and ****p < 0.0001. g Cleaved caspase-3+RBPMS+ cell density in vehicle or GNE-3511-treated retinae. Vehicle-treated MyrfΔiSox10 relative to GNE-treated MyrfΔiSox1 mice at 10 weeks post-tamoxifen (p = 0.0005) and relative to Myrffl/fl controls (vehicle, p = 0.0008, GNE-3511, p = 0.0001). Vehicle Myrffl/fl n = 7, MyrfΔiSox10 n = 7 and GNE-3511 Myrffl/fl n = 6, MyrfΔiSox10 n = 6 mice in (f, g). Two-way ANOVA with Tukey’s post hoc for individual pairwise comparisons in (eg). All statistical tests are two-sided. Error bars are SEM. Scale bars are 50 µm in (c) and 500 µm in (d). Source data for this Figure are provided as a Source Data file. a created in BioRender. Duncan (2023) BioRender.com/h30g439.
Fig. 7
Fig. 7. DLK is necessary for neuronal apoptosis following demyelination in MyrfΔiSox10 mice.
a Schematic of the viral CRISPR/Cas9 approach to disrupt DLK and/or LZK in retinal cells. b Retinae stained with phosphorylated c-Jun and mCherry at 10 weeks post tamoxifen following treatment with sgLacZ/sgGFP, or sgDLK/sgLZK on the opposite eye. Inlays are of boxed areas and scale bar is 5 µm in boxed areas. c Representative images of phosphorylated c-Jun immunostaining in retinal flatmounts following administration of sgLacZ/sgGFP, sgDLK/sgDLK, sgLZK/sgLZK, or sgDLK/sgLZK. d Overview of retinas with locations of cleaved caspase-3+ cells in the GCL indicated by black X in viral-treated eyes. e Density of phosphorylated c-Jun cells within the GCL following sgDLK/sgDLK administration. **p = 0.0080. Myrffl/fl n = 3, MyrfΔiSox10 n = 4 mice. f Density of phosphorylated c-Jun positive cells in the GCL following sgLZK/sgLZK administration. nsp = 0.0766. Myrffl/fl n = 4, MyrfΔiSox10 n = 5 mice. g Density of phosphorylated c-Jun cells within the GCL following sgDLK/sgLZK administration. *p = 0.0148. Myrffl/fl n = 3, MyrfΔiSox10 n = 5 mice. h Cleaved-caspase-3+ cells within the GCL following sgDLK/sgDLK administration. *p = 0.0254. Myrffl/fl n = 2, MyrfΔiSox10 n = 5 mice. i The density of cleaved-caspase-3+ cells within the GCL after sgLZK/sgLZK administration. nsP = 0.8530. Myrffl/fl n = 3, MyrfΔiSox10 n = 5 mice. j Cleaved-caspase-3+ cells within the GCL following sgDLK/sgLZK administration. *p = 0.0125. Myrffl/fl n = 3, MyrfΔiSox10 n = 5 mice. Scale bars are 50 µm in (b, c) and 500 µm in (d). Connected lines indicate retinae from the same mouse in (ej). Paired Student’s t test with Holm-Šidák correction for multiple comparisons was used from (ej). All statistical tests are two-sided. ns not statistically significant. Error bars are SEM. Source data for this Figure are provided as a Source Data file. a created in BioRender. Duncan (2023) BioRender.com/e99a533.

Update of

Similar articles

Cited by

References

    1. Zawadzka, M. et al. CNS-resident glial progenitor/stem cells produce Schwann cells as well as oligodendrocytes during repair of CNS demyelination. Cell Stem Cell6, 578–590 (2010). - PMC - PubMed
    1. Tripathi, R. B., Rivers, L. E., Young, K. M., Jamen, F. & Richardson, W. D. NG2 glia generate new oligodendrocytes but few astrocytes in a murine experimental autoimmune encephalomyelitis model of demyelinating disease. J. Neurosci.30, 16383–16390 (2010). - PMC - PubMed
    1. Duncan, I. D. et al. The adult oligodendrocyte can participate in remyelination. Proc. Natl Acad. Sci. USA115, E11807–E11816 (2018). - PMC - PubMed
    1. Mezydlo, A. et al. Remyelination by surviving oligodendrocytes is inefficient in the inflamed mammalian cortex. Neuron111, 1748–1759.e1748 (2023). - PubMed
    1. Neely, S. A. et al. New oligodendrocytes exhibit more abundant and accurate myelin regeneration than those that survive demyelination. Nat. Neurosci.25, 415–420 (2022). - PMC - PubMed

Publication types

MeSH terms

Substances

Associated data