

Automated deep learning-based bone mineral density assessment for opportunistic osteoporosis screening using various CT protocols with multi-vendor scanners
- PMID: 39443535
- PMCID: PMC11499650
- DOI: 10.1038/s41598-024-73709-w
Automated deep learning-based bone mineral density assessment for opportunistic osteoporosis screening using various CT protocols with multi-vendor scanners
Abstract
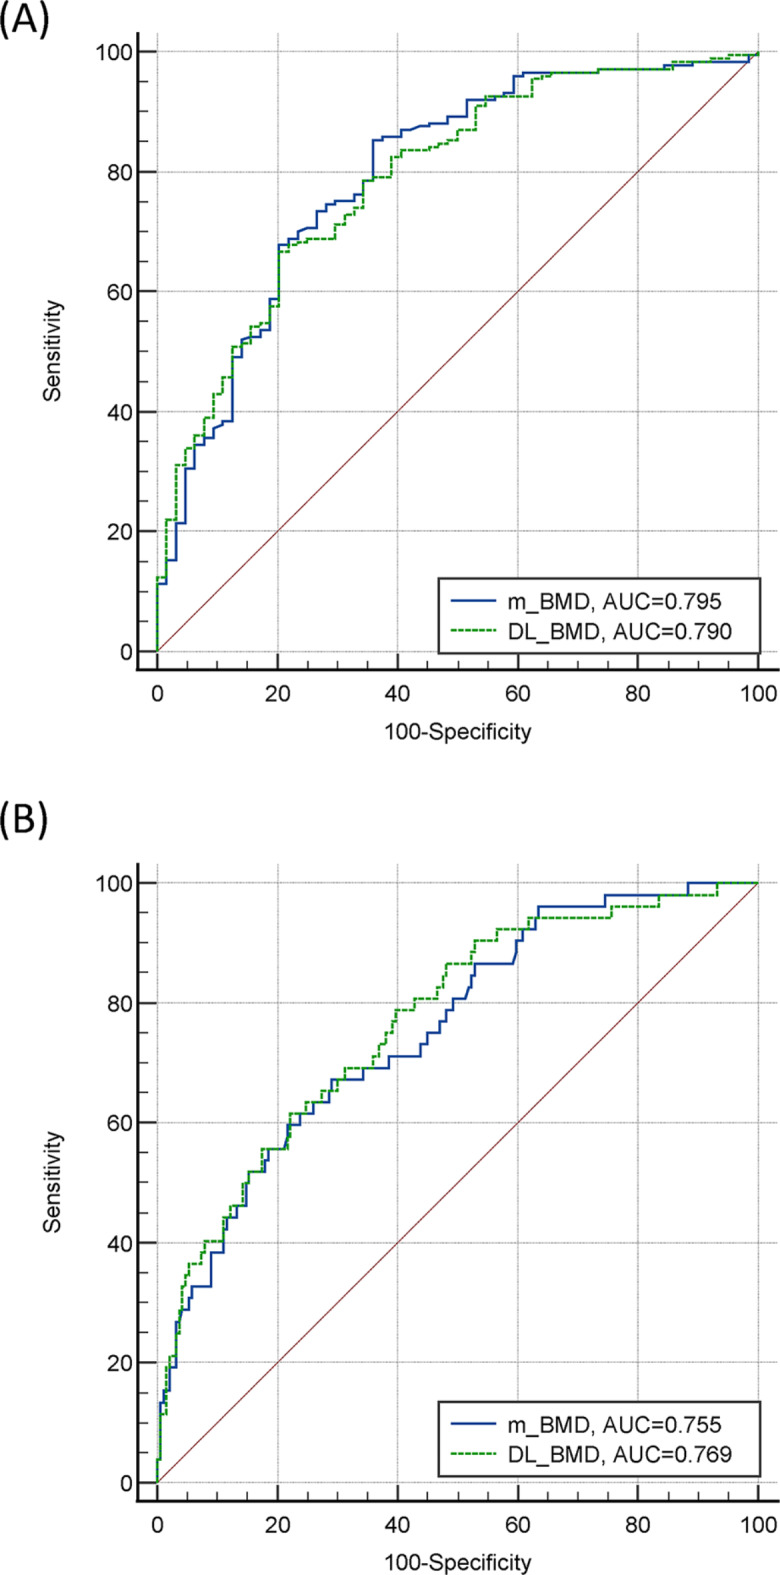
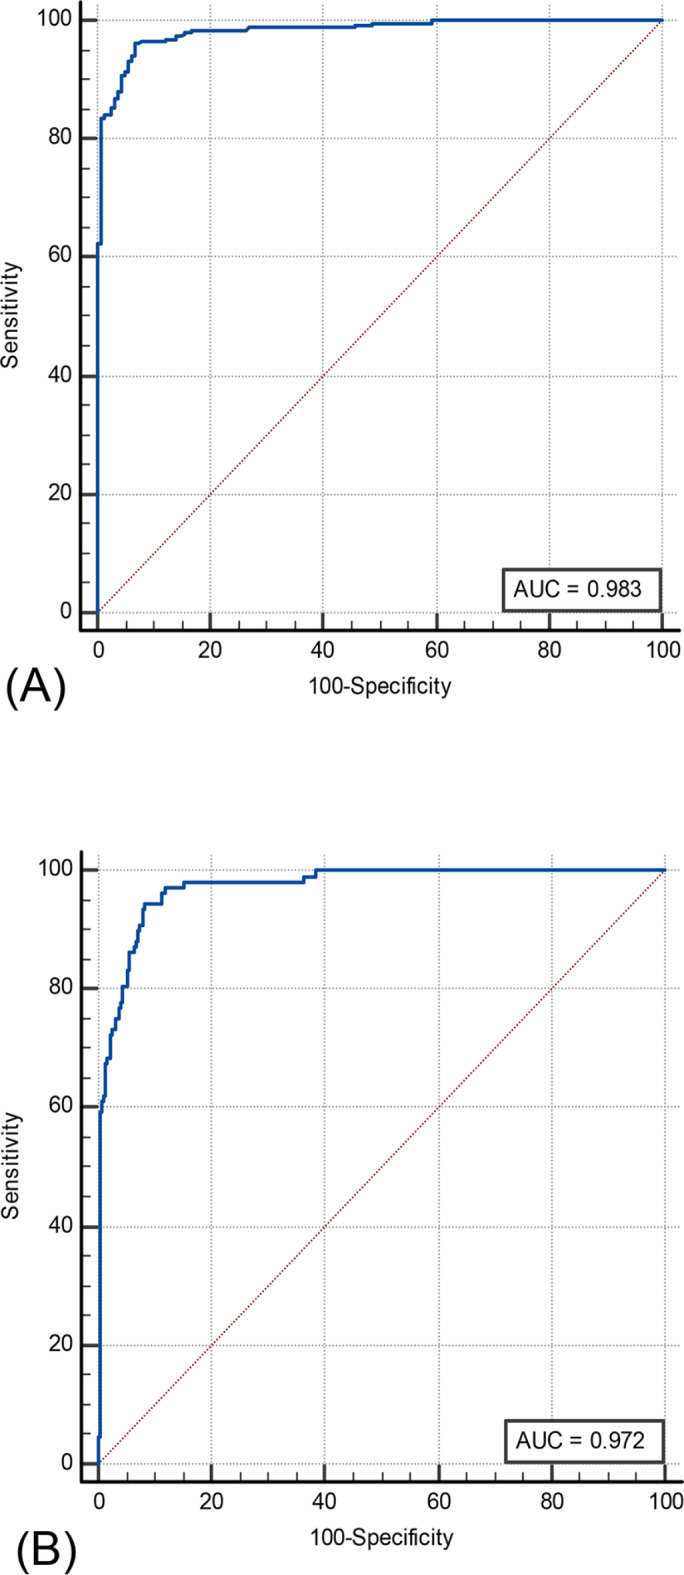
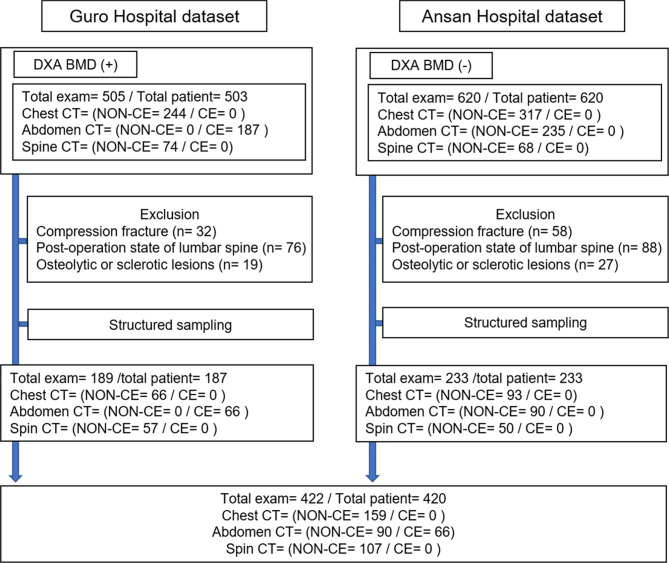
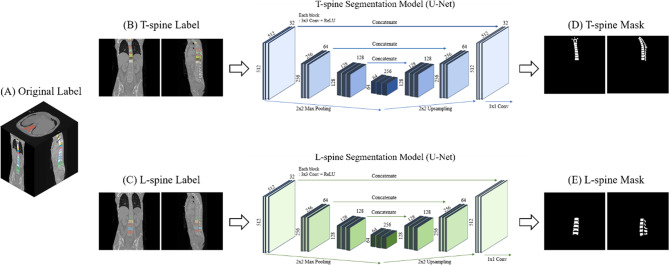
This retrospective study examined the diagnostic efficacy of automated deep learning-based bone mineral density (DL-BMD) measurements for osteoporosis screening using 422 CT datasets from four vendors in two medical centers, encompassing 159 chest, 156 abdominal, and 107 lumbar spine datasets. DL-BMD values on L1 and L2 vertebral bodies were compared with manual BMD (m-BMD) measurements using Pearson's correlation and intraclass correlation coefficients. Strong agreement was found between m-BMD and DL-BMD in total CT scans (r = 0.953, p < 0.001). The diagnostic performance of DL-BMD was assessed using receiver operating characteristic analysis for osteoporosis and low BMD by dual-energy x-ray absorptiometry (DXA) and m-BMD. Compared to DXA, DL-BMD demonstrated an AUC of 0.790 (95% CI 0.733-0.839) for low BMD and 0.769 (95% CI 0.710-0.820) for osteoporosis, with sensitivity, specificity, and accuracy of 80.8% (95% CI 74.2-86.3%), 56.3% (95% CI 43.4-68.6%), and 74.3% (95% CI 68.3-79.7%) for low BMD and 65.4% (95% CI 50.9-78.0%), 70.9% (95% CI 63.8-77.3%), and 69.7% (95% CI 63.5-75.4%) for osteoporosis, respectively. Compared to m-BMD, DL-BMD showed an AUC of 0.983 (95% CI 0.973-0.993) for low BMD and 0.972 (95% CI 0.958-0.987) for osteoporosis, with sensitivity, specificity, and accuracy of 97.3% (95% CI 94.5-98.9%), 85.2% (95% CI 78.8-90.3%), and 92.7% (95% CI 89.7-95.0%) for low BMD and 94.4% (95% CI 88.3-97.9%), 89.5% (95% CI 85.6-92.7%), and 90.8% (95% CI 87.6-93.4%) for osteoporosis, respectively. The DL-based method can provide accurate and reliable BMD assessments across diverse CT protocols and scanners.
Keywords: Bone density; Deep learning; Osteoporosis; Tomography; X-Ray computed.
© 2024. The Author(s).
Conflict of interest statement
The authors declare no competing interests.
Figures
References
MeSH terms
Grants and funding
- 20010927/The Ministry of Trade, Industry & Energy (MOTIE, Korea)
- NTIS#1415169348/The Ministry of Trade, Industry & Energy (MOTIE, Korea)
- S2844049/the Ministry of Small and Medium-sized Enterprises (SMEs) and Startups (MSS, Korea)
- NTIS #1425142385/the Ministry of Small and Medium-sized Enterprises (SMEs) and Startups (MSS, Korea)
LinkOut - more resources
Full Text Sources
Medical
