

Profiling of urinary extracellular vesicle protein signatures from patients with cribriform and intraductal prostate carcinoma in a cross-sectional study
- PMID: 39443544
- PMCID: PMC11500006
- DOI: 10.1038/s41598-024-75272-w
Profiling of urinary extracellular vesicle protein signatures from patients with cribriform and intraductal prostate carcinoma in a cross-sectional study
Abstract
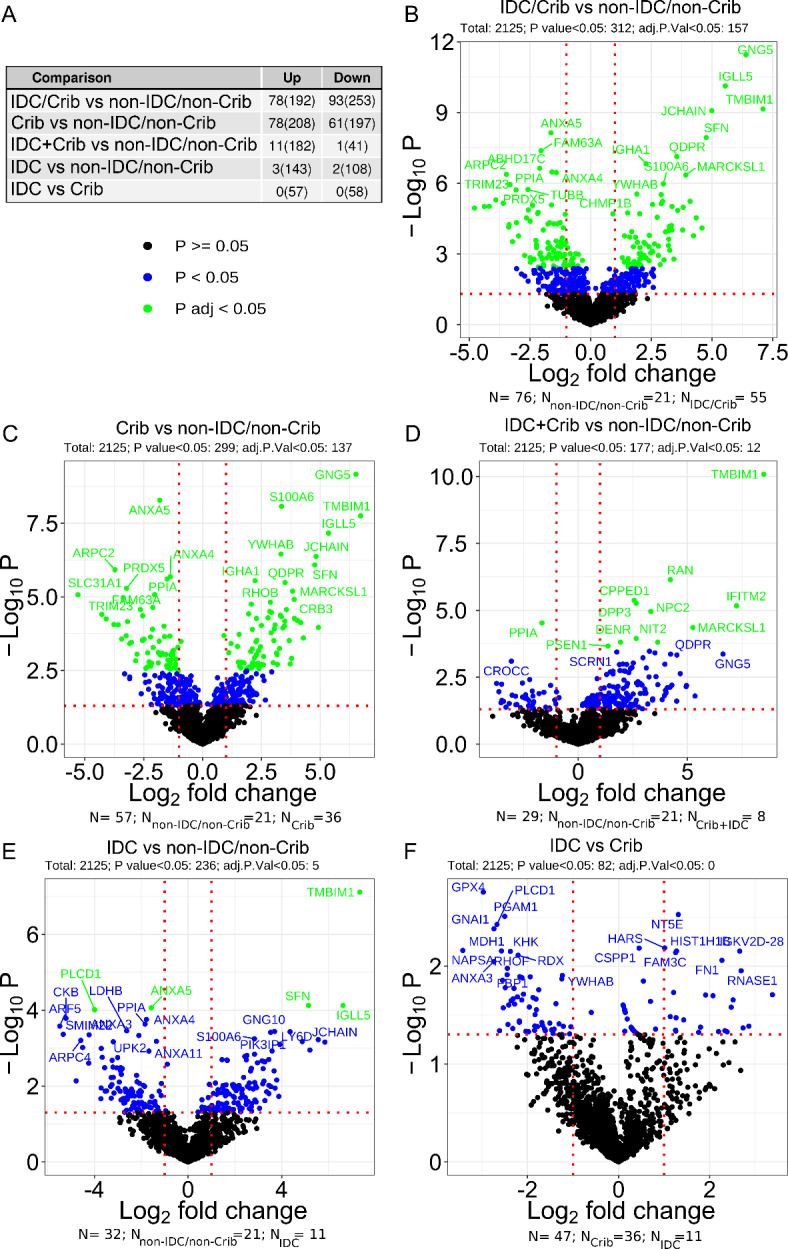
Prognostic tests and treatment approaches for optimized clinical care of prostatic neoplasms are an unmet need. Prostate cancer (PCa) and derived extracellular vesicles (EVs) proteome changes occur during initiation and progression of the disease. PCa tissue proteome has been previously characterized, but screening of tissue samples constitutes an invasive procedure. Consequently, we focused this study on liquid biopsies, such as urine samples. More specifically, urinary small extracellular vesicle and particles proteome profiles of 100 subjects were analyzed using liquid chromatography coupled to high-resolution mass spectrometry (LC-MS/MS). We identified 171 proteins that were differentially expressed between intraductal prostate cancer/cribriform (IDC/Crib) and non-IDC/non-Crib after correction for multiple testing. However, the strong correlation between IDC/Crib and Gleason Grade complicates the disentanglement of the underlying factors driving this association. Nevertheless, even after accounting for multiple testing and adjusting for ISUP (International Society of Urological Pathology) grading, two proteins continued to exhibit significant differential expression between IDC/Crib and non-IDC/non-Crib. Functional enrichment analysis based on cancer hallmark proteins disclosed a clear pattern of androgen response down-regulation in urinary EVs from IDC/Crib compared to non-IDC/non-Crib. Interestingly, proteome differences between IDC and cribriform were more subtle, suggesting high proteome heterogeneity. Overall, the urinary EV proteome reflected partly the prostate pathology.
Keywords: Cribriform; Intraductal prostate carcinoma; Liquid chromatography mass spectrometry; Proteomics; Urinary extracellular vesicles and particles.
© 2024. The Author(s).
Conflict of interest statement
The authors of this research paper declare the existence of a potential conflict of interest due to the submission of a provisional patent application related to the published data.
Figures


References
-
- Sung, H. et al. Global cancer statistics 2020: GLOBOCAN Estimates of incidence and mortality worldwide for 36 cancers in 185 countries. CA Cancer J. Clin.71, 209–249. 10.3322/caac.21660 (2021). - PubMed
-
- Bernardino, R. M. et al. Prostate cancer with cribriform pattern: Exclusion criterion for active surveillance?. Arch. Ital. Urol. Androl. Organo Ufficiale [di] Soc. Ital. Ecogr. Urol. Nefrol.10.4081/aiua.2020.3.235 (2020). - PubMed
-
- Masoomian, M. et al. Concordance of biopsy and prostatectomy diagnosis of intraductal and cribriform carcinoma in a prospectively collected data set. Histopathology74, 474–482. 10.1111/his.13747 (2019). - PubMed
-
- Truong, M. et al. Impact of gleason subtype on prostate cancer detection using multiparametric magnetic resonance imaging: Correlation with final histopathology. J. Urol.198, 316–321. 10.1016/j.juro.2017.01.077 (2017). - PubMed
-
- Bernardino, R. & Fleshner, N. Re: Sensitivity of multiparametric MRI and targeted biopsy for detection of adverse pathologies (cribriform gleason pattern 4 and intraductal carcinoma): Correlation of detected and missed prostate cancer foci with whole mount histopathology. Eur. Urol.10.1016/j.eururo.2023.01.028 (2023). - PubMed
MeSH terms
Substances
Grants and funding
- UIDB/04462/2020 and UIDP/04462/2020/iNOVA4Health
- UIDB/04462/2020 and UIDP/04462/2020/iNOVA4Health
- UIDB/04462/2020 and UIDP/04462/2020/iNOVA4Health
- 2022.13386.BD/Fundação para a Ciência e a Tecnologia
- 10.54499/DL57/2016/CP1457/CT0013/Fundação para a Ciência e a Tecnologia
- 10.54499/CEECIND/03906/2017/CP1421/CT0004/Fundação para a Ciência e a Tecnologia
- PTDC/BTM-TEC/1746/2021/Portuguese Foundation for Science and Technology
- PTDC/BTM-TEC/1746/2021/Portuguese Foundation for Science and Technology
- CA20113388/COST Action "PROTEOCURE
- CA20113388/COST Action "PROTEOCURE
- n° 101079264/Horizon2020 GA, EVCA
- n° 101079264/Horizon2020 GA, EVCA
LinkOut - more resources
Full Text Sources
Medical
