. 2024 Oct 23;7(1):1377.
doi: 10.1038/s42003-024-07085-6.

Diversity and distribution of a prevalent Microviridae group across the global oceans

Affiliations

Diversity and distribution of a prevalent Microviridae group across the global oceans

Ying Wu et al. Commun Biol. .

Abstract

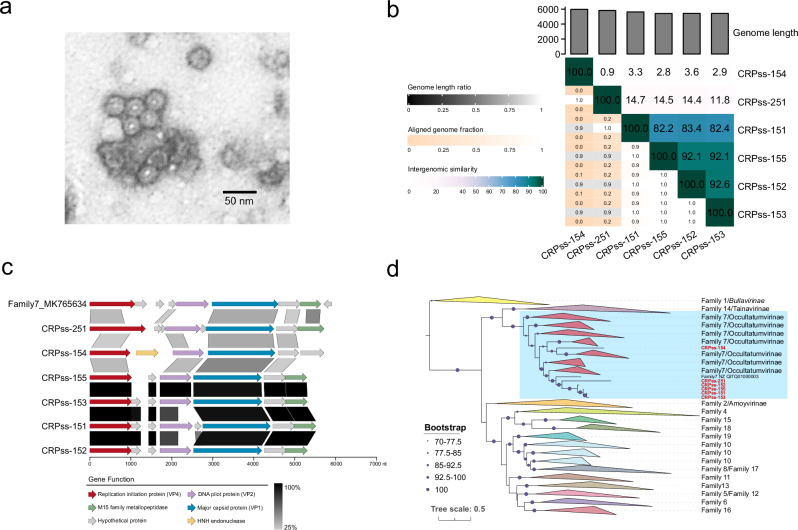
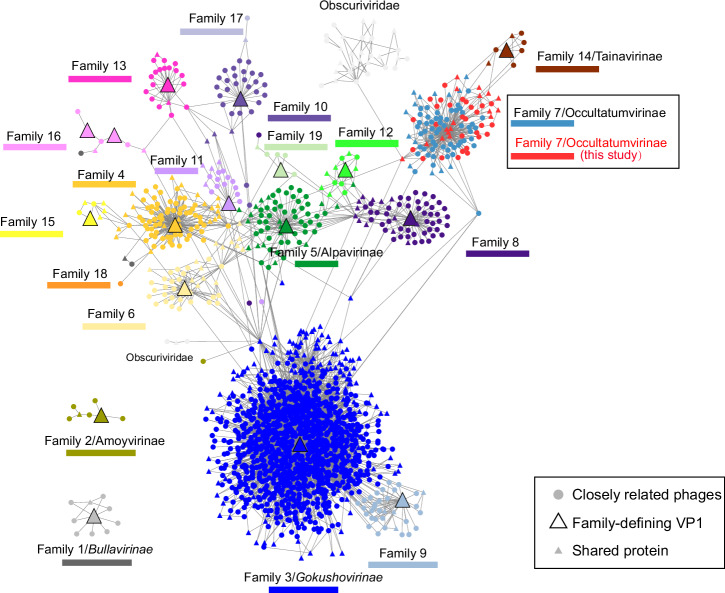
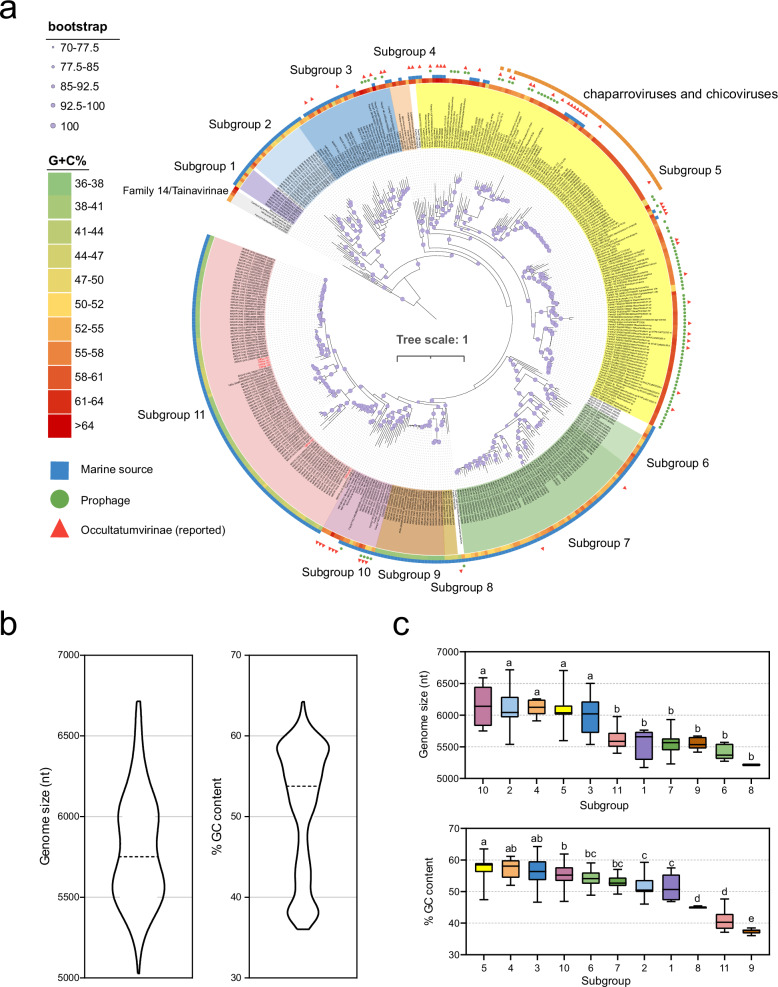
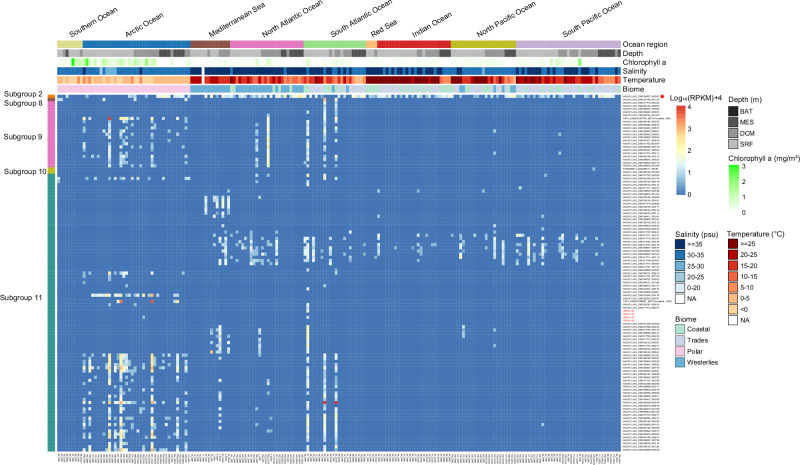
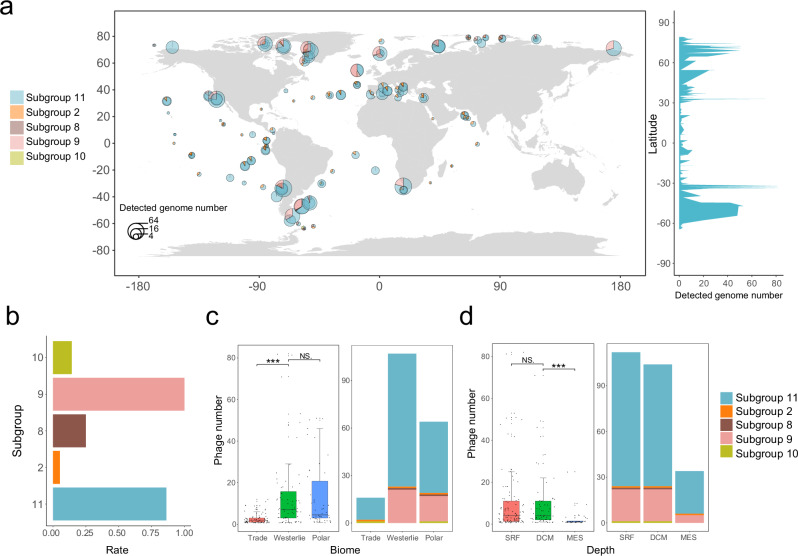
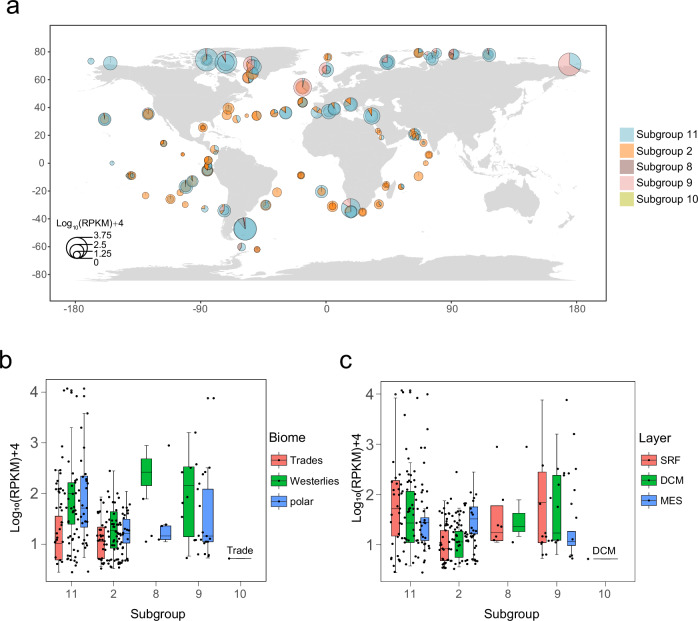
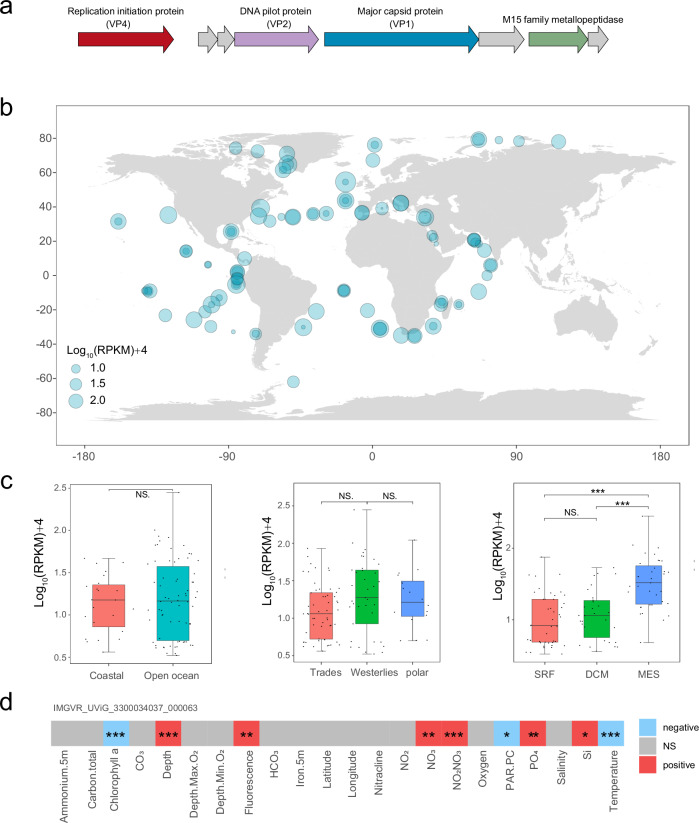
Small single-stranded DNA phages of the Microviridae family are diverse and prevalent in oceans. Our understanding of Microviridae phages that infect the ecologically important marine Roseobacter is currently limited, comprising few isolates. Here, we report six roseophages that infect Roseobacter RCA strains. Genomic and phylogenetic analyses revealed that they were new members of the previously identified subfamily Occultatumvirinae. Additionally, 232 marine uncultivated virus genomes (UViGs) affiliated to Occultatumvirinae were obtained from environmental genome datasets. Phylogenomic analysis revealed that marine Occultatumvirinae phages could be further grouped into 11 subgroups. Moreover, meta-omics based read-mapping analysis showed that Occultatumvirinae phages were globally distributed, with two low G + C subgroups showing the most prevalent distribution. Furthermore, one phage in subgroup 2 was found to be extremely ubiquitous. Overall, this study expands our understanding of the diversity and ecology of the Occultatumvirinae microviruses in the ocean and highlights their ecological impacts.


Conflict of interest statement

The authors declare no competing interest.

Figures

Fig. 1
Fig. 1. Morphology, genomic comparison and phylogeny of the six roseophages.
a The virion morphology of roseophage CRPss-151 determined by transmission electron microscopy. b Heatmap presentation of the paired comparisons of intergenomic similarity values among the six roseophages. c Genomic organization and comparison of six RCA roseophages and a related Occultatumvirinae/Family 7 microvirus (Family7_MK765587). Predicted open reading frames (ORFs) are indicated by arrows which are color coded by their putative biological functions. The color of the shading connecting homologous genes indicates of amino acid identity level between the genes. d Maximum-likelihood phylogenetic tree based on concatenated amino acid sequences of VP1 and VP4. The reference microvirus sequences from different families were retrieved from two previous publications,. The term “Family” refer to taxonomic ranks proposed in ref. . Roseophages reported in this study are shown in red.
Fig. 2
Fig. 2. Roseophages and retrieved UViGs all belong to Occultatumvirinae/Family 7 via MOP-UP analysis.
Bipartite protein-sharing network analysis constructed by using the MOP-UP pipeline showing the classification of Occultatumvirinae members. Groups of related phages (circles) are connected by groups of shared proteins (triangles) at 30% amino acid identity. Red circles and triangles represent microviruses and proteins identified in this study, respectively. The term “Family” refer to taxonomic ranks proposed in ref. .
Fig. 3
Fig. 3. Phylogenomic analyses of Occultatumvirinae microviruses.
a Maximum-likelihood phylogenetic tree based on concatenated VP1 and VP4 sequences. Tainavirinae members are used as outgroup taxa for this analysis. Shading indicates the distinct subgroups. Roseophages reported in this study are shown in red. The G + C content is indicated. Marine source phages are indicated by blue rectangles. Prophages are marked in green circles. Members of Occultatumvirinae, as reported in the ref. , are indicated by red triangles. Chaparroviruses and chicoviruses are denoted by orange rectangles. b Violin plots showing the size, distribution, and G + C content of Occultatumvirinae genomes. c Boxplots showing the genome size and G + C content of each Occultatumvirinae subgroup (x-axis) in Occultatumvirinae. Different lowercase letters indicate the significant differences (P < 0.05) among subgroups.
Fig. 4
Fig. 4. Heatmaps showing the relative abundance of Occultatumvirinae phages at the species level in different marine metagenomes.
The relative abundance of phages was normalized as mapped read counts per kilobase pair of genomes per million read counts in the metagenome (RPKM), and the RPKM values were log-transformed (log10(RPKM) + 4). Roseophages reported in this study are shown in red and IMGVR_UViG_3300034037_000063 is indicated by a red asterisk. Abbreviations: BAT bathypelagic (>1000 m), MES mesopelagic (200–1000 m), DCM deep chlorophyll maximum (10–200 m), SRF surface (0–10 m).
Fig. 5
Fig. 5. The biogeographic distribution pattern of marine Occultatumvirinae phages across the global ocean.
a Distribution pattern of the Occultatumvirinae phages. The pie chart shows the number of phage genomes in each subgroup identified from marine environmental datasets (metagenomes and metatranscriptomes). b The proportion of phages in each subgroup identified from marine environmental datasets. c The number of Occultatumvirinae phages detected in different marine biomes. d The number of Occultatumvirinae phages detected in different depth zones. NS: not significant, *: p < 0.05, **: p < 0.01, ***: p < 0.001.
Fig. 6
Fig. 6. Distribution and relative abundance of different Occultatumvirinae subgroups in marine metagenomic dataset.
a Relative abundance of the Occultatumvirinae phages in a global metagenomic dataset. The RPKM values were log-transformed. b The log-transformed RPKM values (y-axis) of each Occultatumvirinae subgroup (x-axis) across distinct biomes. c The log-transformed RPKM values (y-axis) of each Occultatumvirinae subgroup (x-axis) at different depths.
Fig. 7
Fig. 7. One subgroup 2 member showed the most prevalent distribution.
a Genomic organization of IMGVR_UViG_3300034037_000063. b Biogeography of the subgroup 2 member IMGVR_UViG_3300034037_000063 in marine metagenomic dataset. c The log-transformed RPKM values of IMGVR_UViG_3300034037_000063 across various biomes and at different depth zones in global oceans. d Correlation analysis between the relative abundance in RPKM of IMGVR_UViG_3300034037_000063 and environmental parameters. NS: not significant, *: p < 0.05, **: p < 0.01, ***: p < 0.001.

Similar articles

References

    1. Wommack, K. E. & Colwell, R. R. Virioplankton: viruses in aquatic ecosystems. Microbiol. Mol. Biol. Rev.64, 69–114 (2000). - PMC - PubMed
    1. Suttle, C. A. Viruses in the sea. Nature437, 356–361 (2005). - PubMed
    1. Suttle, C. A. Marine viruses — major players in the global ecosystem. Nat. Rev. Microbiol.5, 801–812 (2007). - PubMed
    1. Fuhrman, J. A. Marine viruses and their biogeochemical and ecological effects. Nature399, 541–548 (1999). - PubMed
    1. Zimmerman, A. E. et al. Metabolic and biogeochemical consequences of viral infection in aquatic ecosystems. Nat. Rev. Microbiol.18, 21–34 (2020). - PubMed

LinkOut - more resources