. 2024 Oct 23;4(1):209.
doi: 10.1038/s43856-024-00630-8.

Oral and gut microbiome profiles in people with early idiopathic Parkinson's disease

Collaborators, Affiliations

Oral and gut microbiome profiles in people with early idiopathic Parkinson's disease

Keaton Stagaman et al. Commun Med (Lond). .

Abstract

Background: Early detection of Parkinson's disease (PD), a neurodegenerative disease with central and peripheral nerve involvement, ensures timely treatment access. Microbes influence nervous system health and are altered in PD.

Methods: We examined gut and mouth microbiomes from recently diagnosed patients in a geographically diverse, matched case-control, shotgun metagenomics study.

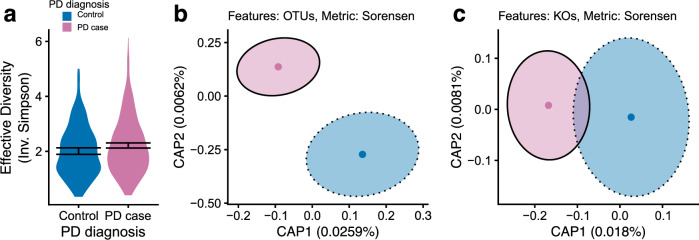
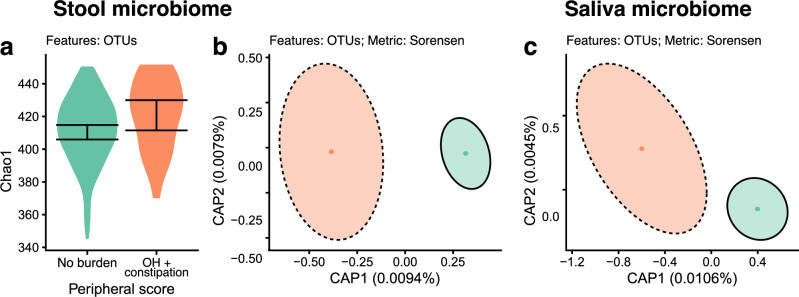
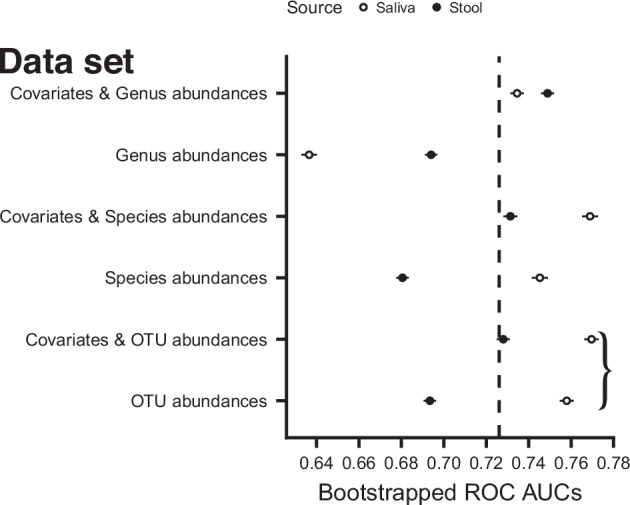
Results: Here, we show greater alpha-diversity in 445 PD patients versus 221 controls. The microbial signature of PD includes overabundance of 16 OTUs, including Streptococcus mutans and Bifidobacterium dentium, and depletion of 28 OTUs. Machine learning models indicate that subspecies level oral microbiome abundances best distinguish PD with reasonably high accuracy (area under the curve: 0.758). Microbial networks are disrupted in cases, with reduced connectivity between short-chain fatty acid-producing bacteria the the gut. Importantly, microbiome diversity metrics are associated with non-motor autonomic symptom severity.

Conclusions: Our results provide evidence that predictive oral PD microbiome signatures could possibly be used as biomarkers for the early detection of PD, particularly when there is peripheral nervous system involvement.

Plain language summary

Parkinson’s disease (PD) is a neurodegenerative disease that is characterized by both motor symptoms, such as tremors, and non-motor symptoms, such as constipation. Our aim was to determine whether there were differences in the number and types of microbes living in the saliva and intestines of people with and without PD. We saw significant differences in the microbial communities living in healthy controls compared to people with PD. Additionally, we found that the proportions of microbe types in saliva were the best at distinguishing between controls and cases, and identified the specific kinds of microbes that were driving this distinction. These results highlight the potential importance of the saliva microbiome in understanding the causes and symptomatology of PD.


Conflict of interest statement

The authors declare the following competing interests: K.S., M.J.K., M.W., S.A., T.F.S., P.F., J.T., M.V.H., and L.N.K. are employed by and hold stock or stock options in 23andMe, Inc.

Figures

Fig. 1
Fig. 1. Stool alpha- and beta-diversity.
Stool microbiome associations between PD diagnosis and alpha- and beta-diversity. For all plots, blue indicates controls and pink indicates PD cases. a Violin plot showing the Chao1 diversity metric for controls (n = 221) and cases (n = 445). The black error bars represent the 95% C.I.s around the means. b Regression plot showing statistically significant association between PD diagnosis and scaled Chao1 alpha-diversity metric estimated from a logistic regression model that also included the selected covariates for stool OTUs (n = 666). The black line indicates the estimated association and the shaded area represents the standard error around the estimate. Covariate p-values can be found in Supplementary Table 1. c dbRDA ordination showing statistically significant association between PD diagnosis and Sørensen beta-diversity metric estimated from a PERMANOVA model that also included the selected covariates for stool OTUs. The points indicate the centroids for controls (n = 221) and cases (n = 445) and the ellipses indicate 95% C.I.s of the centroids. CAP in the axes stands for “constrained analysis of proximities” and indicates the axis is constrained by input variables. Covariate p-values can be found in Supplementary Table 2. d dbRDA ordination showing statistically significant association between PD diagnosis and Bray–Curtis beta-diversity metric estimated from a PERMANOVA model that also included the selected covariates for stool KOs (controls n = 221, cases n = 445). The points, ellipses, and axes titles indicate the same as for c. Covariate p-values can be found in Supplementary Table 3.
Fig. 2
Fig. 2. Saliva alpha- and beta-diversity.
Saliva microbiome associations between PD diagnosis and alpha- and beta-diversity. For all plots, blue indicates controls and pink indicates PD cases. a Violin plot showing the inverse Simpson diversity metric for controls (n = 220) and cases (n = 438). The black error bars represent the 95% C.I.s around the means. b dbRDA ordination showing statistically significant association between PD diagnosis and Sørensen beta-diversity metric estimated from a PERMANOVA model that also included the selected covariates for saliva OTUs. The points indicate the centroids for controls (n = 220) and cases (n = 438) and the ellipses indicate 95% C.I.s of the centroids. Covariate p-values can be found in Supplementary Table 7. c dbRDA ordination showing statistically significant association between PD diagnosis and Sørensen beta-diversity metric estimated from a PERMANOVA model that also included the selected covariates for saliva KOs (controls n = 204, cases n = 399). The points and ellipses indicate the same as for (b). Covariate p-values can be found in Supplementary Table 8.
Fig. 3
Fig. 3. Peripheral scores within PD cases.
Association microbiome diversity metrics and severity of peripheral autonomic dysfunction for PD cases. a A violin plot of stool microbiome Chao1 scores for peripheral scores of no symptoms (green, n = 98) and orthostatic hypotension (OH) and constipation (orange, n = 22). b dbRDA ordination of Sørensen distances for stool microbiomes of PD participants with no peripheral burden (green, n = 92) or OH + constipation (orange, n = 22). Points show the group centroids and ellipses denote 95% C.I.s around the centroids. c dbRDA ordination of Sørensen distances for saliva microbiomes of PD participants with no peripheral burden (green, n = 95) or OH + constipation (orange, n = 21). Points show the group centroids and ellipses denote 95% C.I.s around the centroids.
Fig. 4
Fig. 4. OTU networks.
Microbe-microbe (OTU level) abundance association networks for saliva and stool, and controls and PD cases. The networks in the top row are for stool OTUs in controls (a) and PD cases (b). The networks on the bottom row are for saliva OTUs in controls (d) and PD cases (e). Each point represents an individual OTU, and the size of the point indicates its degree centrality metric. The colored points are for OTUs that have a top 10 degree metric for that specific community (e.g., saliva controls), to highlight the most connected taxa in each network. The color within these points represents the OTU’s taxonomic family. The lines connecting points indicate statistically significant associations in their abundances as determined by the spiec-easi method. The lines are colored and scaled by the absolute value of their correlation coefficient with darker and wider indicating greater correlation magnitude. Solid lines indicate positive correlations, dashed lines indicate negative correlations. The density plots to the right of the networks, for stool (c) and saliva (f) show the distributions of degree centralities for each OTU (node) in the networks. The lines indicate the mean degree for controls (blue) and cases (pink). An asterisk indicates a significant difference in degree between controls and cases, and an “n.s.” indicates no significant difference.
Fig. 5
Fig. 5. Between microbiomes networks.
Microbe-microbe (OTU level) abundance association networks between saliva and stool for controls and PD cases. a The network for controls. b The network for PD cases. Each point represents an individual OTU, and the size of the point indicates its degree centrality metric. The colored points are for OTUs that have a top 10 degree metric for that specific community (e.g., saliva controls), to highlight the most connected taxa in each network. The color within the point represents the OTU’s taxonomic family and its shape indicates whether it was sampled from the saliva (circle) or stool (square). The lines connecting points indicate statistically significant associations in their abundances as determined by the spiec-easi method. The lines are colored and scaled by the absolute value of their correlation coefficient with darker and wider indicating greater correlation magnitude. Solid lines indicate positive correlations, dashed lines indicate negative correlations. c A density plot showing the distributions of degree centralities for each OTU (node) in the networks.
Fig. 6
Fig. 6. Differential abundant taxa.
Significant differentially abundant OTU-level microbial taxa. Bars indicate centered-log transformed log2-fold difference in abundance between controls (toward left [negative], n = 221) and PD cases (towards right [positive], n = 445). Significance was assessed with two tests (ANCOMBC2 and ALDEx2). a Taxa from the stool microbiome. b Taxa from the saliva microbiome. Taxa are ordered by relative differential abundance and the bars are colored by taxonomic family (controls n = 220, cases n = 438). Exact p-values for all OTUs can be found in Supplemental Data 2.
Fig. 7
Fig. 7. Random forest performance.
Model performance for random forest classifiers. Random forest models were built using a variety of input data sets. As a baseline, answers to survey questions were used. The points above represent the mean ROC AUCs and the line segments represent the standard error around these means. The dashed vertical line represents the mean ROC AUC for the baseline data set, i.e., the survey answers alone. The white points indicate the mean ROC AUCs for the saliva taxonomic abundances, and the black points for the stool taxonomic abundances. The y-axis identifies the data sets included in these analyses, and the bracket highlights the two best performing models with and without covariates in the data set.

References

    1. Saper, C. B. The central autonomic nervous system: conscious visceral perception and autonomic pattern generation. Annu. Rev. Neurosci.25, 433–469 (2002). - PubMed
    1. Browning, K. N. Stress‐induced modulation of vagal afferents. Neurogastroenterol. Motil.31, e13758 (2019). - PMC - PubMed
    1. Powley, T. L. et al. Vagal innervation of the stomach reassessed: brain−gut connectome uses smart terminals. Ann. N. Y. Acad. Sci.1454, 14–30 (2019). - PMC - PubMed
    1. Heintz-Buschart, A. et al. The nasal and gut microbiome in Parkinson’s disease and idiopathic rapid eye movement sleep behavior disorder. Mov. Disord.33, 88–98 (2018). - PMC - PubMed
    1. Palacios, N. et al. Metagenomics of the gut microbiome in Parkinson’s disease: prodromal changes. Ann. Neurol.94, 486–501 (2023). - PMC - PubMed

LinkOut - more resources