. 2024 Oct 23;7(1):1380.
doi: 10.1038/s42003-024-07077-6.

Deficiencies in corin and atrial natriuretic peptide-mediated signaling impair endochondral ossification in bone development

Affiliations

Deficiencies in corin and atrial natriuretic peptide-mediated signaling impair endochondral ossification in bone development

Zibin Zhou et al. Commun Biol. .

Abstract

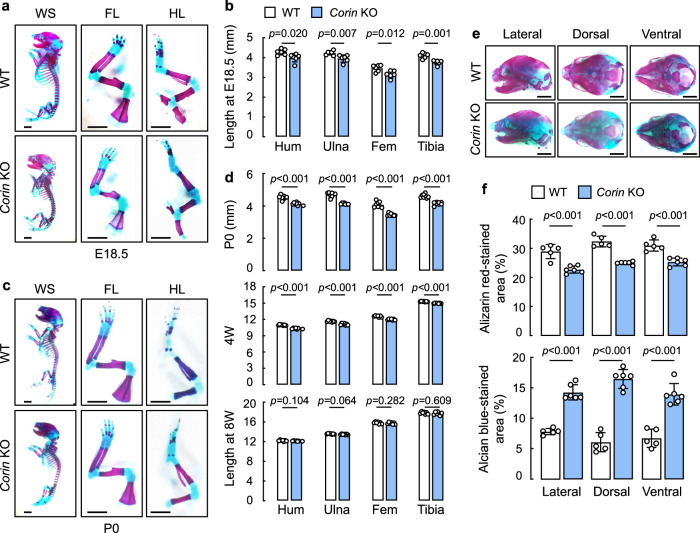
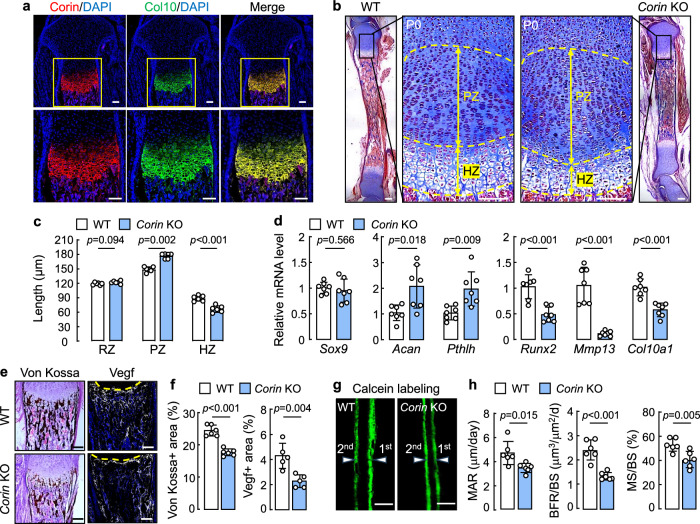
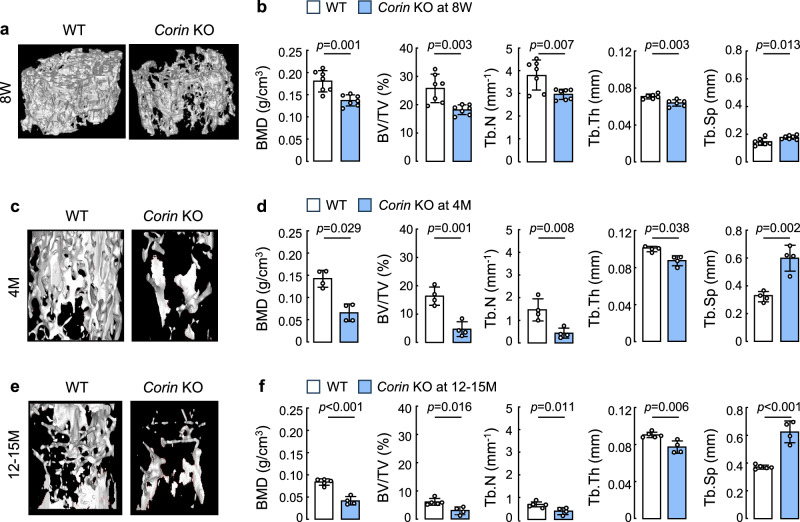
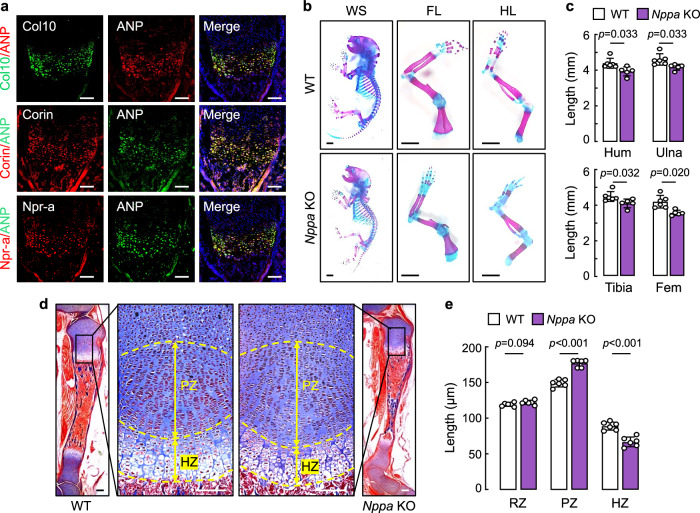
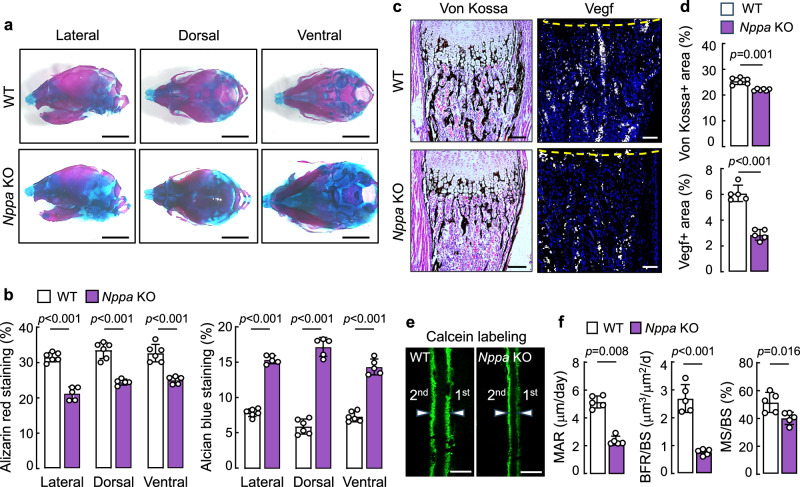
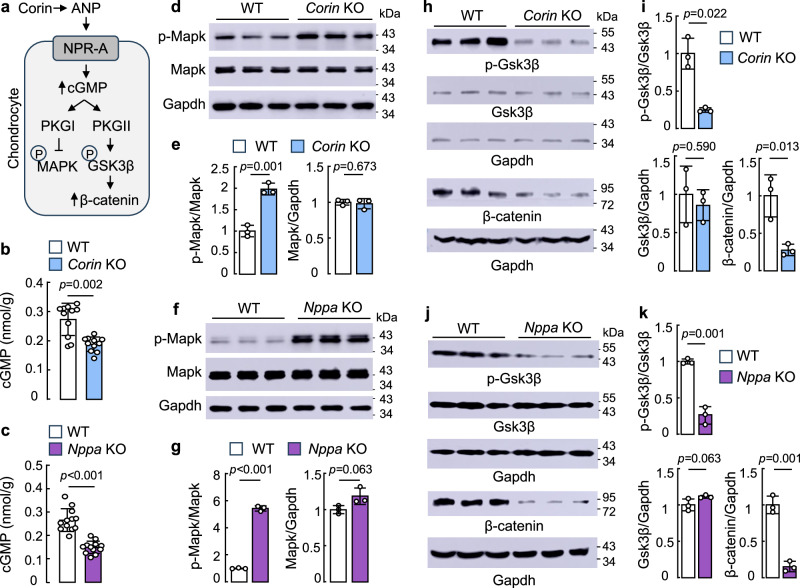
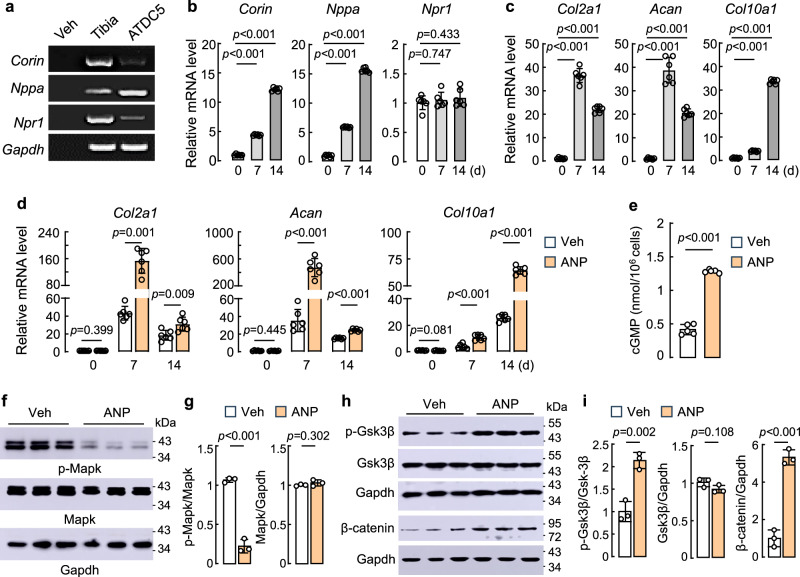
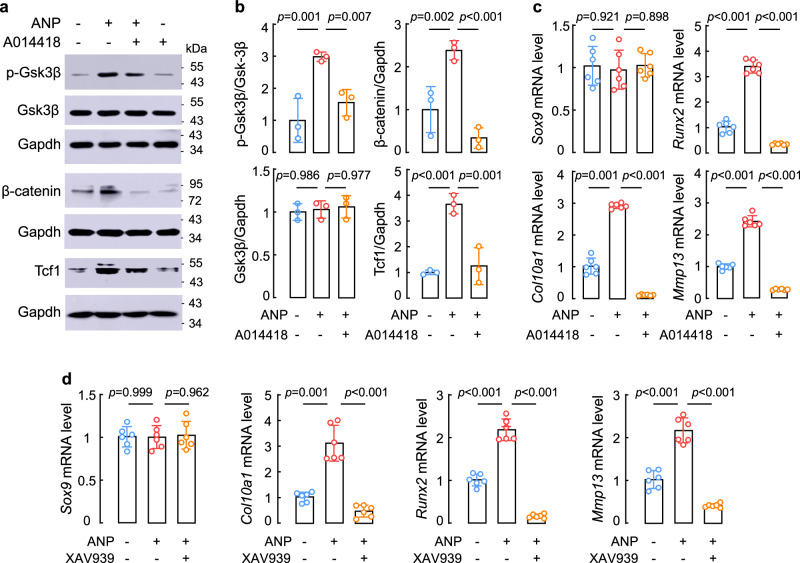
Corin is a protease that activates atrial natriuretic peptide (ANP), a hormone in cardiovascular homeostasis. Structurally, ANP is similar to C-type natriuretic peptide (CNP) crucial in bone development. Here, we examine the role of corin and ANP in chondrocyte differentiation and bone formation. We show that in Corin and Nppa (encoding ANP) knockout (KO) mice, chondrocyte differentiation is impaired, resulting in shortened limb long bones. In adult mice, Corin and Nppa deficiency impairs bone density and microarchitecture. Molecular studies in cartilages from newborn Corin and Nppa KO mice and in cultured chondrocytes indicate that corin and ANP act in chondrocytes via cGMP-dependent protein kinase G signaling to inhibit mitogen-activated protein kinase phosphorylation and stimulate glycogen synthase kinase-3β phosphorylation and β-catenin upregulation. These results indicate that corin and ANP signaling regulates chondrocyte differentiation in bone development and homeostasis, suggesting that enhancing ANP signaling may improve bone quality in patients with osteoporosis.


Conflict of interest statement

The authors declare no competing interests.

Figures

Fig. 1
Fig. 1. Analysis of skeletons and limb long bones in Corin KO mice.
a,c Whole skeletons (WS), forelimbs (FL), and hindlimbs (HL) from E18.5 (a) and newborn (P0) (c) WT and Corin KO mice were stained with Alizarin red (mineralized bone) and Alcian blue (cartilage). Images are representative of at least six mice per group. b,d Humeral (Hum), ulnar, femoral (Fem), and tibial lengths were measured in E18.5 (b), P0, 4-week (4 W)-, and 8W-old (d) WT and Corin KO mice. n = 6–8 per group. Data are mean ± SD and analyzed by unpaired Student’s t test. e Skulls from E18.5 WT and Corin KO mice were stained with Alizarin red and Alcian blue. Representative lateral, dorsal, and ventral skull views were from 5–6 mice per group. Scale bars = 2 mm. f Alizarin red and Alcian blue stained areas in skull lateral, dorsal, and ventral views were quantified. Data are mean ± SD and analyzed by unpaired Student’s t test. n = 5–6 per group.
Fig. 2
Fig. 2. Corin expression in the growth plate and effects of Corin deficiency on bone formation.
a Co-staining of tibial corin and Col10 proteins in newborn WT mice. Scale bars = 100 μm. Images are representative of 3 experiments. b Masson’s trichrome staining of tibial sections from newborn WT and Corin KO mice. Proliferative zone (PZ) and hypertrophic zone (HZ) are indicated. Scale bars = 100 μm. c Reserve zone (RZ), PZ, and HZ lengths (mean ± SD) in newborn WT and Corin KO mice analyzed by unpaired Student’s t test. n = 6 per group. d mRNA expression in proximal tibial hyalin cartilages from newborn WT and Corin KO mice analyzed by qPCR. Data (mean ± SD) were analyzed by unpaired Student’s t test. n = 7 per group. e Von Kossa and Vegf protein staining of tibial sections from newborn WT and Corin KO mice. Scale bars = 100 μm. f Quantified data (mean ± SD) of von Kossa and Vegf protein staining were analyzed by unpaired Student’s t test. n = 5–6 per group. g,h Calcein labeling in the femoral cortical compartments from 3W-old WT and Corin KO mice. Green labeling from 1st and 2nd injections are indicated. Scale bars = 100 μm (g). Values (mean ± SD) of mineral apposition rate (MAR), bone formation rate over bone surface (BFR/BS), and mineralized surface over bone surface (MS/BS) were analyzed by unpaired Student’s t test. n = 6 per group (h).
Fig. 3
Fig. 3. MicroCT analysis of bone density and microstructure in adult Corin KO mice.
af Femurs from male WT and Corin KO mice at 8 weeks (8 W) (a,b), 4 months (4 M) (c,d), and 12–15 months (12–15 M) (e,f) of age were analyzed by microCT. Representative reconstructed 3D-images of femoral segments from 8W- (a), 4M- (c), and 12-15M-old (e) WT and Corin KO mice are shown. Values (mean ± SD) of bone mineral density (BMD), bone volume to tissue volume ratio (BV/TV), trabecular number (Tb.N), trabecular thickness (Tb.Th), and trabecular separation (Tb.Sp) were analyzed by unpaired Student’s t test or nonparametric Mann–Whitney test. n = 4–7 per group.
Fig. 4
Fig. 4. ANP and Npr-a expression in the growth plate and effects of Nppa deficiency on bone formation.
a Co-staining of ANP with Col10, corin, or Npr-a proteins in tibial sections from newborn WT mice. Scale bars = 100 μm. Images are representative of three experiments. b Whole skeletons (WS), forelimbs (FL), and hindlimbs (HL) from newborn WT and Nppa KO mice were stained with Alizarin red and Alcian blue. Images are representative of at least five experiments. Scale bars = 2 mm. c Values of humeral (Hum), ulnar, tibial, and femoral (Fem) lengths were analyzed by unpaired Student’s t test. n = 5–6 per group. d Proliferative zone (PZ) and hypertrophic zone (HZ) in tibial growth plates from newborn WT and Nppa KO mice are indicated. Scale bars = 100 μm. e Values of reserve zone (RZ), PZ, and HZ lengths (mean ± SD) in WT and Nppa KO mice were analyzed by unpaired Student’s t test. n = 6 per group.
Fig. 5
Fig. 5. Analysis of bone phenotype in Nppa KO mice.
a Skulls from newborn WT and Nppa KO mice were stained with Alizarin red and Alcian blue. Representative lateral, dorsal, and ventral skull views were from 5–6 mice per group. Scale bars = 2 mm. b Alizarin red and Alcian blue stained areas in skull lateral, dorsal, and ventral views were quantified. Data (mean ± SD) were analyzed by unpaired Student’s t test. n = 5–6 per group. cd Von Kossa and Vegf protein staining of tibial sections from newborn WT and Nppa KO mice (c). Quantified data (mean ± SD) (d) were analyzed by unpaired Student’s t test. n = 5–6 per group. e,f Calcein double labeling in femoral sections from 3W-old WT and Nppa KO mice. Green labeling from 1st and 2nd injections are indicated. Scale bars = 100 μm (e). Values (mean ± SD) of MAR, BFR/BS, MS/BS were analyzed by unpaired Student’s t test. n = 5 per group (f).
Fig. 6
Fig. 6. Analysis of corin and ANP-mediated signaling in tibias from Corin and Nppa KO mice.
a A model of corin and ANP-mediated signaling in chondrocytes. P: phosphorylation. b,c cGMP levels in tibial homogenates from newborn WT and Corin (b) or Nppa (c) KO mice. n = 11–12 per group. dk Western blotting of p-Mapk, Mapk (dg), p-Gsk-3β, Gsk-3β, and β-catenin (hk) proteins in tibial cartilage homogenates from newborn WT and Corin (d,e,h,i) or Nppa (f,g,j,k) KO mice. Gapdh was a protein loading control. Protein bands on western blots were quantified. Quantitative data (mean ± SD) were analyzed by unpaired Student’s t test. n = 3 per group.
Fig. 7
Fig. 7. Analysis of corin and ANP-mediated signaling in ATDC5 cells.
a RT-PCR analysis of Corin, Nppa, and Npr1 mRNAs in tibias from newborn WT mice (control) and ATDC5 cells. As a negative control, vehicle (Veh), instead of cDNA templates, was used in the reaction. b,c Relative Corin, Nppa, Npr1 (b), Col2a1, Acan, and Col10a1 (c) mRNA levels in ATDC5 cells before (0) or 7 and 14 days (d) with the induction medium were quantified by qPCR. d Relative Col2a1, Acan, and Col10a1 mRNA levels in ATDC5 cells before (0) or 7 and 14 d in the induction medium without (Veh) or with ANP (100 nM). n = 6 per group. e Intracellular cGMP levels measured by ELISA. n = 5 per group. f-i Western blotting of p-Mapk, Mapk (f,g), p-Gsk-3β, Gsk-3β, and β-catenin (h,i) proteins in ATDC5 cells after 7 days in the induction medium without (Veh) or with ANP. n = 3 per group. Quantitative data (mean ± SD) (g,i) were analyzed by unpaired Student’s t test.
Fig. 8
Fig. 8. Effects of Gsk3β and β-catenin inhibitors on ANP signaling and chondrogenic responses in ATDC5 cells.
a,b Western blotting of p-Gsk3β, Gsk3β, β-catenin, and T-cell factor 1 (Tcf1) proteins in ATDC5 cells cultured without (−) or with (+) ANP (100 nM), AR-A014418 (GSK3β inhibitor) (10 μM), and/or XAV939 (β-catenin inhibitor) (10 μM) (a). Protein bands on western blots were analyzed by densitometry (b). Quantitative data (mean ± SD) were analyzed by one-way ANOVA. n = 3 per group. c,d Relative Sox9, Col10a1, Runx2, and Mmp13 mRNA levels in ATDC5 cells after 7 days in the induction medium without (−) or with (+) ANP, AR-A014418 (c), and/or XAV939 (d). n = 6 per group. Quantitative data (mean ± SD) were analyzed by one-way ANOVA.

Similar articles

Cited by

References

    1. Kronenberg, H. M. Developmental regulation of the growth plate. Nature423, 332–336 (2003). - PubMed
    1. Kozhemyakina, E., Lassar, A. B. & Zelzer, E. A pathway to bone: signaling molecules and transcription factors involved in chondrocyte development and maturation. Development142, 817–831 (2015). - PMC - PubMed
    1. Salhotra, A., Shah, H. N., Levi, B. & Longaker, M. T. Mechanisms of bone development and repair. Nat. Rev. Mol. Cell Biol.21, 696–711 (2020). - PMC - PubMed
    1. Ortega, N., Behonick, D. J. & Werb, Z. Matrix remodeling during endochondral ossification. Trends Cell Biol.14, 86–93 (2004). - PMC - PubMed
    1. Dy, P. et al. The three SoxC proteins–Sox4, Sox11 and Sox12–exhibit overlapping expression patterns and molecular properties. Nucleic Acids Res36, 3101–3117 (2008). - PMC - PubMed

LinkOut - more resources