. 2024 Dec;43(50):3645-3659.
doi: 10.1038/s41388-024-03141-x. Epub 2024 Oct 23.

USP10 drives cancer stemness and enables super-competitor signalling in colorectal cancer

Affiliations

USP10 drives cancer stemness and enables super-competitor signalling in colorectal cancer

Michaela Reissland et al. Oncogene. 2024 Dec.

Erratum in

  • Correction: USP10 drives cancer stemness and enables super-competitor signalling in colorectal cancer.
    Reissland M, Hartmann O, Tauch S, Bugter JM, Prieto-Garcia C, Schulte C, Loebbert S, Solvie D, Bitman-Lotan E, Narain A, Jacomin AC, Schuelein-Voelk C, Fuss CT, Pahor N, Ade C, Buck V, Potente M, Li V, Beliu G, Wiegering A, Grossmann T, Eilers M, Wolf E, Maric H, Rosenfeldt M, Maurice MM, Dikic I, Gallant P, Orian A, Diefenbacher ME. Reissland M, et al. Oncogene. 2025 Feb;44(5):336. doi: 10.1038/s41388-024-03262-3. Oncogene. 2025. PMID: 39843564 Free PMC article. No abstract available.

Abstract

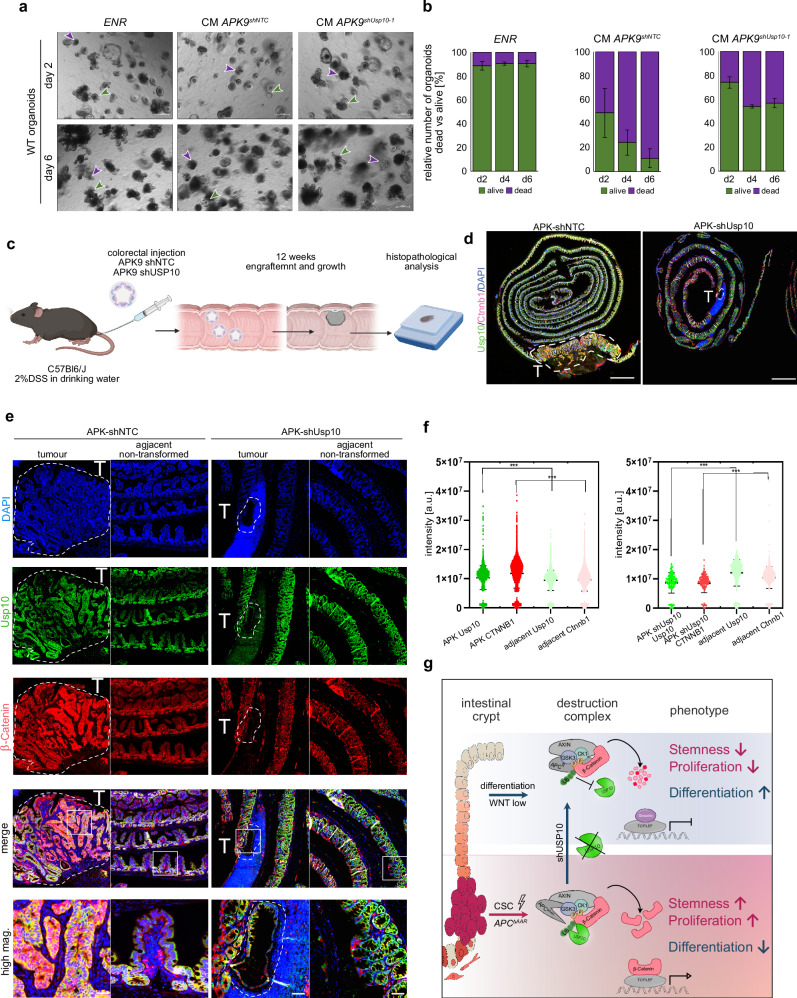
The contribution of deubiquitylating enzymes (DUBs) to β-Catenin stabilization in intestinal stem cells and colorectal cancer (CRC) is poorly understood. Here, and by using an unbiassed screen, we discovered that the DUB USP10 stabilizes β-Catenin specifically in APC-truncated CRC in vitro and in vivo. Mechanistic studies, including in vitro binding together with computational modelling, revealed that USP10 binding to β-Catenin is mediated via the unstructured N-terminus of USP10 and is outcompeted by intact APC, favouring β-catenin degradation. However, in APC-truncated cancer cells USP10 binds to β-catenin, increasing its stability which is critical for maintaining an undifferentiated tumour identity. Elimination of USP10 reduces the expression of WNT and stem cell signatures and induces the expression of differentiation genes. Remarkably, silencing of USP10 in murine and patient-derived CRC organoids established that it is essential for NOTUM signalling and the APC super competitor-phenotype, reducing tumorigenic properties of APC-truncated CRC. These findings are clinically relevant as patient-derived organoids are highly dependent on USP10, and abundance of USP10 correlates with poorer prognosis of CRC patients. Our findings reveal, therefore, a role for USP10 in CRC cell identity, stemness, and tumorigenic growth by stabilising β-Catenin, leading to aberrant WNT signalling and degradation resistant tumours. Thus, USP10 emerges as a unique therapeutic target in APC truncated CRC.


Conflict of interest statement

Competing interests: MED is associated editor at Oncogene. Consent for publication: We have obtained consent to publish this paper from all the study participants.

Figures

Fig. 1
Fig. 1. USP10 is a novel regulator of β-Catenin signalling in CRC and correlates with poor patient survival.
a Tandem Ubiquitin Binding Entity (TUBE) assay of endogenous poly-ubiquitylated proteins, followed by immunoblotting against endogenous β-Catenin in human CRC cell lines with varying mutations. HCT116 and LS174T mutant for β-Catenin, DLD-1, SW480, SW620, Colo320 and HT-29 mutant for APC. β-Actin served as loading control. b Schematic model of siRNA DUB library screen conducted in APC mutant HT-29 cells. Cells were transfected with 4 individual siRNA against DUBs and 48 h post transfection immunofluorescence against endogenous β-Catenin was analysed via Operetta high-content microscope imaging. n = 3. DAPI served as nuclear marker. Identified known and new putative regulators of β-Catenin are highlighted. c Representative immunofluorescent images of endogenous β-Catenin (green) upon siRNA mediated knock-down of NTC (control), CTNNB1 and USP10, respectively. DAPI served as nuclear marker (blue). d Expression of CTNNB1 and USP10 in non-transformed (normal) and CRC (tumour) samples. Publicly available data from GEPIA. COAD (n = 275) and GTEx (n = 349) data were displayed as boxplots for USP10 and CTNNB1 expression. P-values were calculated using one-way ANOVA. Data was visualised using the online tool www.gepia.cancer-pku.cn. ***p < 0.001. e Correlation of gene expression between CTNNB1 and USP10 in human CRC. R: Spearman’s correlation coefficient. nT = 275, nN = 349. Data was visualised using the online tool www.gepia.cancer-pku.cn. f Publicly available patient survival data of CRC patients are stratified by relative expression of USP10. n = 206 (low) and n = 26 (high). Survival correlation analysis was performed using R2: Genomics Analysis and Visualization Platform, using the Tumour Colon - Smith dataset. g Representative images of immunohistochemistry (IHC) staining of a Tissue Micro Array (TMA) from CRC patients, comprising adjacent non-transformed tissue (adjacent nt) and CRC samples against β-Catenin and USP10. P-values were calculated using Mann–Whitney U test. *p < 0.05; **p < 0.005. h Immunoblotting of endogenous abundance of USP10, β-Catenin and MYC in non-transformed (WT) and patient matched CRC tumour samples (T) from two individual patients. β-Actin served as loading control. i Representative brightfield images of patient derived intestinal organoids, comprising either wild type (WT mucosa) or tumour derived organoids (CRC T5), respectively. Immunoblotting of endogenous abundance of USP10 and β-Catenin of patient organoids. β-Actin served as loading control. j Expression of USP10 in non-transformed (WT) and CRC patient derived organoids (tumour). Analysis was performed using R2: Genomics Analysis and Visualization Platform, using the Organoid - Clevers dataset. P-values were calculated using Mann–Whitney U test. ***p < 0.001.
Fig. 2
Fig. 2. Genetically engineered murine models of intestinal cancer demonstrate the upregulation of USP10 as an early event in CRC formation.
a Schematic representation of murine small intestine and colon. Villi were scratched from the intestine and small intestinal and colonic crypts were isolated using EDTA. Isolated tissue from two individual mice was analysed for endogenous abundance of USP10, β-Catenin and Krt20. β-Actin served as loading control. (n = 2). b Representative immunofluorescent images of WT intestinal crypts of endogenous USP10 (green) and crypt cell specific markers. Upper panel: Lysozyme (magenta) marks Paneth cells. Lower panel: Cd44 (magenta) labels stem cells. DAPI served as nuclear marker (blue). White line indicates stretch of fluorescence quantification. Histogram of fluorescence over indicated length. c Schematic representation of acute in vivo CRC onset in wild type CD1 animals using colorectal instillation of lentivirus particles encoding sgRNA against murine Apc, targeting exon 10 (Apcex10), and constitutive expression of SpCas9. Viral backbone was pLenti-CRISPR-V2. pr.i. - pre infection. d Haematoxylin and eosin (H&E) staining of CRISPR mediated tumour onset in CD1 animals, 12 weeks post intracolonic instillation of virus. Insets highlight either non-transformed adjacent tissue or primary tumour upon Apc deletion. e Representative immunofluorescent images of mice shown in a and b of endogenous USP10 (green) and β-Catenin (red). DAPI served as nuclear marker (blue). Insets highlight either untransformed (1) or transformed (2) regions. Intensity of β-Catenin and USP10 staining was quantified using QuPath software. P-values were calculated using Mann–Whitney test. Individual cells/values are highlighted as dots. ***p < 0.001. f Insets from c. High magnification immunofluorescent images of intestines of CRISPR infected animals for USP10 (green) and β-Catenin (red). DAPI served as nuclear marker (blue). g Schematic representation of CRISPR-engineered murine CRC models using Adeno-associated viruses (AAV) to deliver sgRNA and HDR templates to either truncate endogenous APC within exon 9, Trp53 or point mutate endogenous Kras to KrasG12D. h Representative brightfield images of murine intestinal organoids, comprising either wild type (Cas9), after targeting and growth factor depleted selection upon CRISPR engineering of Apc exon 9 (Apcex9) and KRas to KRasG12D (AK), or upon co-deletion of Trp53 (APK), respectively. Immunoblotting of endogenous abundance of USP10 and β-Catenin in Cas9, AK and APK organoids. β-Actin served as loading control.
Fig. 3
Fig. 3. Truncation of APC allows for de novo protein-protein interaction between USP10 and β-Catenin in CRC.
a Representative input and endogenous co-immunoprecipitation of USP10 and β-Catenin in human CRC cell lines either wild type for APC, HCT116APCwt, or truncated HT-29APCmut. IgG served as antibody specificity control. β -Actin served as loading control. Input represents 3% of total loading. n = 3. b Schematic representation of truncating mutations reported in the APC gene in the CRC cell lines HCT116 and HT-29. Dark blue box = 15 AAR domains, green small boxes = 20 AAR domains, large green boxes = SAMP domains. 15- and 20-AAR = β-Catenin amino acid repeats; SAMP = Axin binding sites. Images adapted from the publicly available database www.uniprot.org. c Schematic model of acute truncation of APC at amino acid 867 in HCT116 via CRISPR gene editing. d Bargraph of proximity ligation assay (PLA) between USP10 and β-Catenin in either APC wild type (APCwt) or APC867 truncated (APCmut) HCT116. Data analysed from more than 750 cells over two independent experiments per condition. P-values were calculated using Mann–Whitney U test. Representative immunofluorescent images of endogenous USP10 (green), β-Catenin (red) and the corresponding PLA (mustard) in either APCwt of APCmut HCT116. DAPI served as nuclear marker. n = 2. e Schematic overview of the in vitro binding assay in µSPOT format. Intrinsically disordered regions of USP7, USP10 and USP36, respectively, were determined by <50 pLDDT score in their individual AlphaFold2 structural prediction and represented as 15 mer peptides overlapping 12 or 11 amino acids. For binding assays, µSPOT slides bearing the peptide library were incubated with recombinantly expressed and purified β-Catenin. β-Catenin binding to the on-chip peptides was detected by immunostaining with a chemiluminescent readout. f Overview of binding intensities of recombinant β-Catenin towards discreet unstructured regions of USP7, USP10 and USP36. Gaps indicate the presence of structured domains within the DUBs. Colour code indicates binding intensity. Peptides with the globally highest binding intensity (N-terminal region of USP10 residues 7–21) are underlined in green and represented as a bar graph in panel g). Mean of n = 3. g Identified amino acid sequence within the N-terminal unstructured part of USP10 binding to recombinant β-Catenin. Bar graph shows binding intensity (abs. = absolute intensity). Mean of n = 3 with corresponding standard deviation. h Full positional scan of the most prominent β-Catenin binding hotspot USP107-21 identified in the overlapping scan (panel g). Each residue of the peptide sequence was systematically varied to every other proteogenic amino acid and their β-Catenin binding intensities are shown relative to the wildtype sequence. Note that amino acid variations for certain positions result in drastic reductions in binding intensity compared to the wildtype sequence, thus suggesting direct interactions of the respective sidechains with β-Catenin. Mean of n = 3.
Fig. 4
Fig. 4. Acute deletion of USP10 in intestinal stem cells of D.melanogaster rescues hyperplasia and lethality of the ApcQ8/Q8 mutant flies.
a Representative immunofluorescence of fly midguts. ApcQ8/+ heterozygotes are highly similar to wildtype midguts (not shown). Midguts of homozygous ApcQ8 mutants exhibit hyperproliferation of ISC (positive for the intestinal stem cell marker Delta (red)). Elimination of USP10 using USP10 inverted repeats (UAS-IR) suppresses the progenitor hyperproliferation phenotype observed in midguts of homozygous ApcQ8 mutants. b Quantification of total stem cell abundance in all three conditions. Significance as compared to “esg > +; ApcQ8” was calculated using one-way ANOVA. **p < 0.005; ***p < 0.001. c qRT-PCR analysis of the expression of USP10, armadillo and escargot in midguts isolated from either ApcQ8 or ApcQ8 USP10KD flies. mRNA was normalised to Actb. Error bars represent standard deviation of 3 biological replicates. d Kaplan–Meier plot of adult survival of the indicated genotypes. ApcQ8 n = 24, ApcQ8:esg-USP10i n = 17.
Fig. 5
Fig. 5. USP10 regulates WNT signalling and stemness signature genes via controlling β-Catenin protein stability.
a Immunoblot against endogenous USP10, β-Catenin and LGR5 in APC mutant HT-29 cells upon CRISPR mediated depletion of USP10. Two different cell pools (USP10−1 and USP10−2) along with non-targeting control (ctrl) cells are shown. β-Actin served as loading control. n = 3. b Quantitative RT-PCR of USP10, CTNNB1 and LGR5 expression of HT-29 USP10 CRISPR pool (USP10−2) compared to control (ctrl) cells. Error bars represent standard deviation of n = 3 independent experiments. Significance was calculated using Student’s t test. **p < 0.005; ***p < 0.001. n.s. non-significant. c Tandem Ubiquitin Binding Entity (TUBE) assay of endogenous poly-ubiquitylated proteins, followed by immunoblotting against endogenous β-Catenin in HT-29 USP10 CRISPR cells (USP10−2). Immunoblot against endogenous USP10 is shown. β-Actin served as loading control. n = 2. d Cycloheximide (CHX) chase assay (100 μg/ml) of control (shNTC) or shUSP10-2 expressing HT-29 cells for indicated time points. Representative immunoblot analysis of USP10 and β-Catenin. β-Actin served as loading control. n = 3. e Quantification of relative protein abundance of β-Catenin, normalised to β-Actin, as shown in d. Significance was calculated using Student’s t test. n = 3 *p < 0.05; ***p < 0.001. f Representative immunoblot against endogenous USP10 and β-Catenin in APC mutant HT-29 cells upon DOX-inducible overexpression of GFP control (GFP), catalytical active GFP-USP10 (GFP USP10WT) and a catalytical inactive mutant of USP10 (GFP USP10CA). β-Actin served as loading control. (n = 3). g Quantitative RT-PCR of USP10, CTNNB1 and KRT20 expression of HT-29 cells overexpressing exogenous USP10. Error bars represent standard deviation of n = 3 independent experiments. Significance was calculated using Student’s t test. **p < 0.005; ***p < 0.001. n.s. non-significant. h Growth-curve of GFP USP10WT and GFP USP10CA overexpressing HT-29 cells compared to GFP control cells. Error bars represent standard deviation of n = 3 independent experiments. Significance was calculated using one-way ANOVA. ***p < 0.001. n.s. non-significant. i Representative immunofluorescence images of conditional USP10WT and USP10CA overexpression and GFP control in HT-29 cells. J Quantification of i. Mean intensity over well was measured and normalised to GFP control. Error bars represent standard deviation of n = 3. Significance was calculated using unpaired t-test. *p < 0.05; ***p < 0.001; n.s. non-significant.
Fig. 6
Fig. 6. USP10 is required to maintain CRC cell identity, stemness and tumour growth.
a Schematic overview of workflow for isolation, characterisation and silencing of USP10 in patient derived CRC organoid P6T (Oncode Organoid bank). b Representative brightfield images of stable transformed human P6T organoids infected with either shRNA against USP10 or with a non-targeting control. n = 10 field of view. Highlighted are individual and intact organoids. c Quantification of relative organoid number (per field of view) one week post infection with either a control (shNTC) or shUSP10. Statistical analysis was performed using unpaired t test. p < 0.0001. Images were quantified using QuPath (version0.4.2) and ImageJ (FIJI). Boxplots were generated using Graphpad Prism8. In box plots, the centre line reflects the median and the upper and lower box limits indicate the first and third quartiles. Whiskers extend 1.5× the IQR. P-values were calculated using Mann–Whitney U test. ***p < 0.0001. d Quantification of relative organoid size (per field of view) one week post infection with either a control (shNTC) or shUSP10. Statistical analysis was performed using unpaired t test. p < 0.0001. Images were quantified using QuPath (version0.4.2) and ImageJ (FIJI). Violinplots were generated using Graphpad Prism8. P-values were calculated using Mann–Whitney U test. ***p < 0.0001. e Volcano-plot of differential expressed genes upon knock-down of USP10 in human P6T organoids, relative to expression in shNTC infected control organoids. Significantly regulated genes are highlighted in red, respectively. USP10 is highlighted. n = 3. f Heatmaps showing expression of genes linked to WNT signalling, differentiation and NOTUM signalling in either shNTC or shUSP10 P6T organoids. n = 3. g, h GSEA analysis of P6T organoids expressing an shRNA sequence targeting USP10 or non-targeting control (shNTC). Changes in gene expression were analysed and enrichment plots for gene sets mapping to WNT signalling, EMT, UPR and ROS are shown. i Representative brightfield images of stable transformed murine Aex9PKG12D organoids (APK9). Two different shRNAs against USP10 and shNTC expressing organoids were generated. j Representative immunoblot of USP10 and β-Catenin protein upon shRNA mediated knock-down of endogenous USP10. β-Actin served as loading control. Quantification was calculated from n = 3. k Gene set enrichment analysis of MsigDB gene sets, deregulated in shUSP10-1 compared to shNTC APK9 organoids. l Gene set enrichment analysis of intestinal specific gene sets, deregulated in shUSP10-1 compared to shNTC APK9 organoids. m Volcano-plot of differential expressed genes upon knock-down of USP10 in APK9 organoids. Up- and down-regulated genes are highlighted in red and blue, respectively. Genes-of-interest are labelled.
Fig. 7
Fig. 7. Loss of USP10 opposes competitor signalling and restores a wild-typic niche.
a Representative brightfield images of wild-type (WT) organoids cultured in ENR medium, APKshNTC and APKshUSP10-1 conditioned medium (CM), supplemented with EGF and R-spondin, for up to 6 days. Purple arrows indicate dead organoids, green arrows indicate living organoids. E – EGF, N – Noggin, R - R-spondin. n = 3. b Dead and alive organoids were counted and bar graphs represent percentage of alive vs dead organoids. Error bars represent standard deviation calculated from n = 3 independent experiments.Schematic representation of an in vivo organoid transplant model of APK shNTC or shUSP10, respectively. Adapted from refs. [39, 41, 62]. c Schematic representation of the in vivo organoid transplant model in immune-competent C57Bl6/J mice. d Representative merged immunofluorescent images of endogenous USP10 (green) and β-Catenin (red) of murine intestines upon organoid transplant. Encircled are tumours arising from engrafted somatic engineered APK organoids, either expressing an shNTC or shUSP10, respectively. DAPI served as nuclear marker. Scale bar represents 1 mm. e Individual higher magnification images of discreet tumours upon transplant as seen in d. USP10 (green) and β-Catenin (red) are shown. Highlighted are either tumour areas or adjacent, non-transformed tissue regions. Tumour area is encircled. Scale bar 200 μm. Zoom in image of merged image. Scale bar 50 μm. f Quantification of relative fluorescence intensity (arbitrary units a.u.) of endogenous USP10 and β-Catenin, either in shNTC or shUSP10 animals. Statistical analysis was performed using unpaired t test. ***p < 0.0001. Images were quantified using QuPath (version0.4.2). Boxplots were generated using Graphpad Prism8 and individual datapoints are shown. 1. g Schematic model. In APC-truncation driven CRC, loss of all AAR-domains in APC, enables a de-novo interaction of USP10 and β-Catenin. By stabilising β-Catenin, this interaction activates the transcription of β-Catenin target genes, thereby promoting a stem-like phenotype and proliferation and decreasing differentiation. Interfering with USP10 expression by shRNA and/or CRISPR/Cas9 reverts this phenotype and leads to decreased stemness and proliferation and promotes differentiation.

References

    1. Sung H, Ferlay J, Siegel RL, Laversanne M, Soerjomataram I, Jemal A, et al. Global Cancer Statistics 2020: GLOBOCAN Estimates of Incidence and Mortality Worldwide for 36 Cancers in 185 Countries. CA Cancer J Clin. 2021;71:209–49. - PubMed
    1. Risks and causes of bowel cancer. Cancer Research UK. https://www.cancerresearchuk.org/about-cancer/bowel-cancer/risks-causes.
    1. Half E, Bercovich D, Rozen P. Familial adenomatous polyposis. Orphanet J Rare Dis. 2009;4:22. - PMC - PubMed
    1. Siegel RL, Miller KD, Fuchs HE, Jemal A. Cancer Statistics, 2021. CA Cancer J Clinicians. 2021;71:7–33. - PubMed
    1. Novellasdemunt L, Antas P, Li VS. Targeting Wnt signaling in colorectal cancer. A Review in the Theme: Cell Signaling: Proteins, Pathways and Mechanisms. Am J Physiol Cell Physiol. 2015;309:C511–521. - PMC - PubMed

MeSH terms

LinkOut - more resources