. 2024 Oct;7(10):e70000.
doi: 10.1002/cnr2.70000.

A Four-Gene Autophagy-Related Prognostic Model Signature and Its Association With Immune Phenotype in Lung Squamous Cell Carcinoma

Affiliations

A Four-Gene Autophagy-Related Prognostic Model Signature and Its Association With Immune Phenotype in Lung Squamous Cell Carcinoma

Lumeng Luo et al. Cancer Rep (Hoboken). 2024 Oct.

Abstract

Background: In the era of immunotherapy, there is a critical need for effective biomarkers to improve outcome prediction and guide treatment decisions for patients with lung squamous cell carcinoma (LUSC). We hypothesized that the immune contexture of LUSC may be influenced by tumor intrinsic events, such as autophagy.

Aims: We aimed to develop an autophagy-related risk signature and assess its predictive value for immune phenotype.

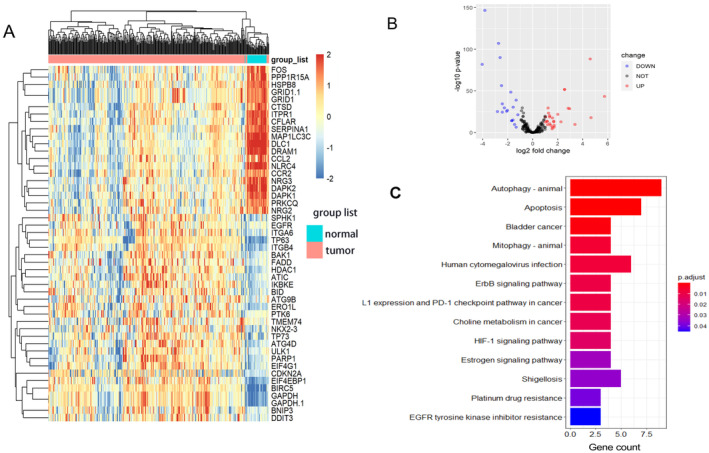
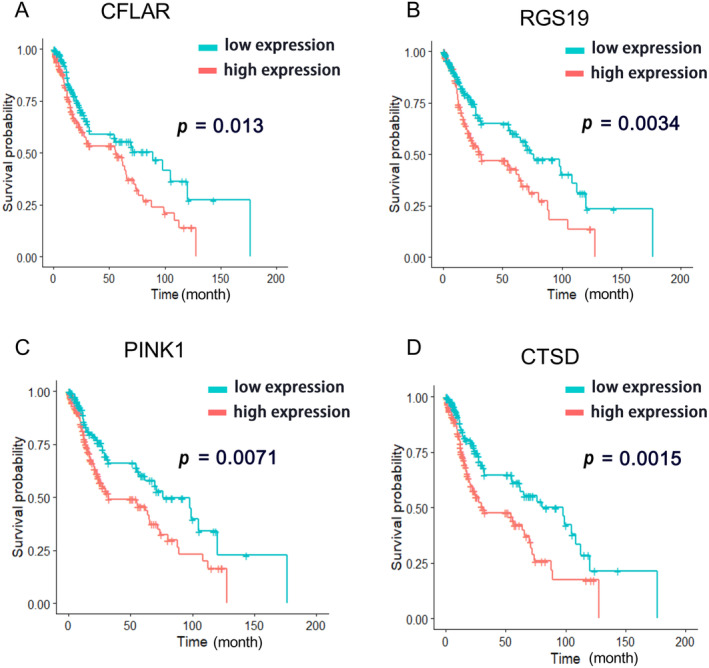
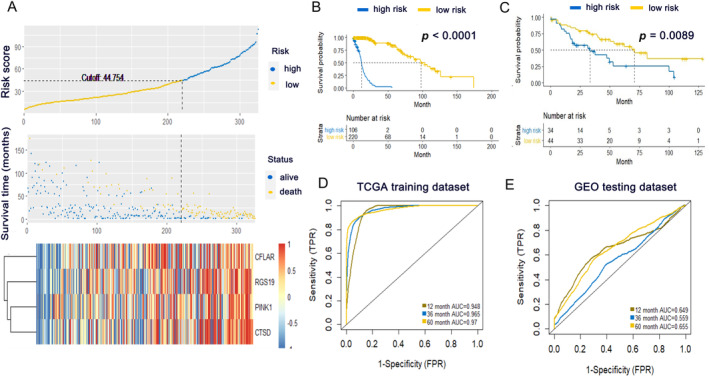
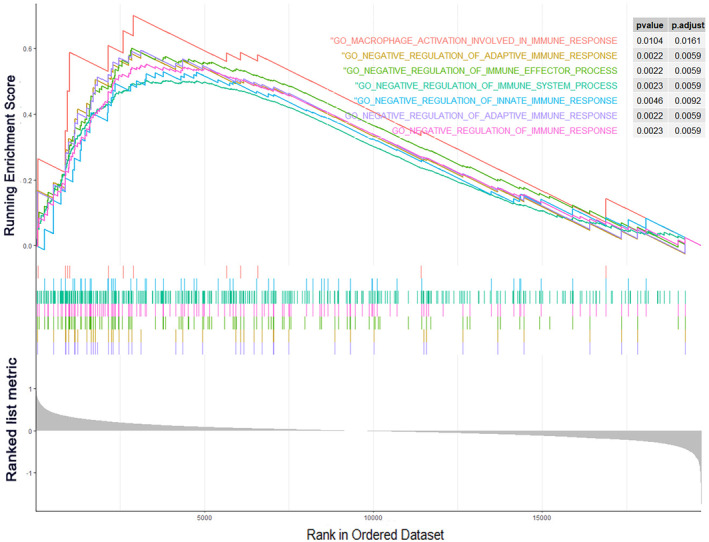
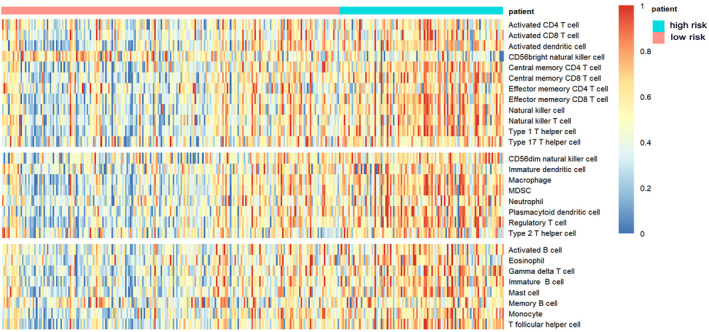
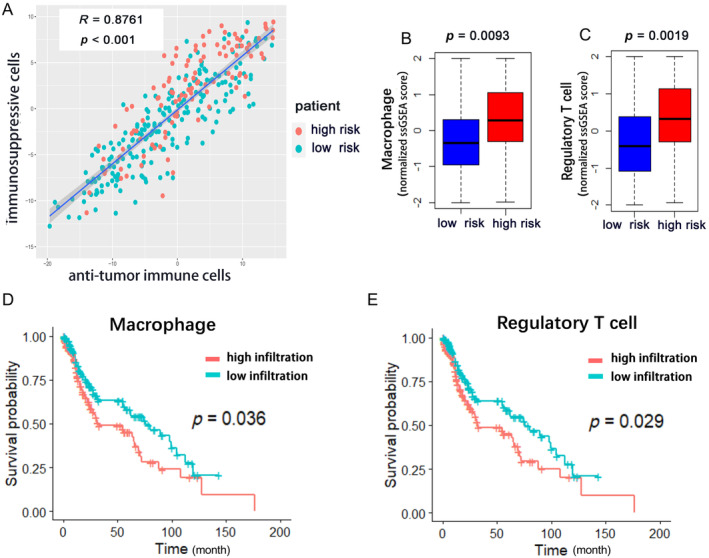
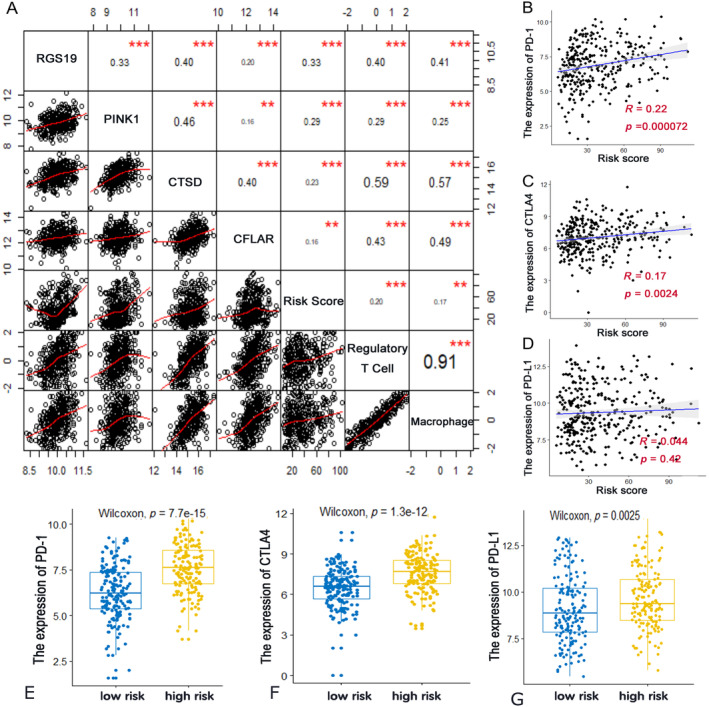
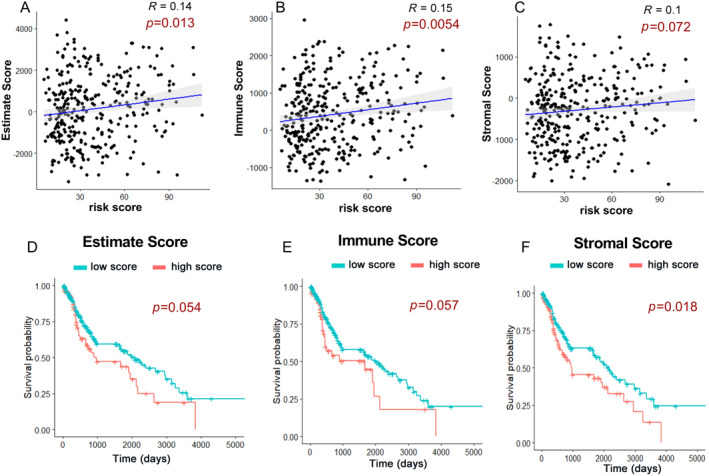
Methods and results: Expression profiles of autophagy-related genes (ARGs) in LUSC samples were obtained from the TCGA and GEO databases. Survival analyses were conducted to identify survival-related ARGs and construct a risk signature using the Random Forest algorithm. Four ARGs (CFLAR, RGS19, PINK1, and CTSD) with the most significant prognostic value were selected to construct the risk signature. Patients in the high-risk group exhibited worse prognosis than those in the low-risk group (p < 0.0001 in TCGA; p < 0.01 in GEO) and the risk score was identified as an independent prognostic factor. We observed that the high-risk group displayed an immune-suppressive status and showed higher levels of infiltrating regulatory T cells and macrophages, which are associated with poorer outcomes. Additionally, the risk score exhibited a significantly positive correlation with the expression of PD-1 and CTLA4, as well as the estimate score and immune score.

Conclusion: This study provided an effective autophagy-related prognostic signature, which could also predict the immune phenotype.

Keywords: autophagy; bioinformatic analysis; immune infiltration; immune landscape; lung squamous cell carcinoma; prognostic signature.


Conflict of interest statement

The authors declare no conflicts of interest.

Figures

FIGURE 1
FIGURE 1
Results of differentially expressed analysis on ARGs and enrichment analysis of DE‐ARGs. (A) A heatmap of 48 differentially expressed ARGs between 326 LUSC samples and 32 normal controls. Each line represents a DE‐ARG and each row means a sample. The expression levels of genes are displayed with colors in each cell (red for high and blue for low). (B) The volcano plot of differentially expressed ARGs between LUSC samples and normal controls. (C) The enriched significant KEGG signal pathways of DE‐ARGs. The color represents the statistical significance of the term. The length indicates the counts of enriched genes.
FIGURE 2
FIGURE 2
The results of survival analyses. (A–D) shows the Kaplan–Meier overall survival (OS) curves of CFLAR, RGS19, PINK1, CTSD for LUSC patients based on high and low expression levels of these four genes (cutoff = 50%).
FIGURE 3
FIGURE 3
Construction and validation of the Autophagy‐related prognostic signature. (A) Risk score distribution, survival status of each patient, and heatmaps of prognostic four‐gene signature in TCGA cohorts. Patients were ranked by risk score. (B, C) Kaplan–Meier survival curve of OS among LUSC patients from low‐risk group and high‐risk group in TCGA training dataset (B) and GEO testing dataset (C). (D, E) Receiver operating characteristic (ROC) curves of the risk score model in TCGA training dataset (D) and GEO testing dataset (E).
FIGURE 4
FIGURE 4
Pathways involved in negatively regulation of immune response by GSEA analyses. GSEA analyses displayed gene sets that were significantly enriched in high (up) or low (down) risk group. The pathways were colored, respectively (Orange: Macrophage activation involved in immune response; Yellow: Negative regulation of adaptive immune response; Light green: Negative regulation of immune effector process; Aquamarine blue: Negative regulation of immune system process; Blue: Negative regulation of innate immune response; Violet: Negative regulation of adaptive immune response; Red violet: Negative response of immune response).
FIGURE 5
FIGURE 5
Heatmap of immune cell infiltration level of LUSC tumor samples in TCGA cohort. A Single‐Sample Gene Set Enrichment Analysis identifying the relative infiltration of 28 immune cell populations for LUSC tumor samples. Samples in the heatmap were ranked by risk score of each patient. The ssGSEA score which represents the relative infiltration of each cell type was normalized to unity distribution, for which zero is the minimal and one is the maximal score for each immune cell type (red represents high and blue represents low infiltration). The three parts of the heatmap exhibited the three types of immune cells (anti‐tumor immunity, pro‐tumor immune‐suppression, and other unclassified immune cells).
FIGURE 6
FIGURE 6
The analyses of immune cell infiltration. (A) Correlation between infiltration of cell types executing anti‐tumor immunity and pro‐tumor, immune suppressive functions. R coefficient of Pearson's correlation and p value were shown. (B) High‐risk group was associated with higher infiltration of Macrophage (C, p < 0.01). (C) High‐risk group was associated with higher infiltration of Regulatory T cell (Wilcox‐test, p < 0.01). (D) Macrophage infiltration was negatively correlated with overall survival (Log‐Rank test, p < 0.05). (E) Regulatory T cell infiltration was negatively correlated with overall survival (Log‐Rank test, p < 0.05).
FIGURE 7
FIGURE 7
Correlations of risk score with genes expression, immunocyte infiltration and the immune checkpoint. (A) Correlation of the risk score with genes expression and immunocyte infiltration level. Pearson's correlation coefficient values with the significance level were shown on the top of the diagonal (**p < 0.01, ***p < 0.001). (B–D) Correlation of the risk score with the expression of several key immune checkpoints. (B) PD‐1; (C) CTLA4; (D) PD‐L1. Pearson's correlation coefficient values with the p value were shown. (E–G) The boxplots showed the comparison of the expression of several key immune checkpoints between the high‐risk and low‐risk group. (E) PD‐1; (F) CTLA4; (G) PD‐L1. Wilcox‐test was conducted and p values were provided in each figure.
FIGURE 8
FIGURE 8
Correlation and survival analyses of estimate score, immune score and stromal score. (A–C) The correlations of risk score with estimate score, immune score, and stromal score. Pearson's correlation coefficient values were showed. (D–F) The Kaplan–Meier overall survival curves for LUSC patients assigned to high and low score group. (D) Estimate score; (E) Immune score; (F) Stromal score.

Similar articles

Cited by

References

    1. Siegel R. L., Miller K. D., and Jemal A., “Cancer Statistics, 2018,” CA: A Cancer Journal for Clinicians 68, no. 1 (2018): 7–30. - PubMed
    1. Torre L. A., Siegel R. L., and Jemal A., “Lung Cancer Statistics,” Advances in Experimental Medicine and Biology 893 (2016): 1–19. - PubMed
    1. Zhao Y., Liu J., Cai X., et al., “Efficacy and Safety of First Line Treatments for Patients With Advanced Epidermal Growth Factor Receptor Mutated, Non‐small Cell Lung Cancer: Systematic Review and Network Meta‐Analysis,” BMJ 367 (2019): l5460. - PMC - PubMed
    1. Bianco A., Perrotta F., Barra G., Malapelle U., Rocco D., and De Palma R., “Prognostic Factors and Biomarkers of Responses to Immune Checkpoint Inhibitors in Lung Cancer,” International Journal of Molecular Sciences 20, no. 19 (2019): 4931. - PMC - PubMed
    1. Elanany M. M., Mostafa D., and Hamdy N. M., “Remodeled Tumor Immune Microenvironment (TIME) Parade via Natural Killer Cells Reprogramming in Breast Cancer,” Life Sciences 330 (2023): 121997. - PubMed

MeSH terms

Substances