. 2024 Nov;635(8038):423-433.
doi: 10.1038/s41586-024-08008-5. Epub 2024 Oct 23.

Targeting immune-fibroblast cell communication in heart failure

Affiliations

Targeting immune-fibroblast cell communication in heart failure

Junedh M Amrute et al. Nature. 2024 Nov.

Abstract

Inflammation and tissue fibrosis co-exist and are causally linked to organ dysfunction1,2. However, the molecular mechanisms driving immune-fibroblast cell communication in human cardiac disease remain unexplored and there are at present no approved treatments that directly target cardiac fibrosis3,4. Here we performed multiomic single-cell gene expression, epitope mapping and chromatin accessibility profiling in 45 healthy donor, acutely infarcted and chronically failing human hearts. We identified a disease-associated fibroblast trajectory that diverged into distinct populations reminiscent of myofibroblasts and matrifibrocytes, the latter expressing fibroblast activator protein (FAP) and periostin (POSTN). Genetic lineage tracing of FAP+ fibroblasts in vivo showed that they contribute to the POSTN lineage but not the myofibroblast lineage. We assessed the applicability of experimental systems to model cardiac fibroblasts and demonstrated that three different in vivo mouse models of cardiac injury were superior compared with cultured human heart and dermal fibroblasts in recapitulating the human disease phenotype. Ligand-receptor analysis and spatial transcriptomics predicted that interactions between C-C chemokine receptor type 2 (CCR2) macrophages and fibroblasts mediated by interleukin-1β (IL-1β) signalling drove the emergence of FAP/POSTN fibroblasts within spatially defined niches. In vivo, we deleted the IL-1 receptor on fibroblasts and the IL-1β ligand in CCR2+ monocytes and macrophages, and inhibited IL-1β signalling using a monoclonal antibody, and showed reduced FAP/POSTN fibroblasts, diminished myocardial fibrosis and improved cardiac function. These findings highlight the broader therapeutic potential of targeting inflammation to treat tissue fibrosis and preserve organ function.


Conflict of interest statement

Competing interests X.L., T.Y., S.Y.S., A.F., M.F., X.Z., S.J., C.-M.L. and B.A. are or were employed by Amgen. The other authors declare no competing interests.

Figures

Extended Data Fig. 1 |
Extended Data Fig. 1 |. CITE-seq multi-modal clustering overview.
(a) UMAP embedding construction using RNA, protein, or weighted nearest neighbor analysis. (b) CITE-seq protein assay weights used for WNN clustering. (c) Heatmap of top marker genes for each cell type in global UMAP. (d) Integrated global UMAP colored by patient sample. (e) Cell type composition split by each sample. (f) Protein expression as a density plot for top CITE-seq protein markers in different cell types.
Extended Data Fig. 2 |
Extended Data Fig. 2 |. Multiome (RNA + ATAC) multi-modal clustering and gene signatures.
(a) Heatmap of top differentially expressed genes from snRNA-seq atlas. (b) DotPlot and (c) UMAP embedding of z-scores for top marker genes for cell types in (a). (d) UMAP embedding plot of Multiome data clustered by RNA, ATAC, joint, and joint clustering embedding with RNA annotations overlaid. (e) Correlation heatmap of RNA versus ATAC and (f) RNA versus joint RNA/ATAC clustering.
Extended Data Fig. 3 |
Extended Data Fig. 3 |. Fibroblast cell state transcriptional and molecular signatures.
(a) Heatmap of top marker genes for fibroblast cell states. (b) DotPlot of key marker genes for fibroblast cell states. (c) Gene set z-scores for fibroblast cell states plotted in UMAP embedding. (d) THY1 RNA, protein, and protein density plot in fibroblast UMAP space. (e) Density plots for differentially expressed protein markers in fibroblast UMAP space. (f) GO analysis from clusterProfiler for fibroblast cell states. (g) DoRothEA Transcription factor enrichment analysis across fibroblast cell states. (h) Density plot of fibroblast cell states by condition.
Extended Data Fig. 4 |
Extended Data Fig. 4 |. Cross-tissue and spatial integration of human HF fibroblast cell states.
(a) Gene set signature kernel density embedding plot for donor (top) and HF (bottom) – genes are derived from pseudobulk differential expression analysis between donor and HF. Statistically significant genes (adjusted p-value < 0.05, log2FC > 0.58, and base mean expression > 500). (b) Gene expression density plot in UMAP embedding for POSTN, RUNX1, EDNRA, and MEOX1 (markers distinguishing F2 and F9 lineages). (c) Integrated UMAP of perturbated pathological fibroblasts and (d) split by disease category. (e) Dotplot of marker genes for clusters in (c). (f) Fibroblast cell state mapping in control, infarcted, fibrotic, border zone, and remote zone LV Visium spatial transcriptomics sections (n = 28) with cell state gene signature grouped by section. (g) MISTy fibroblast cell state predictive modeling with predictor cell on y-axis and target cell on x-axis across 12 samples. (h) Cell state co-localization analysis using CellTrek SColoc. Schematics in f, g were created using BioRender (https://biorender.com).
Extended Data Fig. 5 |
Extended Data Fig. 5 |. Epigenetic regulation of fibroblast cell state transition.
(a) Palantir derived entropy with terminal cell states noted and marker genes for terminal states in addition to FAP plotted in FDL embedding highlighting FAP derived fibroblasts diverge into myofibroblats and PFs. (b) Heatmap of pseudobulk differentially expressed genes between donor and HF and terminal state marker genes over pseudotime. (c) CellOracle gene regulatory network betweenness centrality score for RUNX1 by HF etiology – a higher score indicates that the TF has a greater influence on informational flow in the gene regulatory network. (d) Average expression of RUNX1 per HF patient versus POSTN in fibroblasts from the same patient. R2 indicates the regression coefficient and the p-value tests whether the slope is significantly non-zero. (e) Differential accessibility expression analysis between donor and heart failure in fibroblasts.
Extended Data Fig. 6 |
Extended Data Fig. 6 |. In vivo mouse to human integration across cardiac injury models.
Reference mapping scores for mouse (a) MI and (c) TAC fibroblasts onto human heart CITE-seq fibroblast UMAP embedding. (b) Reference mapped data split by MI time point in human space. (d) Reference mapped data split by sham, TAC, TAC + JQ1 treatment, and TAC + JQ1 withdrawn in human space. (e) Experimental design for Ang II/PE 28-day pumps for sequencing. (f) QC metrics post filtering. (g) Integrated global UMAP split by sham and Ang II/PE at day 28. (h) Heatmap of top marker genes for clusters from (g) (Supplementary Table 21). (i) Reference mapping scores for mouse Ang II/PE and sham d28 fibroblasts onto human heart CITE-seq fibroblast UMAP embedding. Schematics in e were created using BioRender (https://biorender.com).
Extended Data Fig. 7 |
Extended Data Fig. 7 |. In vitro models of fibroblast activation quality control, clustering, and mapping.
(a) UMAP embedding with separate clustering in each cell line with density plots split by experimental condition (Supplementary Table 22). (b) Composition stack graphs for NHCF, NHDF, and iHCF grouped by biological and technical replicates for identified clusters. (c) Heatmap of marker genes for each cell line for clusters in (a). (d) Reference mapping scores for in vitro fibroblasts onto human heart CITE-seq fibroblast UMAP embedding. (e) Heatmap of mapping scores with in vitro clusters on x-axis and human heart CITE-seq fibroblasts on y-axis. Schematics in e were created using BioRender (https://biorender.com).
Extended Data Fig. 8 |
Extended Data Fig. 8 |. Myeloid cell state characterization post-MI.
(a) UMAP embedding plot of myeloid cells with annotated cell states (Supplementary Table 23). (b) Myeloid cell state composition across four groups. (c) Gaussian kernel density estimation of cells across four groups (left) and split by MI time in AMI patients with corresponding cell state composition. (d) Dot Plot of marker genes for macrophages cell states (y-axis) and grouped by cell type (x-axis). (e) Inflammation gene set score split across 4 groups and (e) grouped from time post-MI. (f) CCR2 and FOLR2 (protein) expression in UMAP embedding. (g) Spatial transcriptomic AMI (2-day post-MI) infarct zone (IZ) sample with label transferred annotations from snRNA-seq reference map. (h) Monocyte gene set score mapped into space (left) and inflammation score (right).
Extended Data Fig. 9 |
Extended Data Fig. 9 |. Spatial co-localization analysis of immune-stromal states in human MI.
(a) SPOTlight derived cell spot deconvolution Pearson correlation coefficients for cell neighborhoods in donor, AMI and ICM spatial transcriptomic sections. (b) Integration of spatial spots from 28 Visium spatial transcriptomics samples (Supplementary Table 24). (c) FAP, POSTN, CD68, and CD68/FAP expression density plot from integrated spatial spots.(d) Heatmap of spatial niche marker genes. (e) UMAP embedding plot of spatial clusters with three distinct niches and corresponding spatial location of clusters (Supplementary Table 25). (f) Heatmap of top differentially expressed genes across spatial niches. (g) Dot plot of marker genes and gene set scores for spatial niches. (h) Spatial clusters from (g) overlaid in space z-score for marker genes in F9 (POSTN, COMP, FAP, COL1A1, THBS4, COL3A1) and F2 (ACTA2, TAGN), and imputed NF-kB pathway score. (i) IL-1R expression in global UMAP embedding (left) and IL-1R expression DotPlot in fibroblast cell states (right). (j) qPCR for IL-1R expression in sorted fibroblasts and macrophages in Ang II/PE infused mice at d7. Unpaired t-test and samples are from independent biological animals. Error bars are +/− SEM.
Extended Data Fig. 10 |
Extended Data Fig. 10 |. In vivo fibroblast state maturation with anti-IL-1β mAb treatment.
(a) Integrated UMAP for sham, isotype and anti- IL-1β mAb treated mice fibroblasts with annotated clusters (left) and colored by condition (right) (Supplementary Table 26). (b) scRNA-seq QC metrics for study design in Fig. 5f. (c) Differentially expressed marker genes for clustering in (a). (d) Reference mapping of fibroblasts in (a) to human CITE-seq fibroblast cell states UMAP embedding (left) and heatmap of average cell prediction score of human fibroblast cell states (y-axis) in annotated mouse fibroblasts (x-axis) (right). (e) Cell state composition stack plot of mapped cell states with F9 highlighted (top) and clustering from (a) with Postn+ state highlighted. (f) Experimental workflow for cardiac injury experiment with treatment with an anti-IL-1β mAb or isotype control for FAP activation (left) and scRNA-seq QC metrics (right). (g) Integrated UMAP for isotype and anti-IL-1β mAb treated mice FAP +/FAP− fibroblasts with annotated clusters and density plot of Fap/Postn co-localization with area of maximal expression highlighted (Supplementary Table 27). (h) Heatmap of marker genes for clustering in (g). (i) Gaussian kernel density plots of 4 conditions in integrated UMAP embedding. (j) Heatmap of key fibroblast cell state genes grouped by four conditions with rows clustered by similarity. (k) Immunofluorescence of POSTN in a representative sham, Ang II/PE + Isotype, and Ang II/PE + anti- IL-1β mAb heart (left) with quantification (right); scale bar = 500 um. (l) RT-PCR of Postn in mouse hearts split by 3 groups at day 7 post Ang II/PE infusion. (m) Representative trichrome staining images from Ang II/PE day 28 hearts from isotype and anti- IL-1β mAb treated mice; scale bar = 100 px. For (k) and (l) ordinary one-way ANOVA with Turkey multiple testing correction from independent biological animals. Error bars are +/− SEM.
Fig. 1 |
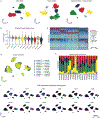
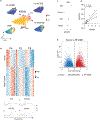
Fig. 1 |. Integrated multiomic characterization of human MI and HF.
a, Study design for multiomic human sequencing, cross-tissue fibroblast analysis, model characterization, immune–fibroblast cell communication and in vivo validation studies. b, Uniform manifold approximation and projection (UMAP) embedding plot with WNN clustering (RNA and protein) of CITE-seq data from 22 patients and 143,804 cells. c, Violin plot for canonical marker genes for cell types. d, Heatmap of marker proteins for cell types. e, Cell cluster composition across groups. f, Pseudobulk differentially expressed genes between donor and HF samples in major cell types. Red dots indicate statistically significant genes (log2FC > 0.58 and adjusted P < 0.05). g, UMAP embedding plot of RNA from Multiome (paired RNA and ATAC) specimens from 23 patients and 17,982 nuclei. h, Marker peaks for the major cell types annotated in g with FDR < 0.1 and log2FC > 0.5. i, Peak2Gene linkage heatmap using paired Multiome RNA and ATAC data. j, Gene accessibility and expression Pearson correlation within the same nucleus across all genes. k, Gene accessibility–gene expression (GA–GE) Pearson correlation against the number of linked putative CREs—the vertical line is drawn at 10 CREs and the horizontal line is drawn to mark the top 10th percentile of GA–GE Pearson correlation coefficient values. The shaded area indicates genes that pass both thresholds and are defined as GPCs. FC, fold change; FDR, false discovery rate; NK, natural killer; P2G, Peak2Gene. Schematics in a were created using BioRender (https://BioRender.com).
Fig. 2 |
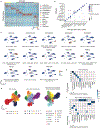
Fig. 2 |. Fibroblast cell state diversification in the failing heart.
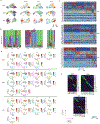
a, UMAP embedding of fibroblast cell states. b, Fibroblast cell state composition across four groups. c, POSTN RNA (top) and FAP protein (bottom) expression. d, Immunofluorescence of FAP in donor and AMI (4 d post-MI) left ventricle. e, FAP/POSTN gene expression z-score in donor, AMI and ICM split by time from MI (top), with spatial transcriptomics samples showing FAP expression at different time points post-MI (bottom). f, KEGG pathway analysis for F9 cell state. g, Cross-tissue fibrosis Pearson correlation coefficient between HF and chronic disease fibroblast cell states. h, Reference mapping human coronary artery scRNA-seq data onto HF fibroblasts with stack plot showing relative composition of mapped states (left) and gene set score for F2/F11 in MI hearts spatial transcriptomics data (right). i,j, scVelo analysis in FDL embedding (i) and Palantir terminal differentiation probability into F2 and F9 (j). k, Combined RNA in situ hybridization (POSTN) and immunofluorescence (ACTA2) in MI. l, Study schematic for in vivo lineage tracing of FAP+ cells in Ang II/PE infusion model. m,n, Immunofluorescence and RNA in situ hybridization for Postn, ACTA2 and tdTomato 14 d post Ang II/PE infusion (m) with quantification (n) (n = 3 independent biological animals, unpaired two-tailed t-test). o, Heatmap of differentially expressed genes between F2 and F9 states (left) and TF enrichment analysis for F9 lineage using enrichR (right). p, Gene expression density plot for MEOX1 (top) and MEOX1 gene expression across pseudotime for three lineages (bottom). q, Venn diagram showing overlapping genes between genes linked to differentially accessible peaks and pseudobulk DE analysis from CITE-seq data highlights key genes identified at chromatin and RNA levels. r, Enrichment of overlapping genes from q across fibroblast cell states with a dot plot of the aggregated gene set score of all intersecting genes grouped by fibroblast cell state. Scale bars, 20 μm (d,k), 10 μm (m). DE, differential expression; ECM, extracellular matrix; FDL, force directed layout; Fib, fibroblast; IPF, idiopathic pulmonary fibrosis; MyoFib, myofibroblasts; PDAC/NSCLC, pancreatic ductal adenocarcinoma and non-small cell lung cancer; PF, pro-fibrotic fibroblasts. Schematics in h,l were created using BioRender (https://biorender.com).
Fig. 3 |
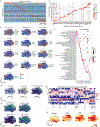
Fig. 3 |. Comparison of in vivo and in vitro models to study cardiac tissue fibrosis.
a, Reference mapped mouse MI fibroblasts onto human CITE-seq space with label-transfer (top) and prediction score for cells annotated in POSTN/FAP cluster. b, Cell composition from label-transferred cell states post-MI. c, Reference mapped mouse fibrosis model fibroblasts from Ang II/PE and TAC split by sham and injury. d, Prediction score for cells annotated in POSTN/FAP cluster from fibrosis models. e, Heatmaps of average cell prediction score of human fibroblast cell states (y axis) in annotated mouse fibroblasts (x axis) in MI, Ang II/PE and TAC. f, Experimental set-up of in vitro model. g, Reference mapped in vitro cell lines pre- and post-stimuli (control, TGFβ and IL-1β) onto human cardiac fibroblasts and corresponding cell compositions. h, Density plot of maximum prediction score for each cell from in vivo and in vitro systems merged and split by in vivo or in vitro condition. LAD, left anterior descending. Schematics in a,c,eh, were created using BioRender (https://biorender.com).
Fig. 4 |
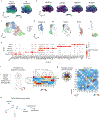
Fig. 4 |. CCR2 macrophages co-localize with and signal to fibroblasts via IL-1β in MI and HF.
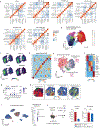
a, NicheNet predictions of differential signalling to fibroblasts in HF (AMI, ICM, NICM) relative to donor. b, IL-1β RNA expression in all cell types. c, IL-1β RNA expression in myeloid states (left) with corresponding CCR2 protein expression (middle), and IL-1β expression density and imputed CCR2 protein expression in an AMI IZ spatial transcriptomics sample (right). d, Immunofluorescence of IL-1β (red) in CCR2 GFP (green) mice at day 7 post Ang II/PE minipump implantation. e, Cell type deconvolution in human MI using SPOTlight with correlation scores. f, Cell state deconvolution and MISTy predictive analysis in n = 7 spatial ischaemic samples heatmap of predictor cell (y axis) and target cell (x axis). CCR2+ macrophage and F9 fibroblast cell state deconvolution scores shown. g, Immunofluorescence of CCR2 (red), FAP (green) and CD68 (white) in a human HF left-ventricle myocardium specimen. h, Average expression of IL-1β in macrophages versus POSTN in fibroblasts from corresponding HF patients. R2 indicates the regression coefficient and the P value tests whether the slope is significantly non-zero. i, RNAscope for POSTN (red) and CCR2 (white) in human AMI left-ventricle sections (left) with quantification of number of CCR2+ cells in POSTN low and high fields (right; n = 12 independent human samples, unpaired two-tailed t-test). j, Study design for IL-1R deletion in fibroblasts in mice with Ang II/PE minipump implantation. k, Flow cytometry gating of PDGFRα versus FAP in representative sham, Ang II/PE treated IL-1Rflox/flox and Ang II/PE + IL-1Rflox/floxDermo1Cre mouse hearts (left) and FAP+ fibroblasts/total fibroblasts quantified (right). l, Representative images of trichrome staining (left) and quantification of fibrosis at day 28 post Ang II/PE infusion (right). m, Wheat germ agglutin (WGA) staining of cardiomyocyte area quantification. For km, ordinary one-way analysis of variance (ANOVA) with Tukey multiple testing correction from independent biological animals. Error bars are ±s.e.m. Scale bars, 20 μm (d,g,i), 100 px (l). IF, immunofluorescence; IZ, infarct zone; Mac, macrophage; ST, spatial transcriptomics. Schematics in e,f,j, were created using BioRender (https://biorender.com).
Fig. 5 |
Fig. 5 |. CCR2 monocytes and macrophages drive fibroblast activation via IL-1β in cardiac fibrosis.
a, Study design for IL-1β deletion in CCR2 monocytes and macrophages in mice with Ang II/PE minipump implantation. b, Flow cytometry gating of PDGFRα versus FAP in representative sham, Ang II/PE treated IL-1βflox/flox and Ang II/PE treated + IL-1βflox/floxCCR2creERT2 mouse hearts (left) and FAP+ fibroblasts/total fibroblasts quantified (right). c, Transthoracic echocardiography measurements for end diastolic volume (EDV), end systolic volume (ESV), ejection fraction, E/e′, fractional shortening and left-ventricle mass index (LVMI) in sham, Ang II/PE treated IL-1βflox/flox and Ang II/PE treated + IL-1βflox/floxCCR2creERT2 mice. d, M-mode images in sham, Ang II/PE treated IL-1βflox/flox and Ang II/PE treated + IL-1βflox/floxCCR2creERT2 mice. e, Representative images of trichrome staining (left) and quantification of fibrosis at day 28 post Ang II/PE infusion (right). f, Experimental workflow for cardiac injury experiment with treatment with an anti-IL-1β mAb or isotype control. g, Flow cytometry gating of PDGFRα versus FAP in representative sham, Ang II/PE + isotype and Ang II/PE + anti-IL-1β mAb mouse hearts (left) and FAP+ fibroblasts/total fibroblasts quantified (right). h, 68Ga-FAPi-46 PET images from sham, Ang II/PE + isotype or anti-IL-1β mAb mice at day 7 (left) and quantification (right). i, Integrated UMAP for sham, isotype and anti-IL-1β mAb-treated mouse fibroblasts with annotated clusters (left), density plot of Postn (top right) and signature of genes downregulated in anti-IL-1β mAb relative to isotype control (bottom). j, Heatmap of key pro-fibrotic genes (row-normalized) grouped by three conditions with rows clustered by similarity. k, Pathways downregulated in anti-IL-1β mAb treatment relative to isotype following Ang II/PE using NCATS BioPlanet19 database. l, Fibrosis quantified by trichrome staining at day 28. Statistical tests in b, c, e, g, h and l are ordinary one-way ANOVAs with Tukey multiple testing correction from independent biological animals. Error bars are ±s.e.m. Scale bar, 200 px (e). %ID, percent intensity dose; q3day, every 3 days; TAM, tamoxifen. Schematics in a,f, were created using BioRender (https://biorender.com).

Update of

References

    1. Medzhitov R Origin and physiological roles of inflammation. Nature 454, 428–435 (2008). - PubMed
    1. Frangogiannis NG Cardiac fibrosis. Cardiovasc. Res 117, 1450–1488 (2021). - PMC - PubMed
    1. Rurik JG et al. CAR T cells produced in vivo to treat cardiac injury. Science 375, 91–96 (2022). - PMC - PubMed
    1. Aghajanian H et al. Targeting cardiac fibrosis with engineered T cells. Nature 573, 430–433 (2019). - PMC - PubMed
    1. Gutstein DE & Fuster V Pathophysiology and clinical significance of atherosclerotic plaque rupture. Cardiovasc. Res 41, 323–333 (1999). - PubMed

MeSH terms