. 2024 Oct;634(8036):1211-1220.
doi: 10.1038/s41586-024-08070-z. Epub 2024 Oct 23.

Machine-guided design of cell-type-targeting cis-regulatory elements

Affiliations

Machine-guided design of cell-type-targeting cis-regulatory elements

Sager J Gosai et al. Nature. 2024 Oct.

Abstract

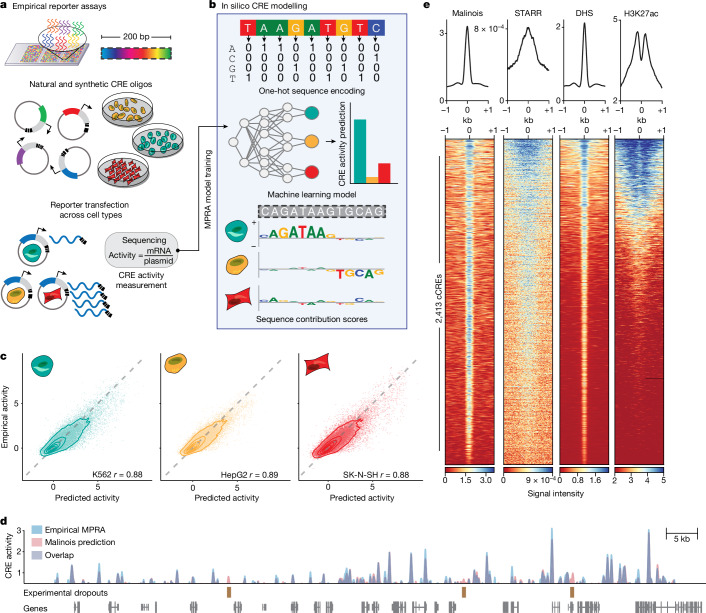
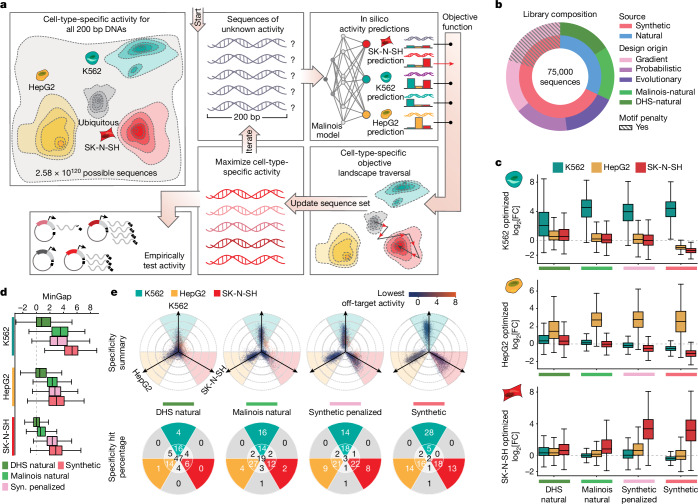
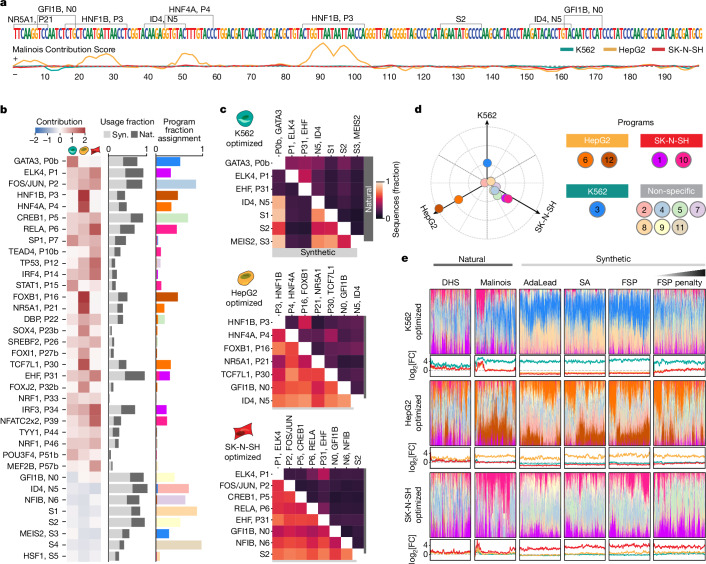
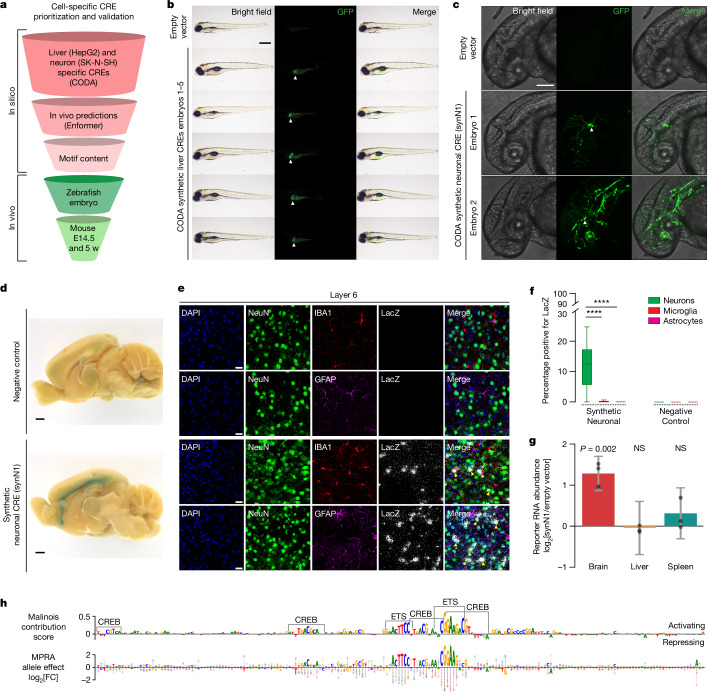
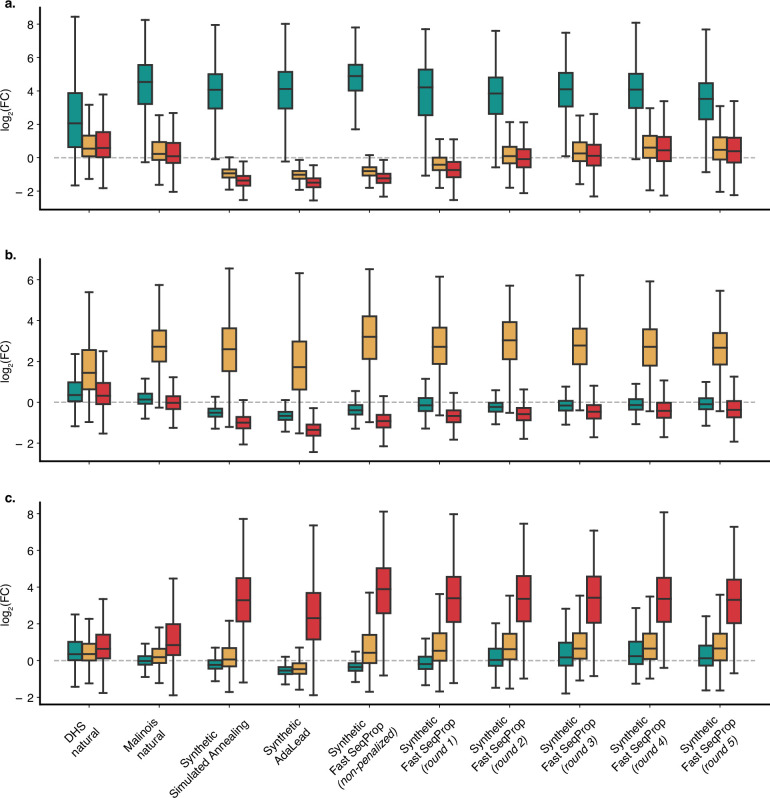
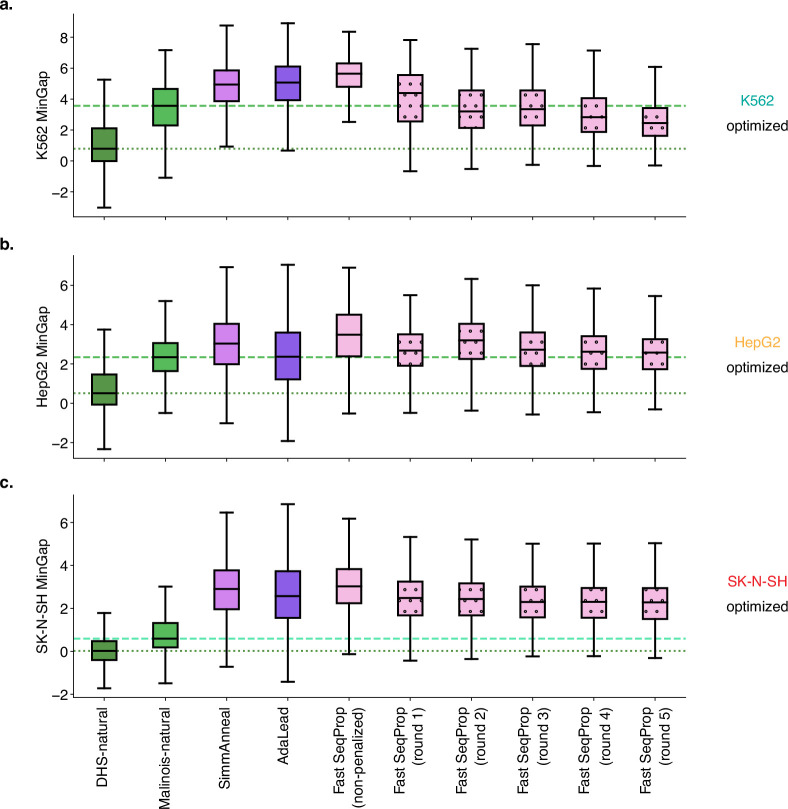
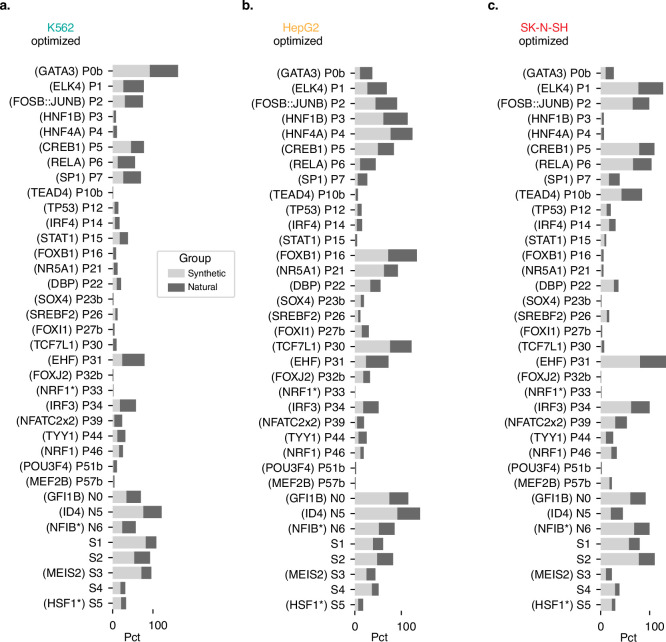
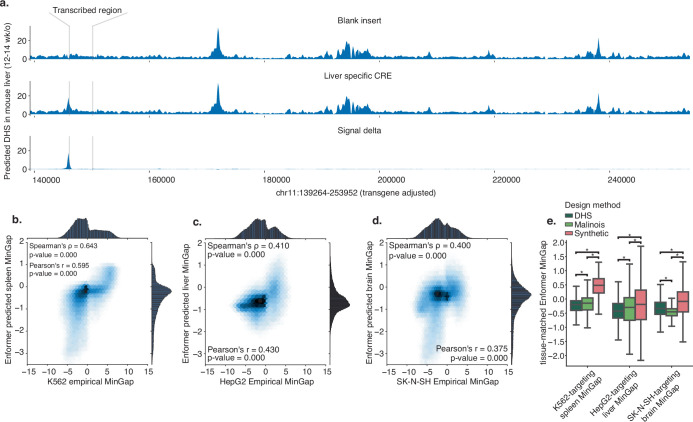
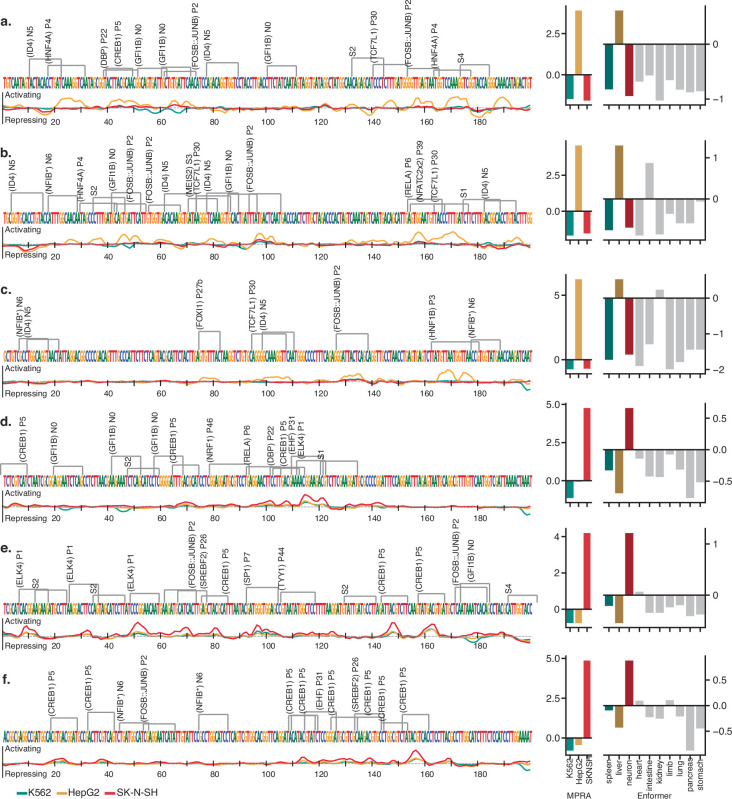
Cis-regulatory elements (CREs) control gene expression, orchestrating tissue identity, developmental timing and stimulus responses, which collectively define the thousands of unique cell types in the body1-3. While there is great potential for strategically incorporating CREs in therapeutic or biotechnology applications that require tissue specificity, there is no guarantee that an optimal CRE for these intended purposes has arisen naturally. Here we present a platform to engineer and validate synthetic CREs capable of driving gene expression with programmed cell-type specificity. We take advantage of innovations in deep neural network modelling of CRE activity across three cell types, efficient in silico optimization and massively parallel reporter assays to design and empirically test thousands of CREs4-8. Through large-scale in vitro validation, we show that synthetic sequences are more effective at driving cell-type-specific expression in three cell lines compared with natural sequences from the human genome and achieve specificity in analogous tissues when tested in vivo. Synthetic sequences exhibit distinct motif vocabulary associated with activity in the on-target cell type and a simultaneous reduction in the activity of off-target cells. Together, we provide a generalizable framework to prospectively engineer CREs from massively parallel reporter assay models and demonstrate the required literacy to write fit-for-purpose regulatory code.


Conflict of interest statement

P.C.S. is a co-founder of and consultant to Sherlock Biosciences and Board Member of Danaher Corporation. P.C.S. and R.T. have filed intellectual property related to MPRA. S.J.G., R.I.C., S.K.R., P.C.S. and R.T. have filed a provisional patent application related to work described here. The other authors declare no competing interests.

Figures

Fig. 1
Fig. 1. Malinois accurately predicts transcriptional activation by CREs in episomal reporters.
a, Empirical MPRAs enable targeted functional characterization of the effects of hundreds of thousands of CREs on transcription in episomal reporters, and can quantify the impact of programmable 200 bp oligonucleotide sequences. MPRAs across multiple cell types enable the identification of cell-type-specific activity of CREs. b, Malinois is a deep CNN model that predicts cell-type-specific CRE effects directly from the nucleotide sequence in K562 (teal), HepG2 (yellow) and SK-N-SH (red) cells. Contribution scores extracted from the model determine how subsequences drive predicted function in each cell type. c, Malinois predictions are highly correlated with empirically measured MPRA activity across K562 (teal), HepG2 (yellow) and SK-N-SH (red) cells. The performance for each cell type was measured using Pearson correlation (r) analysis of a test set of sequences that were withheld from training (n = 62,562 oligos, P < 10−300). Each point corresponds to the empirical and predicted activity of a single CRE in the corresponding cell type, and the topological lines indicate the point density (16.7%, 33.3%, 50%, 66.7%, 83.3%) in the scatter plots. Train–test splits were defined by chromosomes. d, Malinois predictions recapitulate an MPRA screen of overlapping fragments derived from a 2.1 Mb window centred on the GATA1 gene (Pearson’s r = 0.91, n = 51,242 oligos, P < 10−300; Supplementary Fig. 3). Purple signal indicates overlapping measurements, and the blue and red signals indicate either higher activity measurements or predictions by MPRA or Malinois, respectively, in the window chromosome X: 48000000–49000000. e, Malinois activity predictions for sequences centred on candidate CREs (cCRE) in chromosome 13 demarcated by DHS peaks in K562 cells (n = 2,413 peaks). This pattern of activation is concordant with quantitative signals measured using STARR-seq, DHS-seq and H3K27ac ChIP-seq.
Fig. 2
Fig. 2. CODA effectively designs cell-type-specific CREs.
a, CODA designs synthetic elements by iteratively updating sequences to improve predicted function. Malinois predicts CRE activity and an objective function directs sequence updates. After a stopping criteria is met, candidates are nominated for experimental validation. b, The MPRA library composition used to empirically evaluate candidate CREs. c, The distribution of MPRA log2[FC] measurements, each row of the boxes corresponds to candidate CREs intended to drive specific expression in K562, HepG2 and SK-N-SH cells, respectively. Each box indicates measurements in either K562 (teal), HepG2 (yellow) or SK-N-SH (red) cells for the set of sequences nominated by the indicated design strategy on the x axis (left to right, top to bottom, n = 3,729; 3,410; 4,800; 10,867; 3,757; 3,727; 4,735; 10,917; 3,261; 3,804; 4,866; 11,677 elements). d, The distribution of MinGap scores (box plots), quantifying specificity; the colour indicates the intended target cell type (K562, teal; HepG2, yellow; SK-N-SH, red; n values are as described in c, ordered from top to bottom). For the box plots in c and d, the centre line shows the 50th percentile, the box limits show the 25th and 75th percentiles, and the whiskers indicate the outermost point within 1.5× the interquartile range from the edges of the boxes. Syn. indicates synthetic. e, Propeller plots for each sequence group (top). The radial distance corresponds to the distance between the maximum and minimum cell type activity values, and the angle of deviation from an axis quantifies the relative activity of the highest off-target cell type (Methods). The dot colours indicate minimum activity across cell types. Bottom, the percentages of points in each delimited area rounded to the nearest integer. The groups synthetic and synthetic-penalized were randomly subsampled to resemble the size of the two natural groups. From left to right, n = 10,747; 10,941; 12,000 and 12,000 (Supplementary Fig. 8).
Fig. 3
Fig. 3. Interpreting functional sequence content.
a, Malinois contribution scores of a representative synthetic CRE designed to drive HepG2-cell-specific expression. Enriched motifs are demarcated above the sequence and contribution scores are plotted below (K562, teal; HepG2, yellow; SK-N-SH, red) (Methods). b, The average contributions of core motifs in K562, HepG2 and SK-N-SH cells (left to right columns) (left). Middle, motif enrichment in synthetic (light grey) and natural (dark grey) sequences. The x axis represents fraction of sequences in each group containing the motif denoted on the y axis. Right, motif program association derived from the NMF feature matrix. The colours correspond to programs listed in d. c, Co-occurrences of enriched motifs. The colour indicates the percentage of sequences in each group containing a pair of motifs (Methods and Supplementary Fig. 13). The upper and lower triangular percentages correspond to natural and synthetic sequences, respectively. d, The empirical program function was calculated using a weighted average of MPRA log2[FC] scores based on program mixture displayed in e. Ten specificity-driving programs were identified using the same criteria applied to sequences (bright coloured points). Seven programs are not associated with cell-type-specific transcription (pastel colours). Program 11 is overplotted by program 8, and program 4 partially obstructs program 9 on the plot. e, NMF decomposition of synthetic and natural sequences based on enriched motif content. For each sequence, programs are coloured based on the key in d and are plotted as a fraction of the total program content. Sequences not assigned to any program with any frequency yield a blank bar. Line plots display empirical activity in K562 (teal), HepG2 (yellow) and SK-N-SH (red) cells. SA, simulated annealing; FSP, Fast SeqProp. Sequences in each subpanel are sorted by hierarchical clustering based on program content (FSP penalty, n = 5,000; all others, n = 4,000).
Fig. 4
Fig. 4. In vivo validation of synthetic elements.
a, Synthetic CREs in vivo validation prioritization. b, CODA-designed HepG2-cell-specific CRE activity imaging in transgenic zebrafish at 96 h after fertilization. Lateral view, anterior on the left, dorsal up. The liver is indicated by white arrows. Liver expression was observed in 27 out of 36 animals (Supplementary Fig. 18). Scale bar, 500 μm. c, CODA-designed SK-N-SH-cell-specific CRE activity imaging in transgenic zebrafish at 48 h after fertilization. Lateral view of the brain and anterior spinal region, anterior left, dorsal up. The white arrows indicate GFP-positive neuronal cells. Embryo 2 shows incidental off-target vasculature expression. Neural staining was replicated in an additional animal. Scale bar, 125 μm. d, Synthetic SK-N-SH-cell-specific CRE (synN1) activity in 5-week-old postnatal mice measured by X-gal staining for LacZ in the medial brain section. Cortical X-gal signal was detected in n = 0 out 5 negative controls and n = 3 out of 6 synN1s. Scale bars, 1 mm. e, CRE activity (LacZ) in neocortex layer 6 with neuronal (NeuN), microglial (IBA1) and astrocyte (GFAP) co-staining. Top, control transgene activity. Bottom, synN1 activity. The arrows indicate colocalization between LacZ signals and neurons. Scale bars, 20 μm. Results were replicated in n = 3 negative control and synN1 mice each, using n = 5 sagittal slices per mouse. f, The proportion of neurons, astrocytes and microglia positive for the transgene. n = 3 mice. Statistical analysis was performed using Kruskal–Wallis one-way analysis of variance; ****adjusted P < 10−4. For the box plots, the centre line shows the 50th percentile, the box limits show the 25th and 75th percentiles, and the whiskers indicate the outermost point within 1.5× the interquartile range from the edges of the boxes. g, LacZ expression by synN1 was measured using RNA-sequencing (RNA-seq) normalized to the lacZ expression in transgenic mice for the minP empty vector. Data are mean ± s.e.m. Statistical analysis was performed using two-sided Wald tests. n = 3 mice per genotype. h, synN1 functional characterization. Top, SK-N-SH cell contribution scores. ETS- and CREB-like binding motifs are highlighted. Bottom, single-nucleotide MPRA saturation mutagenesis. The circles represent the expression change from each mutation (A, green; C, blue; G, yellow; T, red). The letter height represents the negative mean mutational expression change.
Extended Data Fig. 1
Extended Data Fig. 1. Cell type accuracy of model.
(a) Cross cell-type activity comparisons between empirical measurements and Malinois predictions organize and correlate similarly to empirical-to-empirical comparisons. Top scatter plots: empirical vs empirical cross-cell-type log2(FC). Bottom scatter plots: empirical vs predicted cross-cell-type log2(FC). Number of sequences n = 62,582. Pearson correlation coefficients are shown in the left-bottom corner of each scatter plot. All p-values < 1e-300. (b) Malinois can be used to identify highly active cell type-specific CREs. MinGap scores calculated using Malinois predictions correlate well with MPRA MinGap measurements for sequences in the held-out test set. Points are coloured based on correct prediction of maximally active cell type by Malinois. (c) Malinois predictions of cell type associated with maximum CRE function are more accurate for sequences with high empirical specificity. Stacked bar plot displaying number of sequences in the test set falling into discrete bins based on an empirically measured MinGap threshold. Lower boundary of each bin is indicated on the x-axis and hue delineates sequences that are categorized correctly (blue) or incorrectly (orange). Number of sequences n = 62,582, p-value < 1e-300.
Extended Data Fig. 2
Extended Data Fig. 2. Malinois concordance with DHS/H3K27ac/STARR.
(a) Malinois genome-wide predictions correspond well with DHS signal in HepG2. Deeptools plots of Malinois genome-wide predictions and DHS signal centred at DHS peaks in HepG2 cell lines on chromosome 13 (n = 1,188 peaks). (b) DHS signal and Malinois genome-wide predictions are also similar in SK-N-SH. Similar Deeptools plots to a except using SK-N-SH derived data (n = 3,512 peaks). (c) Malinois genome-wide predictions are significantly associated with candidate CRE mapping (DHS-seq, and H3K27ac ChIP-seq) and orthogonal signals of CRE functional characterization (STARR-seq). Boxplots display average signal generated by Malinois genome-wide predictions within peaks on chromosome 13 annotated using DHS, H3K27ac, or STARR-seq (orange) compared to paired upstream (blue) and downstream (green) flanking regions. Boxes demarcate the 25th, 50th, and 75th percentile values, while whiskers indicate the outermost point within 1.5 times the interquartile range from the edges of the boxes. Stars indicate a significant (p-value < 10−100) for two t-tests comparing signals within peaks and both upstream and downstream regions outside of peaks (from left-to-right, comparisons made using n = 2,413; 1,188; 3,512; 836; 1,119; 1,993; 1,157; and 1,670 peaks).
Extended Data Fig. 3
Extended Data Fig. 3. Annotation of naturally occurring sequences.
(a) Sequences nominated by DHS accessibility (DHS-natural) and by Malinois (Malinois-natural) were intersected with ENCODE cCREs (promoter-like sequences, proximal enhancer-like sequences, distal enhancer-like sequences, and CTCF-only) to determine overlap with existing putative regulatory elements. 94% of DHS-natural sequences intersect a cCRE while only 34.2% of Malinois-natural sequences intersect a cCRE suggesting that Malinois may exploit sequences features not captured by typical cCRE measures to select a sequence that drives cell type-specific activity. (b) To explore additional genomic features that may overlap DHS-natural and Malinois-natural sequences were annotated using annotatePeaks.pl from the HOMER suite. Annotations were generated for the whole genome (hg38), the DHS-natural and Malinois-natural libraries as a whole, as well as DHS-natural and Malinois-natural by individual cell type. DHS-natural and Malinois-natural largely resemble the distribution of annotations genome-wide barring an overrepresentation of simple repeats in Malinois-natural sequences driven by SK-N-SH sequences. Despite this, selected sequences seem to be a representative sample of genomic features. (c) DHS-natural and Malinois-natural sequences were intersected to determine overlap between naturally occurring sequences. Notably overlap was minimal between selection methods (0.10%-4.1%) depending on cell type.
Extended Data Fig. 4
Extended Data Fig. 4. Library prediction validation plots.
(a) Prospective Malinois predictions of candidate cell type-specific CRE activity is correlated with experimental measurements across all three tested cell types. The scatter plot corresponds to predictions and measurements made in K562. Solid contour lines demarcate 95% density of points corresponding to candidate CRE expected to drive expression in K562. Dotted contour lines indicate 95% density of CREs expected to drive specific expression in one of the other two cell types. Colour indicates sequence selection or generation method. One-dimensional density estimates along axes share the same line style and colour associations. Sequences with a replicate log2FC standard error greater than 1 in any cell type were omitted from the plots. Number of sequences n = 69,550; p-values < 1e-300. (b) Same as a, but in HepG2. Number of sequences n = 69,550; p-values < 1e−300. (c) Same as a, but in SK-N-SH. Number of sequences n = 69,550; p-values < 1e-300.
Extended Data Fig. 5
Extended Data Fig. 5. Empirical library activity.
(a) Empirical log2(Fold-Change) activity measured in K562 (teal), HepG2 (gold), and SK-N-SH (red) for sequences targeting K562 binned by design method group. Boxes demarcate the 25th, 50th, and 75th percentile values, while whiskers indicate the outermost point within 1.5 times the interquartile range from the edges of the boxes. Number of sequences left-to-right n = 3,729; 3,410; 3,584; 3,545; 3,738; 955; 958; 967; 958; 962. (b) Same as (a) except sequences targeting HepG2. Number of sequences left to right n = 3,757; 3,727; 3,703; 3,531; 3,683; 917; 938; 961; 953; 966. (c) Same as (a) except sequences targeting SK-N-SH. Number of sequences left to right n = 3,261; 3,804; 3,894; 3,868; 3,915; 978; 968; 976; 972; 972.
Extended Data Fig. 6
Extended Data Fig. 6. Library MinGap.
(a) Malinois improves identification of CREs with K562-specific activity and synthetic sequence generation enables creation of CREs with enhanced functions. Distribution of MPRA-measured K562-specific activity in various candidate CRE groups. Green and aquamarine lines indicate median MinGap of DHS-natural and Malinois-natural candidates respectively. Sequences with a replicate log2FC standard error greater than 1 in any cell type were omitted from the plots. Boxes demarcate the 25th, 50th, and 75th percentile values, while whiskers indicate the outermost point within 1.5 times the interquartile range from the edges of the boxes. Number of sequences left to right n = 3,729; 3,410; 3,584; 3,545; 3,738; 955; 958; 967; 958; 962. (b) Same as (a) except quantification of candidate sequences targeting HepG2. Number of sequences left to right n = 3,757; 3,727; 3,703; 3,531; 3,683; 917; 938; 961; 953; 966. (c) Same as (a) except quantification of candidate sequences targeting SK-N-SH. Number of sequences left to right n = 3,261; 3,804; 3,894; 3,868; 3,915; 978; 968; 976; 972; 972.
Extended Data Fig. 7
Extended Data Fig. 7. Motif enrichment by cell type target.
(a) Motif representation in K562-optimized sequences only. Bar width indicates the fraction of natural (dark grey) or synthetic (light grey) K562-optimized sequences containing the motif. (b) Same as (a) but in HepG2-optimized. (c) Same as (a) but in SK-N-SH-optimized.
Extended Data Fig. 8
Extended Data Fig. 8. Enformer based prioritization of oligos for in vivo tests.
(a) Enformer can predict CRE-driven changes in epigenetic and transcription dynamics of transgenes inserted into the H11 safe harbour locus in mice. Three example sequence tracks display predicted DHS signals observed in the livers of 15.5 day old mice. Transgene transcription start site and poly-adenylation signal are indicated by the grey bars. The first track is the predicted signal when the input sequence at the CRE insertion site is all Ns. The second track is an example predicting using a validated HepG2-specific synthetic CRE. The third displays the differential DHS effect. (b) Empirical K562 MinGap measurements are well correlated with Enformer-predicted features of spleen-specific transcriptional activation (Methods). (c) Empirical HepG2 MinGap measurements are also well correlated with Enformer-predicted features of liver-specific transcriptional activation. (d) Empirical SK-N-SH MinGap measurements are also well correlated with Enfomer-predicted features of neural-specific transcriptional activation. (e) Enformer-based cell type matched tissue-specific transcriptional activation predictions (K562 matched to spleen, HepG2 matched to liver, SK-N-SH matched to adult brain). Stars indicate family-wise error rate corrected p-values < 1e-4 (In each trio of boxes, n = 4,000; 4,000; 12,000 elements for the DHS, Malinois, and synthetic groups, respectively).
Extended Data Fig. 9
Extended Data Fig. 9. Malinois contribution scores/Enformer/MPRA results for in vivo sequences.
Collection of synthetic sequences prioritized for in vivo validation. Sequences in panels (a-c) and (d-f) are expected to drive expression in liver and neurons, respectively. Left column: Nucleotide sequence, motif matches, and contribution score tracks for each candidate. Right column: Bar plots of empirical MPRA signal (left y-axis) in K562 (teal), HepG2 (gold), and SK-N-SH (red) as well as aggregated Enformer predictions (right y-axis) of epigenetic signals reflecting transcriptional activation in mouse spleen (dim teal), liver (dim gold), neural tissue (dim red), heart, intestine, kidney, limb buds, lung, pancreas, and stomach.
Extended Data Fig. 10
Extended Data Fig. 10. Immunohistochemistry of N1 CRE activity in the mouse cortex.
(a) Representative fluorescence and brightfield images showing expression patterns of neuronal marker, NeuN (top left) and LacZ (top right) across the whole brain. Boxed regions represent the somatosensory cortex (S) and visual cortex (V), digitally zoomed in bottom image; scale bars: 1 mm (top images) and 100 µm (bottom images). Yellow arrows indicate LacZ expression in layer 6. (b) Fluorescence intensity profile plots from quantification of LacZ signal intensity across layers in the somatosensory cortex and visual cortex for non-transgenic control (blue) and N1 CRE transgenic mouse (black).

Update of

References

    1. Meuleman, W. et al. Index and biological spectrum of human DNase I hypersensitive sites. Nature584, 244–251 (2020). - PMC - PubMed
    1. Heinz, S., Romanoski, C. E., Benner, C. & Glass, C. K. The selection and function of cell type-specific enhancers. Nat. Rev. Mol. Cell Biol.16, 144–154 (2015). - PMC - PubMed
    1. Donohue, L. K. H. et al. A cis-regulatory lexicon of DNA motif combinations mediating cell-type-specific gene regulation. Cell Genom.2, 100191 (2022). - PMC - PubMed
    1. Kelley, D. R., Snoek, J. & Rinn, J. L. Basset: learning the regulatory code of the accessible genome with deep convolutional neural networks. Genome Res.26, 990–999 (2016). - PMC - PubMed
    1. Linder, J. & Seelig, G. Fast activation maximization for molecular sequence design. BMC Bioinform.22, 510 (2021). - PMC - PubMed

Publication types

MeSH terms

LinkOut - more resources