. 2024 Dec;636(8043):647-653.
doi: 10.1038/s41586-024-08101-9. Epub 2024 Oct 23.

Coral photosymbiosis on Mid-Devonian reefs

Affiliations

Coral photosymbiosis on Mid-Devonian reefs

Jonathan Jung et al. Nature. 2024 Dec.

Abstract

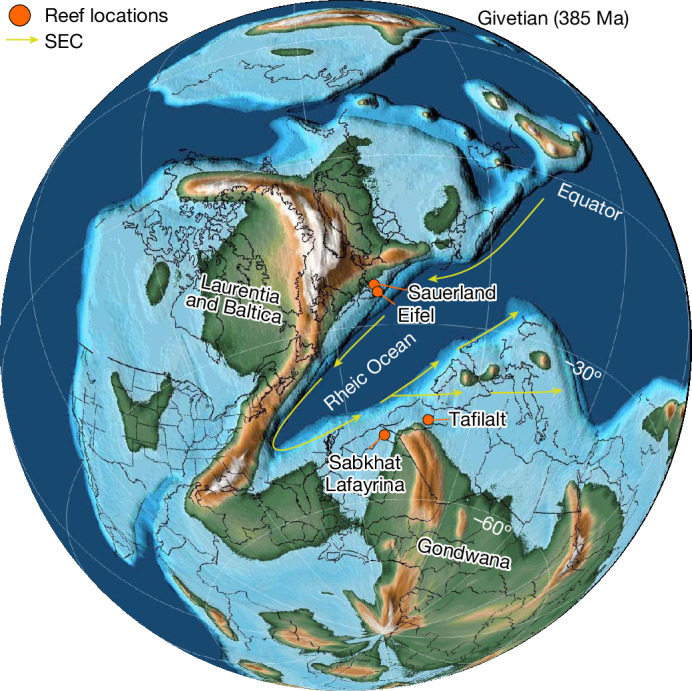
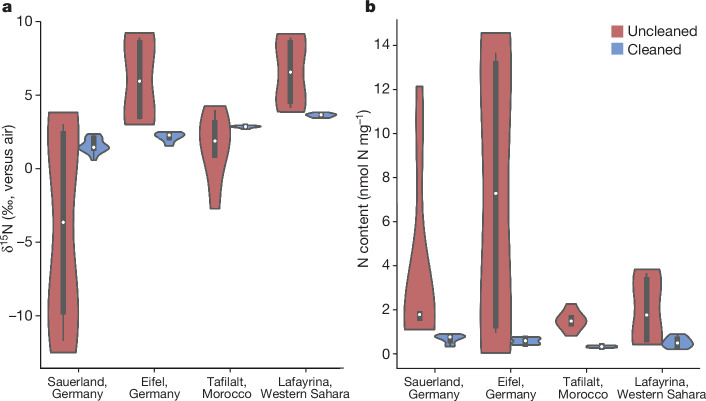
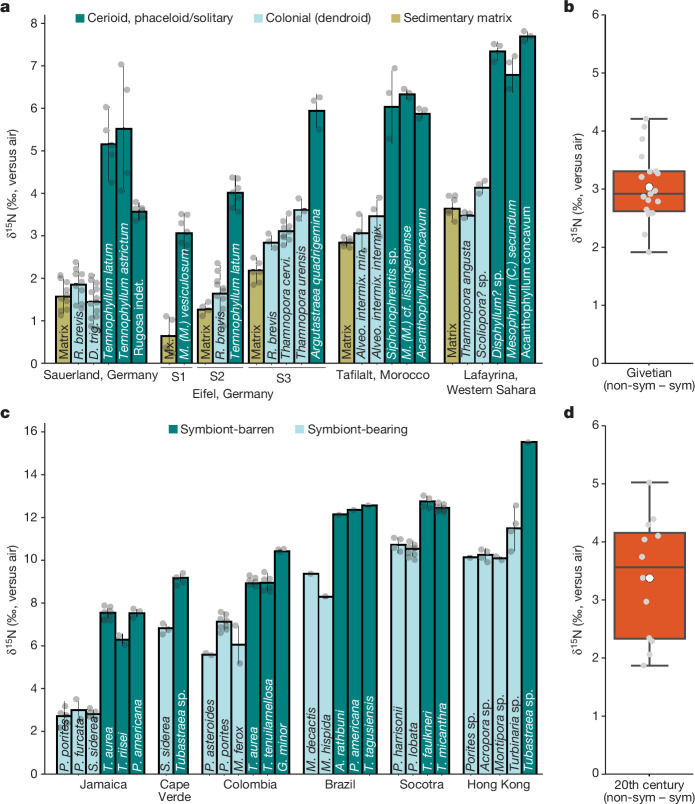
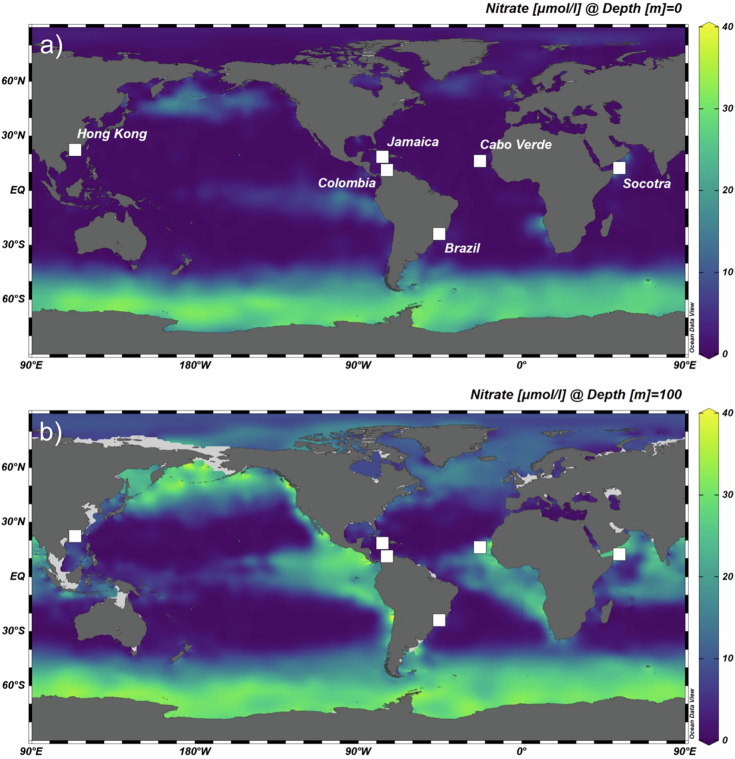
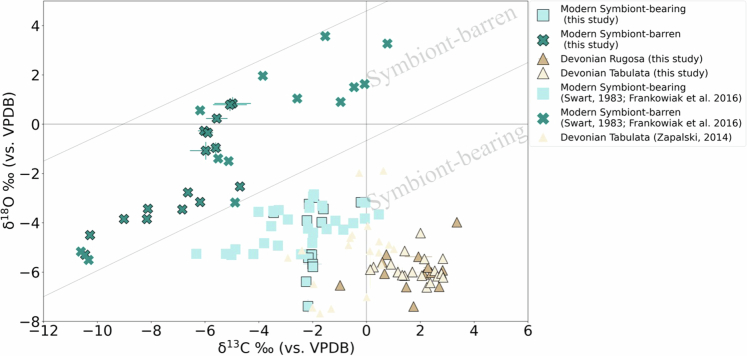
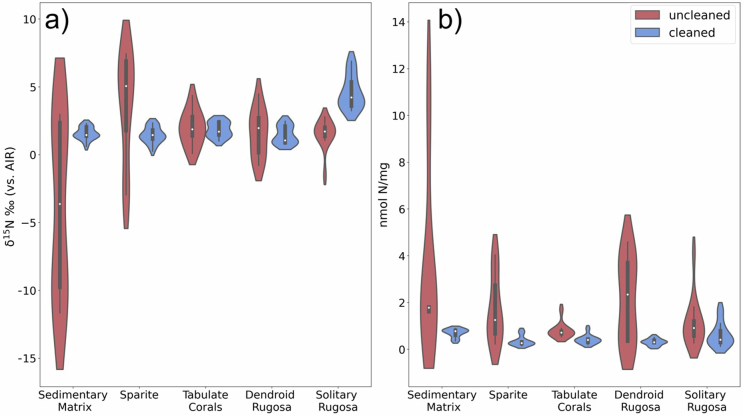
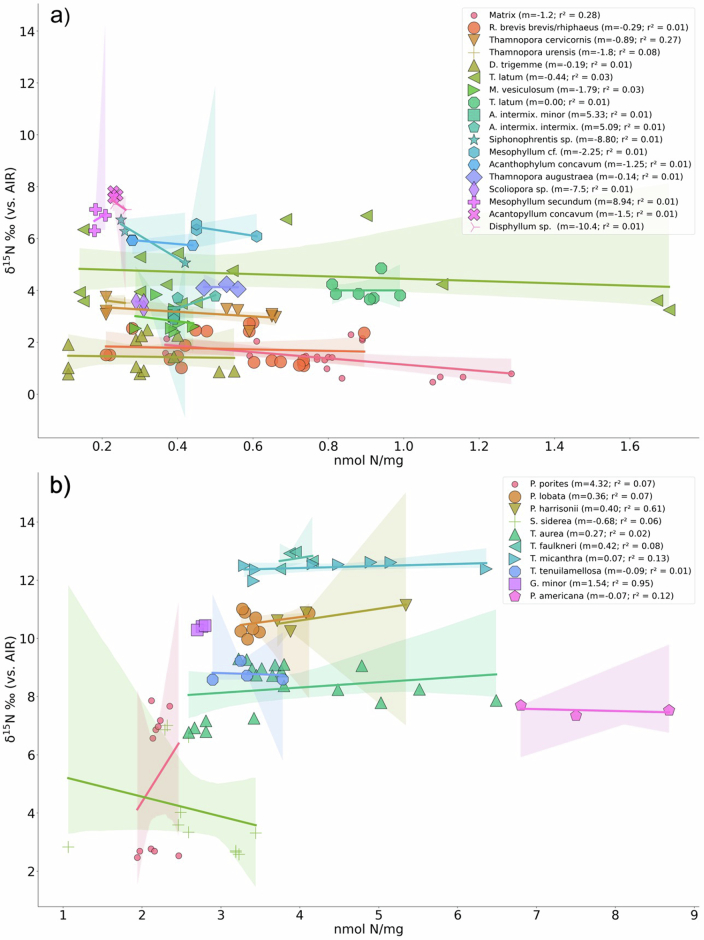
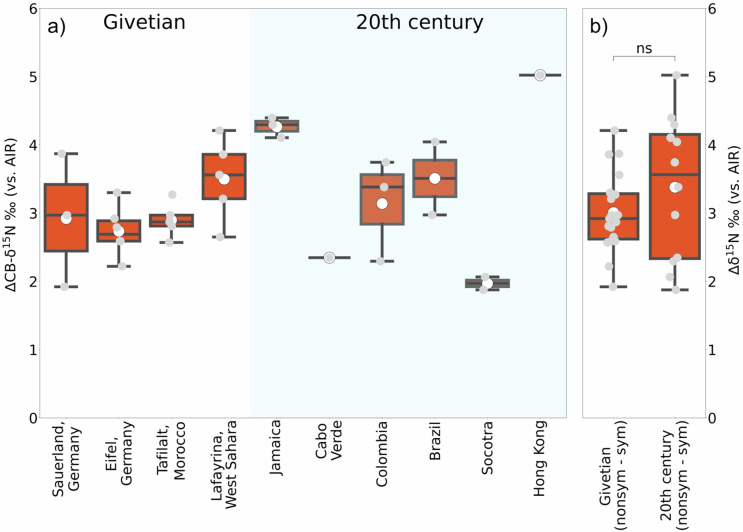
The ability of stony corals to thrive in the oligotrophic (low-nutrient, low-productivity) surface waters of the tropical ocean is commonly attributed to their symbiotic relationship with photosynthetic dinoflagellates1,2. The evolutionary history of this symbiosis might clarify its organismal and environmental roles3, but its prevalence through time, and across taxa, morphologies and oceanic settings, is currently unclear4-6. Here we report measurements of the nitrogen isotope (15N/14N) ratio of coral-bound organic matter (CB-δ15N) in samples from Mid-Devonian reefs (Givetian, around 385 million years ago), which represent a constraint on the evolution of coral photosymbiosis. Colonial tabulate and fasciculate (dendroid) rugose corals have low CB-δ15N values (2.51 ± 0.97‰) in comparison with co-occurring solitary and (pseudo)colonial (cerioid or phaceloid) rugose corals (5.52 ± 1.63‰). The average of the isotopic difference per deposit (3.01 ± 0.58‰) is statistically indistinguishable from that observed between modern symbiont-barren and symbiont-bearing corals (3.38 ± 1.05‰). On the basis of this evidence, we infer that Mid-Devonian tabulate and some fasciculate (dendroid) rugose corals hosted active photosymbionts, while solitary and some (pseudo)colonial (cerioid or phaceloid) rugose corals did not. The low CB-δ15N values of the Devonian tabulate and fasciculate rugose corals relative to the modern range suggest that Mid-Devonian reefs formed in biogeochemical regimes analogous to the modern oligotrophic subtropical gyres. Widespread oligotrophy during the Devonian may have promoted coral photosymbiosis, the occurrence of which may explain why Devonian reefs were the most productive reef ecosystems of the Phanerozoic.


Conflict of interest statement

Competing interests: The authors declare no competing interests.

Figures

Fig. 1
Fig. 1. Sample locations relative to a palaeogeographic reconstruction of the continental configuration during the Givetian stage (around 387–382 Ma) of the Devonian period (around 419–359 Ma).
The palaeomap and palaeopositions were generated using GPlates based on the PALEOMAP project of Scotese,. The South Equatorial Current (SEC) is based on reconstructions and iterations thereof by Dopieralska, Jakubowicz et al. and Oczlon. The sampling locations are indicated in orange.
Fig. 2
Fig. 2. Comparison between cleaned and uncleaned sedimentary matrix samples.
a, Nitrogen isotope values (δ15N in ‰ versus air) of sedimentary matrix material, uncleaned (Sauerland: n = 10, Eifel: n = 6, Tafilalt: n = 6, Lafayrina: n = 6) and cleaned (Sauerland: n = 16, Eifel: n = 6, Tafilalt: n = 6, Lafayrina: n = 6). Cleaning reduced the spread in isotope values for the sedimentary matrix in the Sauerland (F = 837.56, P = 0.03), Eifel (F = 325.16, P = 0.02), Tafilalt (F = 8.54, P = 0.22) and Lafayrina (F = 292.49, P = 0.02) samples. The cleaned samples converged to mean δ15N values of between 0.62 and 3.82‰. b, Corresponding weight-normalized N content (in nanomole of N per milligram of powder). Overall, the N content was very low (less than 1 nmol N mg−1) but always higher in the uncleaned samples. Mean values are indicated by the white dots. The lower and upper hinges indicate the first and third quartiles, encapsulating the interquartile range (IQR). The whiskers extend to the smallest and largest values within 1.5 times the IQR from the hinges, depicting the spread of the data. The shape of the violin plot is defined by a kernel density estimate. Statistical significance tests were conducted using either a Welch’s t-test, given a similar sample size and a heterogeneous variance (indicated by F ≥ 1), or an individual t-test for similar sample sizes and variances (indicated by F ≤ 1).
Fig. 3
Fig. 3. Nitrogen isotope values of Palaeozoic and modern corals.
a, Cleaned CB-δ15N values (in ‰ versus air) of the sedimentary matrix, tabulate corals, dendroid rugose corals and solitary rugose corals from the Hagen-Balve Reef in Binolen, of the sedimentary matrix and a solitary rugose coral from the Dollendorf Syncline (S1), of the sedimentary matrix, tabulate corals and a solitary rugose coral from the Sötenich Syncline (S2), and of the sedimentary matrix, tabulate corals and a cerioid rugose coral from the Blankenheim Syncline (S3) of the Eifel region from the southern edge of Laurussia, bordering the Rheic Ocean. The sedimentary matrix, tabulate corals and solitary rugose corals from the present-day Tafilalt region of Morocco and the sedimentary matrix, tabulate corals, a phaceloid rugose coral and solitary rugose corals from Sabkhat Lafayrina, Western Sahara are from northern Gondwana. Several measurements of the same species were taken together, and the respective intraspecific variation (±1 standard deviation (s.d.)) is shown by vertical lines. b, Average isotopic differences (expressed as ∆δ15N = δ15Nnon-sym./solitary/ceroid − δ15Nsym./colonial) between the solitary and colonial species (n = 18). The white dot represents the average value, while the middle line represents the median value. The lower and upper bounds of the box correspond to the first and third quartiles. The upper whisker extends from the upper bound of the box to the largest value within 1.5 times the IQR from the hinge, while the lower whisker extends from the lower bound of the box to the smallest value within 1.5 times the IQR from the hinge. Values beyond the whiskers are considered outliers and are plotted individually. c, δ15N of symbiont-bearing and symbiont-barren species from Jamaica, Cabo Verde, the Caribbean side of Colombia, Brazil and Hong Kong. All corals were taken from the same reef depth and are the same age. d, Average difference between the symbiont-barren (non-sym.) and symbiont-bearing (sym.) species from all locations (n = 12). Mx., matrix.
Extended Data Fig. 1
Extended Data Fig. 1. Schematic sampling strategy and representative thin sections of Paleozoic corals.
a) Schematic representation of phases (sedimentary matrix, coral skeleton, sparite), which were carefully extracted. Cross section with distribution of phases in rugose corals b) schematic of Dendrostella trigemme and c) Temnophyllum latum. Note that each phase may yield contamination from the other, due to the skeletal architecture of analyzed corals (e.g., intra-skeletal sparite content). Microphotographs of thin sections (under transmitted light) of selected Givetian corals from d) the Blankenheim Syncline (Eifel Mountains, Germany), e)-f) Tafilalt (Morocco), and g)-h) Hagen Balve Reef (Sauerland, Germany). d) Tabulate (auloporid) coral Roemerolites brevis brevis (SMF40160). e) Solitary rugosa coral Acanthophyllum concavum (SMF75854). f) Solitary rugose coral Siphonophrentis sp. (SMF75855). g) Longitudinal and cross sections of fasciculate (dendroid) rugosa coral Dendrostella trigemme and fragments of the tabulate (auloporid) coral Roemerolites brevis rhiphaeus (GMM B2C.59-4). One cross section of D. trigemme (lower left) shows species-specific dendroid astogeny. h) Anastomosing branch of R. brevis rhiphaeus (GMM B2C.59-2), showing partial infilling of corallites by sparite and/or carbonate sediment. All scale bars: 2 mm.
Extended Data Fig. 2
Extended Data Fig. 2. Modern reef locations with respect to (sub-)surface nitrate concentrations.
a) Global surface nitrate concentrations with respect to of modern symbiont-bearing and symbiont-barren coral pairs. b) Global nitrate concentrations at 100 m depth. Visualizations were created with Ocean Data View Version 5.6.3 (Schlitzer, Reiner, Ocean Data View, https://odv.awi.de, 2023).
Extended Data Fig. 3
Extended Data Fig. 3. Oxygen and carbon isotope cross plot of modern and Paleozoic corals.
Scatterplot of oxygen and carbon isotope values measured on Paleozoic rugose and tabulate corals and their respective sedimentary matrix from the Hagen Balve Reef and Eifel region. Modern analogues of symbiont-bearing (light green squares) and symbiont-barren (dark green crosses) species from various locations were measured. A compilation of previously measured modern and fossil symbiont-bearing and symbiont-barren corals are also included from Swart (1983), and Frankowiak et al. and Zapalski 2014, where samples indicate distinct spaces for symbiont-bearing and symbiont-barren species as indicated by the respective field (adapted from Swart, 1983). Devonian values are shown as beige triangles, with darker and lighter brown tones indicating rugose and tabulate species, respectively. Notably, all Paleozoic samples from this study cluster within the symbiotic range and would indicate no difference between coral groups. Replicate measurements of the same species are taken together and the respective variation (±1 SD) is shown by horizontal (oxygen isotopes) or vertical lines (carbon isotopes).
Extended Data Fig. 4
Extended Data Fig. 4. Comparison of cleaned and uncleaned material from Sauerland.
Coral-bound nitrogen isotope values of three distinct coral groups and their surrounding material from the Hagen Balve Reef (in ‰ vs. air). Cleaned material (sedimentary matrix: n = 16, sparite: n = 20, tabulate corals: n = 10, dendroid rugose corals: n = 13, solitary rugose corals: n = 15) and uncleaned material (sedimentary matrix: n = 10, sparite: n = 12, tabulate corals: n = 10, dendroid rugose corals: n = 9, solitary rugose corals: n = 13) yield a significant difference for the sediment (F = 837.56, P = 0.03) and solitary rugose corals (F = 0.91, P = 3.6e-07) but not for sparite (F = 17.23, P = 0.09), dendroid rugose corals (F = 7.57, P = 0.83), or tabulate corals (F = 4.76, P = 0.79). b) Corresponding weight-normalized nitrogen content (in nmol N per mg of carbonate powder) is given. Overall, nitrogen content is very low but always higher in unclean samples. Mean values are indicated by the white dots. The lower and upper hinges indicate the first and third quartiles, encapsulating the inter-quartile range (IQR). The whiskers extend to the smallest and largest values within 1.5 times the IQR from the hinges, depicting the spread of the data. The shape of the violinplot is defined by a kernel density estimate (KDE). Statistical significance tests were conducted either by a Welch’s t-test given a similar sample size and a heterogenous variance (indicated by F ≥ 1) or an individual t-test for similar sample sizes and variances (indicated by F ≤ 1).
Extended Data Fig. 5
Extended Data Fig. 5. Cross plot of nitrogen isotope and nitrogen content values of Paleozoic and modern corals.
a) The relationship between nitrogen content per mg of cleaned carbonate powder and the nitrogen isotope composition of each species that was analyzed in the recent reefs. For each species, the slope (m) and correlation coefficient (r2) are given. Each colored envelope represents 95% confidence interval of the regression. b) The relationship between nitrogen content per mg of cleaned carbonate powder and the nitrogen isotope composition of each species that was analyzed on the Mid-Devonian reefs. For each species, the slope (m) and correlation coefficient (r2) are given.
Extended Data Fig. 6
Extended Data Fig. 6. Average nitrogen isotope difference from Paleozoic and modern corals at individual locations.
a) Average N isotopic differences between solitary and tabulate/fasciculate rugose species from the Mid-Devonian (Givetian) compared to the difference between modern symbiont-bearing and symbiont-barren corals. The white dot represents the average value whereas the middle line represents the median value. The lower and upper bound of the box correspond to the first and third quartiles. The upper whisker extends from the upper bound box to the largest value within 1.5 times the inter-quartile range (IQR) from the hinge, while the lower whisker extends from the lower bound box to the smallest value within 1.5 times the IQR from the hinge. Values beyond the whiskers are considered outliers and are plotted individually. b) Average differences between symbiont-barren and -bearing species based on location and expressed as ∆δ15N = δ15Nnon-sym. - δ15Nsym. Differences vary between 1.97‰ and 5.02‰ for all Givetian and modern samples. A Welch’s t-test for unequal variances indicates that there is no significant difference between the values of ∆δ15N from ancient reefs and the ∆δ15N differences between the co-occurring symbiont-bearing and -barren corals from modern reefs (F = 0.01, P = 0.27).

References

    1. Davy, S. K., Allemand, D. & Weis, V. M. Cell biology of cnidarian–dinoflagellate symbiosis. Microbiol. Mol. Biol. Rev.76, 229–261 (2012). - PMC - PubMed
    1. Fournier, A. The story of symbiosis with zooxanthellae, or how they enable their host to thrive in a nutrient poor environment. BioSciences Master Reviewshttps://biologie.ens-lyon.fr/biologie/ressources/bibliographies/pdf/m1-1... (2013).
    1. Coates, A. G. & Jackson, J. B. C. Clonal growth, algal symbiosis, and reef formation by corals. Paleobiology13, 363–378 (1987).
    1. Scrutton, C. T. The Palaeozoic corals, II: structure, variation and palaeoecology. Proc. Yorks. Geol. Soc.52, 1–57 (1998).
    1. Scrutton, C. T. The Palaeozoic corals, I: origins and relationships. Proc. Yorks. Geol. Soc.51, 177–208 (1997).

Substances

LinkOut - more resources