. 2024 Nov;635(8038):490-498.
doi: 10.1038/s41586-024-08088-3. Epub 2024 Oct 23.

Nuclear release of eIF1 restricts start-codon selection during mitosis

Affiliations

Nuclear release of eIF1 restricts start-codon selection during mitosis

Jimmy Ly et al. Nature. 2024 Nov.

Abstract

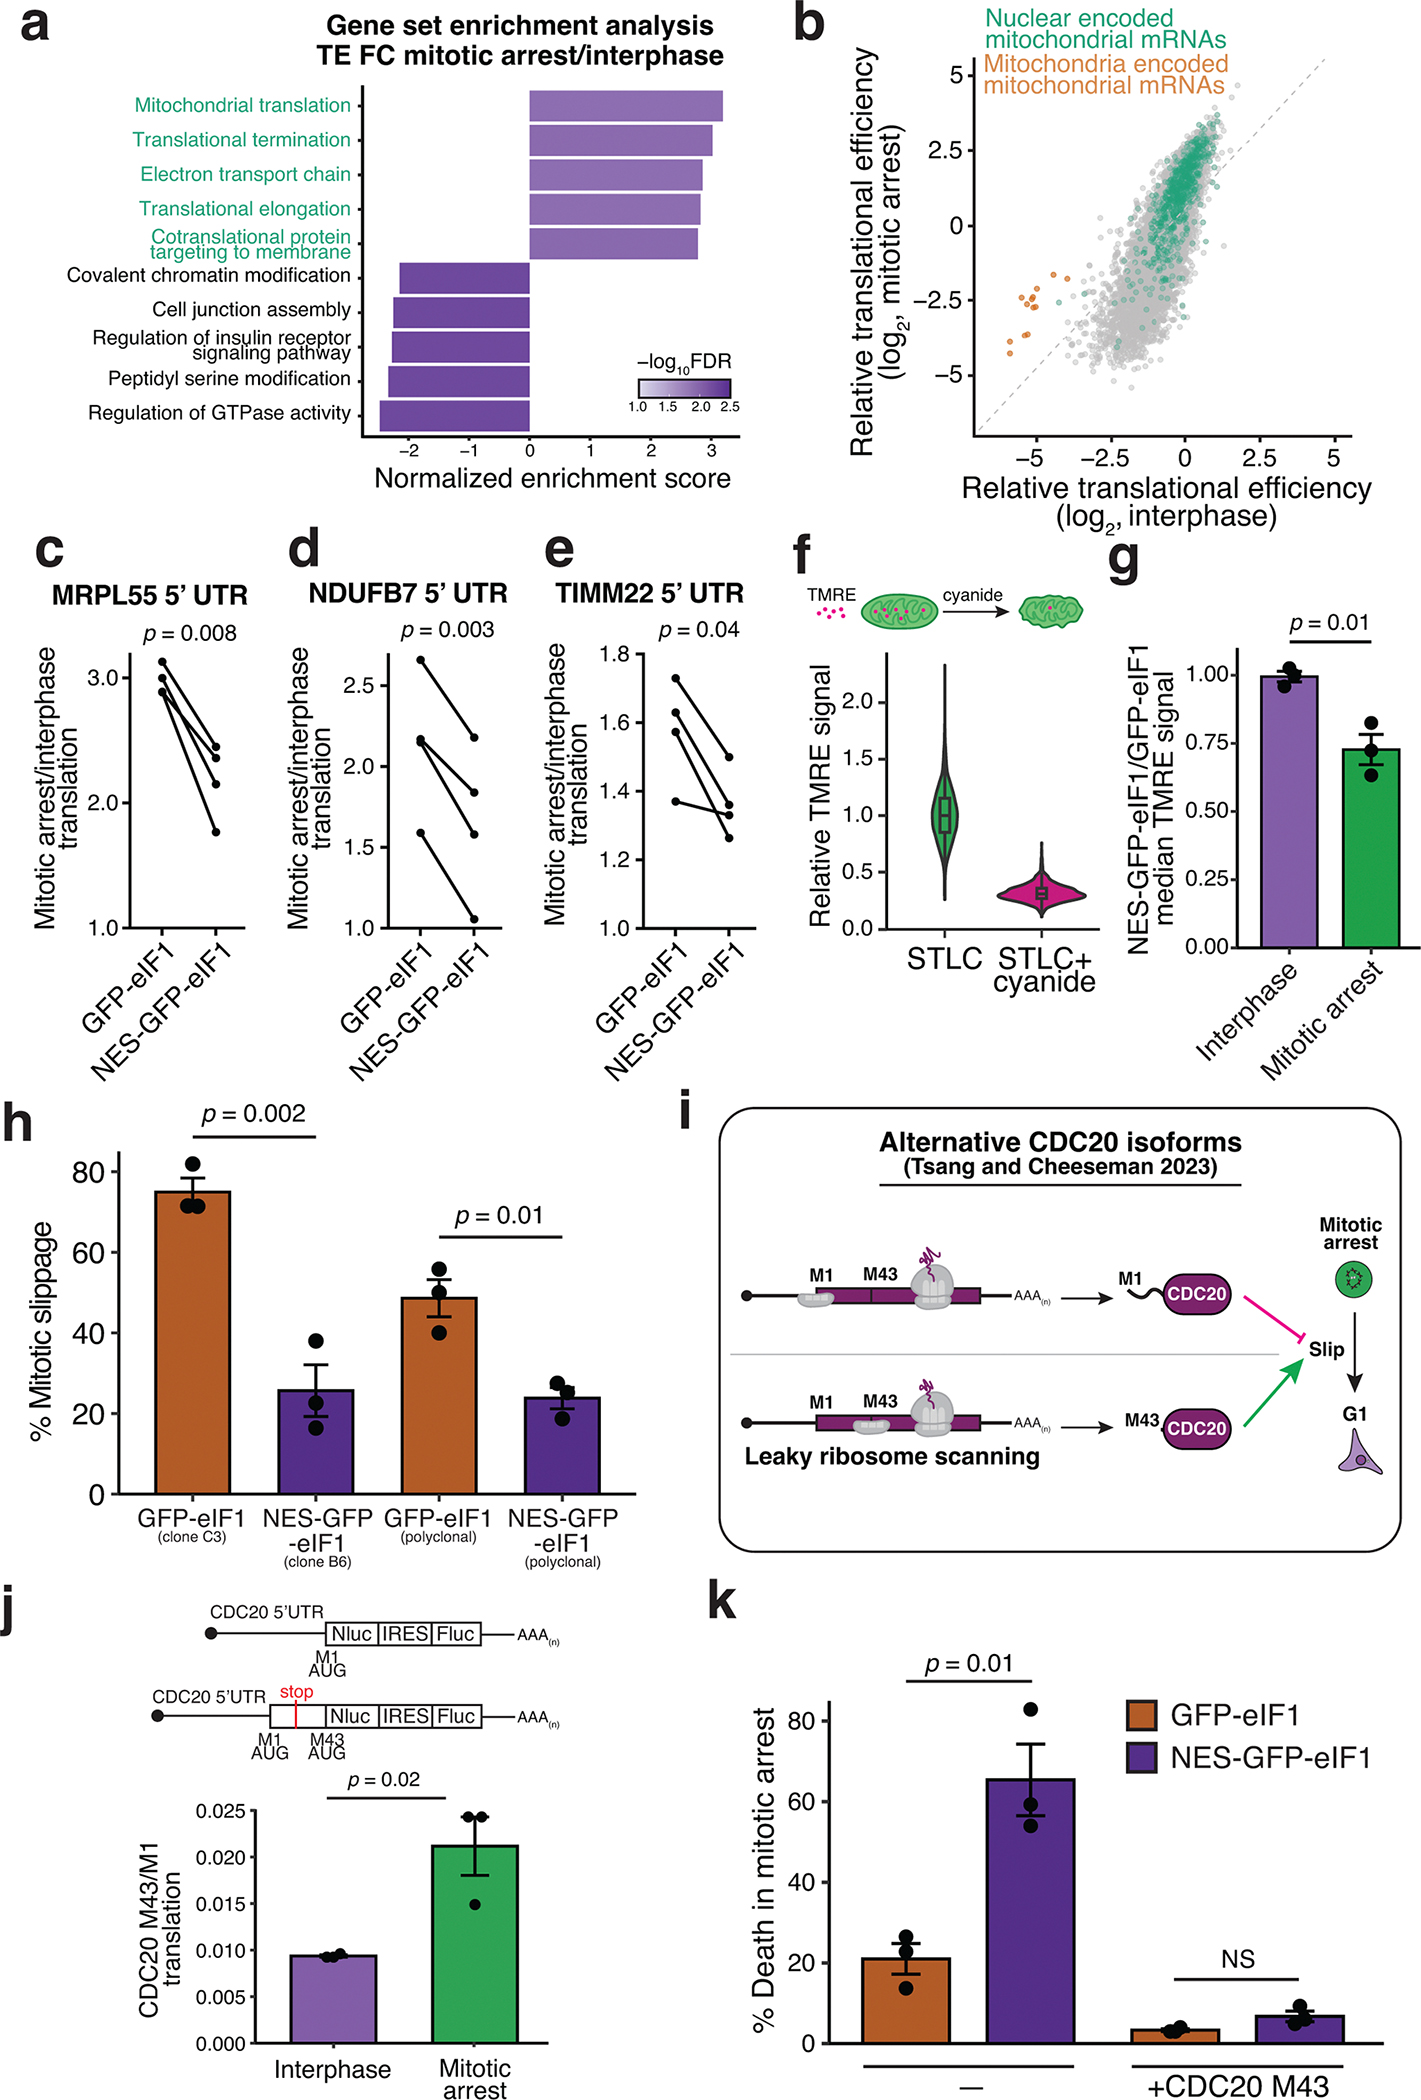
Regulated start-codon selection has the potential to reshape the proteome through the differential production of upstream open reading frames, canonical proteins, and alternative translational isoforms1-3. However, conditions under which start codon selection is altered remain poorly defined. Here, using transcriptome-wide translation-initiation-site profiling4, we reveal a global increase in the stringency of start-codon selection during mammalian mitosis. Low-efficiency initiation sites are preferentially repressed in mitosis, resulting in pervasive changes in the translation of thousands of start sites and their corresponding protein products. This enhanced stringency of start-codon selection during mitosis results from increased association between the 40S ribosome and the key regulator of start-codon selection, eIF1. We find that increased eIF1-40S ribosome interaction during mitosis is mediated by the release of a nuclear pool of eIF1 upon nuclear envelope breakdown. Selectively depleting the nuclear pool of eIF1 eliminates the change to translational stringency during mitosis, resulting in altered synthesis of thousands of protein isoforms. In addition, preventing mitotic translational rewiring results in substantially increased cell death and decreased mitotic slippage in cells that experience a mitotic delay induced by anti-mitotic chemotherapies. Thus, cells globally control stringency of translation initiation, which has critical roles during the mammalian cell cycle in preserving mitotic cell physiology.


Conflict of interest statement

Competing interests D.P.B. has equity in Alnylam Pharmaceuticals, where he is a co-founder and advisor. The other authors declare no competing interests.

Figures

Extended data Figure 1.
Extended data Figure 1.. Translation is required for viability during mitotic arrest.
(a) Left, scatter plot showing the gating strategy (dotted line) before monitoring live/dead population. Right, scatter plot showing the distribution of Annexin V (early apoptosis) and propidium iodide (late apoptosis) intensity in mitotically arrested cells treated with cycloheximide for 4 hours. (b) Quantification of annexin V positive cells in mitotic cells treated with cycloheximide and/or MG-132 for 2 or 4 hours. (c) Distribution of live/dead cells showing the cell viability of asynchronous HeLa cells treated with cycloheximide for various times. (d) Translational efficiency fold change between mitotically arrested and interphase cells, normalized to mitochondrial footprints. Black dotted line represents median translational efficiency fold change for cytoplasmic mRNAs between mitotically arrested and interphase cells. Orange line represents median of translational efficiency FC for the 13 mitochondrial coding mRNAs. The median translational efficiency of cytoplasmic mRNAs is 4-fold more repressed than mitochondrial mRNAs in mitosis relative to interphase.
Extended data Figure 2.
Extended data Figure 2.. Translation initiation site analysis quantitatively captures translation.
(a) Normalization strategy to calculate translation initiation efficiency for each start site. Reads mapping to the translation initiation site, quantified by RiboTISH, were normalized to matched length-normalized input RNA seq counts. (b) Metagene plot of normalized reads from main (top left), uORFs (top right), N-terminal extensions (bottom left), and N-terminal truncations (bottom right) from translation initiation site sequencing (magenta) and elongating ribosome profiling (dark grey). X-axis represents the position around the predicted start codon and Y-axis is the normalized ribosome-protected footprints at each position. (c) A scatter plot shows that biological replicates for translation initiation site sequencing are highly correlated and reproducible. (d) Translation initiation site counts (Y-axis) correlate with length-normalized elongating ribosome counts (X-axis). The plot is shown for a single representative replicate from interphase cells. (e) Scatter plot showing that translation initiation efficiency fold-change and translational efficiency fold-change between mitosis and interphase correlate with each other. main ORFs with only a single identified translation initiation site were included in this analysis. (f) Cell cycle analysis of interphase, cycling mitotic, and STLC-arrested mitotic cells indicating efficient synchronization. Cells were stained with Hoescht (X-axis) and anti-pH3-Ser10 (Y-axis) and analyzed by flow cytometry. (g) Western blot analysis of interphase, cycling, and STLC-arrested mitotic cells show similar, background levels of phospho-eIF2α. Sodium arsenite treatment (1 hour, 0.5mM) was as a marker for hyper-phosphorylated eIF2α. For gel source data, see Supplementary Data 1. (h) Quantification of Western blots from (G). (i) Principal component analysis of translation initiation site reads from interphase, cycling, and STLC-arrested mitotic cells. Each point is a single biological replicate. Shapes represent different batches. The cell synchronization and library prep for cycling mitotic cells were a distinct batch. This batch effect likely accounts for PC2. (j) A scatter plot shows that the fold change in translation initiation efficiency between cycling (Y-axis) and STLC-arrested (X-axis) relative to interphase cells is correlated. Since the interphase and STLC-arrested samples were prepared in the same batch, we compared interphase to STLC-arrested cells for the manuscript. (k) Boxplot of translation initiation efficiency fold change between mitotic arrest and interphase (Y-axis) and the class of ORF (X-axis). Statistics indicate a Mann-Whitney U-test. (l) Relative number of predicted N-terminal degrons (where the second amino acid is G, K, R, or C) in different ORF classes. (m) Pie chart showing the amino acid distribution for the second amino acid for main (left pie chart) and N-terminal extended ORFs (right pie chart). N-terminal extensions are enriched for N-terminal degrons (G, K, R, C; labelled in orange).
Extended data Figure 3.
Extended data Figure 3.. Repression of non-AUG translation is specific to mitosis and conserved across organisms and cell types.
(a) Performance of linear regression models to predict translation initiation efficiency fold change between interphase and mitosis. Predictions were concatenated from all folds of held-out data. (b) Translation initiation site start codon counts from main ORFs and novel ORFs (extensions, truncations, uORFs, and altORFs). Non-AUG initiation sites only include near-cognate initiation sites. (c) Luciferase reporter assay as described in Fig. 2e except using an UUG start codon. n = 3 biological replicates and unpaired Student’s t-tests was used. (d) Luciferase reporter assay as described in Fig. 2e except the GAPDH 5’ UTR was used. n = 3 biological replicates and unpaired Student’s t-tests was used. (e) Luciferase reporter assay as described in Fig. 2e except the UUG start codon and GAPDH 5’ UTR was used. n = 3 biological replicates and unpaired Student’s t-tests was used. (f) Left, schematic of cell synchronization strategy. G2 arrested (Ro-3306) cells were released into STLC or taxol media and transfected with Luciferase mRNA reporters. Right, bar graph plotting CUG/AUG translation in the indicated condition suggested that STLC or taxol arrested cells increase translation initiation stringency compared to G2 arrested HeLa (top right) and Rpe1 (bottom right) cells. n = 2 biological replicates and unpaired Student’s t-tests was used. (g) Top, schematic of a different cell synchronization strategy. Thymidine arrested S-phase HeLa cells were released with or without STLC to generate G1 or mitotically arrested cell populations. Bottom, bar graph plotting the CUG/AUG translation in the indicated condition suggested that that stringency of start codon selection is specific to mitosis. n = 2 biological replicates and unpaired Student’s t-tests was used. (h) Mitotic synchronization efficiency of mouse RAW264.7 cells. X-axis is DNA content based on Hoescht intensity and Y-axis is the abundance of the mitotic marker, pH3Ser10. (i) Luciferase mRNA reporter assays to monitor CUG/AUG translation in synchronized RAW264.7 cells. Error bar represents standard error of the mean, n = 2 biological replicates and Unpaired Student’s t-tests was used. (j) Luciferase mRNA reporter assays to monitor CUG/AUG translation in HeLa cells treated with Torin-1. Error bar represents standard error of the mean, n = 2 biological replicates and unpaired Student’s t-tests was used.
Extended data Figure 4.
Extended data Figure 4.. Additional evidence for increased stringency of start codon selection during mitosis.
(a) Cumulative distribution function (CDF) plot of translation initiation efficiency fold-change between mitosis and interphase for weak, medium, and strong Kozak contexts sites. Strong Kozak contexts are defined as having a −3 G/A and a +4 G, medium contexts contain only either a −3 G/A or +4 G, and weak contexts have neither. Statistics indicate a Mann-Whitney U-test. (b) Scatter plot showing the correlation between interphase translation initiation efficiency (X-axis) and the fold-change between mitotic arrest/interphase (Y-axis). Each point represents the average initiation efficiency or fold change in initiation efficiency between interphase and mitotic arrest. Error bars represent standard error of the mean. The grey shading represents the 95% confidence for the line of best fit. Statistics represent p-value for Pearson correlation. (C) Top, schematic of the MDM2 5’UTR variants used in luciferase reporter assays. Bottom, translational efficiency of each 5’UTR during interphase as measured by NanoLuc/Firefly Luciferase activity (x-axis) and translational repression arrest (Interphase/mitotic arrest translation, y-axis). Weakening the uORF Kozak context suppresses the repression of MDM2 translation during mitosis. n = 4 biological replicates, error bar represents standard error of the mean. We note that the change in endogenous MDM2 uORF translation during mitosis may not be due to stringency and additional protein factors may contribute to this change. (d) Luciferase reporters containing the POLGARF 5’UTR in the wildtype strong Kozak context or weak Kozak context. Weakening the Kozak context induces preferential translational repression during mitosis. Endogenously tagged GFP-eIF1 rather than unmodified HeLa cells were used for this experiment. n = 3 biological replicates, error bar represents standard error of the mean, and unpaired student’s T test was used. (e) Relative translational efficiency correlations between interphase and cycling mitotic HeLa cells. (f) Relative translational efficiency correlations between mitotically arrested and cycling mitotic HeLa cells. The slight increase in slope in mitotically arrested cells likely represents differences in synchronization efficiencies. (g) Relative translational efficiency correlations from , comparing Asynchronous and mitotically enriched HeLa cells. We note that the synchronization in did not involve mitotic shake off so likely contains contaminating interphase/G2 cells in the mitotic prep. (h) Relative translational efficiency correlations from , comparing S-phase and mitotically enriched HeLa cells. (i) Relative translational efficiency correlations from , comparing asynchronous and S-phase HeLa cells. (j) Relative translational efficiency correlations between control cells and cells cultured under hypoxic conditions for 2 hours (data from ). (k) Relative translational efficiency correlations from , comparing control and arsenite treated HEK293T cells. (l) Relative translational efficiency correlations from , comparing control and Torin-1 treated mouse NIH3T3 cells.
Extended data Figure 5.
Extended data Figure 5.. eIF1 preferentially associates with the ribosome during mitosis.
(a) Heatmap showing successful fractionation of ribosomes and quantitative nature of mass spectrometry from interphase cells. Top cluster represents 40S subunits while bottom represents 60S subunits. Plotted is the average Z-score of 2 biological replicates. (b) Biological replicates from interphase (left) and mitotic (right) 40S fraction TMT mass spectrometry experiments. (c) Rank-ordered relative fold-change in the abundance of translation initiation factors and ribosomal proteins in free, 60S, and 80S ribosome fractions. Each point represents the average fold change between 2 biological replicates and the shading is the standard error of the mean. Interestingly eIF5B and eIF5A are also regulators of start codon selection, with eIF5B acting directly and eIF5A indirectly ,,,. (d) Western blot analysis of eIF1 and eIF5 protein expression in interphase, cycling mitotic, and mitotically arrested HeLa cells.
Extended data Figure 6.
Extended data Figure 6.. Nuclear eIF1 is released into the cytoplasm during mitosis.
(a) Localization of GFP-eIF1 and GFP-eIF5 in Rpe1 cells. RPE1 cells were transiently transfected with the GFP-tagged constructs. Scale bar, 5 μm. (b) Localization of GFP-eIF1 and GFP-eIF5 in mouse RAW264.7 cells. Scale bar, 5 μm. (c) Luciferase reporter assays with co-expressed eIF1 tagged variants. AUG and CUG NanoLuc reporters as described in , were co-transfected with control AUG firefly luciferase and different eIF1 constructs. N-terminally tagged eIF1 is able to preferentially repress the CUG reporter but C-terminally tagged eIF1 is inactive. n = 3 biological replicates, error bar represents standard error of the mean, and unpaired Student’s t-tests was used. (d) Endogenously tagged GFP-eIF1 is functional and does not show growth defects. Competitive growth assay where the relative growth HeLa cells to indicated cell lines were monitored over time. To generate eIF1 knockout lines, cells were transiently infected with Cas9-eIF1 sgRNA. Following selection of the infected cells, the population was mixed with mCherry-HeLa cells. (e) mEGFP-eIF1 or 3xHA-EGFP was immunoprecipitated using anti-GFP and analyzed by quantitative mass spectrometry. Dashed lines indicate the significance threshold. n = 2 biological replicates. (f) Gene set enrichment analysis from GFP-eIF1 IP-MS experiment. (g) Endogenous eIF1 was immunoprecipitated using α-eIF1 antibody and analyzed by quantitative mass spectrometry. Immunoprecipitations were done from control, and two independent transient eIF1 knockout cell lines. The protein abundance from α-eIF1 IP is shown on the X-axis. We note that this abundance is not length normalized. On the Y-axis, we have plotted the abundance fold change between α-eIF1 immunoprecipitations from control and eIF1 knockout cells. Selected nuclear factors (see Supplementary data 7) are highlighted in green. (h) Validation of affinity purified α-eIF1 antibody by Western blotting. Lysates from transient control or eIF1 knockout cells (3-day post infection, using 2 separate sgRNAs targeting eIF1) were analyzed using our affinity purified α-eIF1 antibody. (i) Validation of affinity purified α-eIF1 antibody by immunofluorescence of eIF1 knockout cells. Representative image is shown on the left and quantification from biological replicates shown on the right. Unpaired Student’s t-tests was used. Scale bar, 10 μm. (j) Validation of affinity purified α-eIF1 antibody by immunofluorescence of GFP-eIF1 overexpression cells. Ectopic expression of GFP-eIF1 or NLS-GFP-eIF1 results in increased staining by α-eIF1 antibody. Scale bar, 20 μm. (k) Immunofluorescence showing endogenous eIF1 localization in interphase RPE1, A549, and U2OS cells. Scale bar, 5 μm. (l) Endogenous eIF1 localization in interphase and mitotic mouse NIH3T3. Dotted line represents cell boundary. Scale bar, 5 μm. (m) Live-cell timelapse microscopy of NLS-GFP-eIF1 showing the release of the nuclear fraction of eIF1 into the cytoplasm during mitosis. Numbers indicate time in minutes. Dotted lines represent cell boundaries. Scale bar, 5 μm. (n) Live-cell imaging of endogenously tagged GFP-eIF1 cells in which the cytoplasmic fraction of eIF1 was eliminated using a cytoplasm specific GFP-degron. The nuclear fraction of eIF1 (left) is released into the cytoplasm during mitosis (right). Dotted lines represent cell boundaries. Scale bar, 5 μm.
Extended data Figure 7.
Extended data Figure 7.. Evidence that NES-GFP-eIF1 is functional and autoregulation of eIF1.
(a) Quantification of transgenic GFP-eIF1 protein levels from Fig. 4h. Transgenic eIF1 under a strong Kozak context escapes the autoregulation, consistent with translation initiation dependent control. (b) Western blot analysis of eIF5 protein levels during interphase and mitotic arrest in cells ectopically expressing GFP, GFP-eIF1, or NLS-GFP-eIF1. The average eIF5/RPS3 ratio and standard error of 3 biological replicates is shown below the blot. eIF1 also directly regulates eIF5 in another autoregulatory loop whereby excess eIF1 would increase eIF5 translation . Ectopic expression of GFP-eIF1 modestly increased endogenous eIF5 levels during both interphase and mitosis. However, over the course of 8 hours of mitotic arrest, eIF5 levels did not change in NLS-GFP-eIF1 cells. Since the changes in eIF5 protein levels upon GFP-eIF1 overexpression is modest (2.7-fold change) even over the course of a 48 hour overexpression during interphase, we propose that detecting mitotic specific changes induced by NLS-GFP-eIF1 overexpression during the 8 hour mitotic arrest might limit our ability to detect this change. (c) Top, schematic outline to generate endogenous GFP-eIF1 or NES-GFP-eIF1 cell lines. Bottom, genotyping PCR of HeLa, polyclonal and monoclonal GFP-eIF1 or NES-GFP-eIF1 cells. (d) Luciferase reporter assays with co-expressed eIF1 tagged variants. AUG and CUG NanoLuc reporters as described in , were co-transfected with control AUG firefly luciferase and different eIF1 constructs. NES-tagged eIF1 represses the CUG reporter to a similar extent as untagged or GFP-tagged eIF1 during interphase. n = 3 biological replicates, error bars represent standard error of the mean, and unpaired Student’s t-tests was used. (e) eIF1B-mCherry localization in homozygous clonal GFP-eIF1 or NES-GFP-eIF1 cells. eIF1B localizes to the cytoplasm, nucleus, and nucleolus but this localization does not change when depleting nuclear eIF1. (f) Flow cytometry analysis of eIF1B-Cherry levels in control HeLa, endogenously tagged GFP or NES-GFP-eIF1 suggests that eIF1B protein levels don’t change in the absence of nuclear eIF1. (g) Right and middle, schematic representation of the role of autoregulation in affecting relative nuclear and cytoplasmic eIF1 levels upon induced nuclear export. Left, hypothetical ratios of eIF1 in the nucleus and cytoplasm with and without autoregulation during interphase and mitosis. Autoregulation during interphase maintains a similar level of cytoplasmic eIF1 upon induced nuclear export. Therefore, this nuclear export selectively depletes nuclear eIF1, while keeping cytoplasmic eIF1 similar. During mitosis, nuclear release of eIF1 doesn’t occur when eIF1 is endogenously tagged with a NES. Therefore, NES-GFP-eIF1 cells have reduced eIF1 activity specifically during mitosis. (h) Western blot showing decreased levels of polyclonal NES-GFP-eIF1 protein relative to GFP-eIF1 cells. The average eIF1/GAPDH ratio and standard error of 2 biological replicates is shown below the blot. (i) Flow cytometry analysis of the polyclonal population of endogenous GFP-eIF1 and NES-GFP eIF1.
Extended data Figure 8.
Extended data Figure 8.. Nuclear release of eIF1 enhances stringency of start codon selection during mitosis.
(a) Graph showing quantification of CUG/AUG CD9 5’UTR luciferase reporters in the indicated conditions using polyclonal GFP sorted cell lines. Error bar represents standard error of the mean, n = 3 biological replicates and Unpaired Student’s t-tests was used for plots on the left. Paired T-test was used for plots on the right. (b) Same as Extended data Fig. 8a except using an additional clonal cell line (c) Schematic of translating ribosome affinity purification (TRAP) to measure translational efficiency. TRAP was performed in interphase and mitotic arrest of GFP-eIF1 and NES-GFP-eIF1 cells. (d) Scatterplot comparing the translational efficiency of mRNAs during mitotic arrest and interphase using TRAP in GFP-eIF1 cells. The increased slope is consistent with a global increase in stringency of start codon selection. Each point represents the average translational efficiency of a single mRNA. n = 2 biological replicates. (e) Boxplots showing the change in translational efficiency of mRNAs that are increased mitotic/interphase GFP-eIF1 cells. The translational efficiency changes are partially suppressed in cells lacking nuclear eIF1 (NES-GFP-eIF1). Statistics indicate a Mann-Whitney U-test. (f) Same as (e) except with mRNAs that are translationally repressed in mitotic/interphase GFP-eIF1 cells. (g) Boxplot showing the translational efficiency of long non-coding RNAs in the indicated conditions. Long non-coding RNAs are derepressed in mitotic cells lacking nuclear eIF1. The number in the box plot represents the median translational efficiency of the sample. Statistics indicate a Mann-Whitney U-test. (h) CDF plot showing the change in translational efficiency for long non-coding RNAs during mitosis in cells with (GFP-eIF1) and without (NES-GFP-eIF1 nuclear eIF1. The change in long non-coding RNA translation is suppressed in cells lacking nuclear eIF1. Statistics indicate a Mann-Whitney U-test.
Extended data Figure 9.
Extended data Figure 9.. Depleting nuclear eIF1 sensitizes cells to anti-mitotic chemotherapeutics.
(a) Western blot of PARP1 cleavage of mitotically arrested GFP-eIF1 and NES-GFP-eIF1 cells. Increased PARP1 cleavage in NES-GFP-eIF1 cells is indicative of apoptosis. (b) Death in the presence of various drugs measured by propidium iodide staining. Note that the high concentration of MG132 used in this experiment interphase cells do not enter mitosis therefore does not enrich for mitotic cells. Error bar represents standard error of the mean, n = 2 biological replicates and Unpaired Student’s t-tests was used. (c) Rescue of translation initiation stringency and mitotic death in endogenous NES-GFP-eIF1 cells through ectopic expression of NLS-GFP-eIF1 for both monoclonal and polyclonal cell line. For luciferase reporter assays the CD9 5’UTR was used with an AUG or CUG start codon and activity was monitored in both interphase and mitotically arrested cells. For the mitotic death assays, cells were live imaged in the presence of taxol for 50 hours. n = 3 biological replicates and Paired Student’s t-tests was used for plots. (d) Viability of indicated cell lines during mitotic arrest induced by taxol. Ectopic expression of NLS-eIF5, which specifically decreases stringency of start codon selection during mitosis, increases cell death during mitosis. Cells were live imaged in the presence of taxol for 50 hours. n = 3 biological replicates and Paired Student’s t-tests was used for plots. (e) STLC washout assays as described in Fig. 5c, except using polyclonal lines or an additional clonal cell line.
Extended data Figure 10.
Extended data Figure 10.. Nuclear eIF1 regulates nuclear-encoded mitochondrial mRNAs and CDC20.
(a) Gene set enrichment analysis using change in translational efficiency between mitotically arrested and interphase cells. Mitochondrial mRNAs are preferentially translated during mitosis. (b) Scatterplot comparing translational efficiency of mRNAs during interphase and mitosis. Mitochondrial mRNAs, encoded from both the mitochondria (brown) and nucleus (green), are preferentially translated during mitosis. Removal of nuclear eIF1 is predicted to suppress changes to mitotic translation. (c-e) Quantification of 5’UTR luciferase reporters showing the change in translation between interphase and mitosis for the indicated reporter in cells with or without nuclear eIF1. n = 4 biological replicates and paired T-test was used. We note that the mechanism by which eIF1 affects the translation of mitochondrial mRNAs remains unclear. (f) Positive control experiment to show that TMRE is staining active mitochondria. Addition of cyanide poisons the electron transport chain, resulting in mitochondrial depolarization. TMRE signal is quantified using Cell Profiler. (g) Median TMRE signal in 3 biological replicates. Error bar represents standard error of the mean and unpaired Student’s t-tests was used. (h) Mitotic death/slippage assays as described in Fig. 5f, except using an additional monoclonal line or polyclonal lines. n = 3 biological replicates and unpaired T-test was used. (i) Schematic outline of the regulation and function alternative CDC20 isoforms . Leaky ribosome scanning allows for translation of CDC20 from Met43. The short CDC20 isoform bypasses control of the mitotic check point complex to promote mitotic slippage. (j) Luciferase mRNA reporter assays to assess the relative translation of CDC20 M1 and M43 translation initiation sites in interphase and mitotically arrested cells. CDC20 M43 reporter is preferentially translated relative to CDC20 M1 reporter in mitosis, consistent with nuclear eIF1 release promoting leaky scanning in mitosis. Error bar represents standard error of the mean, n = 3 biological replicates, and unpaired Student’s t-tests used for this data. (k) Ectopic expression of CDC20 M43 isoform rescues slippage/death phenotype observed in cells lacking nuclear eIF1. Mitotic death/slippage assays as described in Fig. 5f. CDC20 M43 transgene was induced with doxycycline 24 hours prior to taxol addition and live imaging. Error bars represent standard error of the mean, n = 3 biological replicates, and Unpaired Student’s t-tests was used.
Figure 1.
Figure 1.. A pervasive change in start codon selection during mitosis.
(a) Schematic of mitotic cell viability assay. (b) Representative distribution of mitotically-arrested HeLa cell viability after 4-hour treatment. (c) Quantification of cell viability 2- and 4-hour post drug addition. n = 3 biological replicates. (d) Schematic of translation initiation site sequencing. (e) Distribution of ORF types identified using RiboTISH in HeLa cells. (f) Read distribution from translation initiation site sequencing surrounding the start codon for the indicated established alternative translation isoforms. Purple: mitotically repressed initiation site. Orange: mitotically activated initiation site. Dark grey: non-significant initiation sites. Significance cutoff described in (g). (g) Volcano plot of translation site differences between interphase and mitotically-arrested HeLa cells. Orange: significantly upregulated sites in mitosis. Purple: significantly downregulated sites. Translation initiation sites with FDR < 0.01 and a fold change > 2 were called as significant. (h) Read distribution from translation initiation site sequencing surrounding the MDM2 uORF1. (i) Top, schematic of luciferase mRNA reporters to test MDM2 translation in the presence (left) or absence (right) of the MDM2 uORFs. Bottom, NanoLuc/Firefly luciferase activity from interphase or mitotically-arrested cells. n = 3 biological replicates. The error bar represents standard error of the mean, and statistics reflect an unpaired Student’s t-tests.
Figure 2.
Figure 2.. Stringency of start codon selection increases during mitosis.
(a) Graph showing coefficients from linear regression model to predict initiation efficiency fold change between mitotic arrest and interphase. The top 20 features are shown, with features related to the start codon highlighted in red. (b) Volcano plot of translation site differences between mitotically arrested and interphase HeLa cells. Orange: significantly different AUG initiation sites. Purple: significantly different non-AUG initiation sites. Translation initiation sites with FDR <0.01 and >2-fold change are significant. (c) Boxplot of translation initiation efficiency fold changes between mitotic arrest and interphase (Y-axis) and the start codon (X-axis). Statistics indicate a Mann-Whitney U-test. (d) Schematic of mRNA luciferase reporter used to compare AUG, CUG, and UUG translation. (e) Bar plot showing AUG and CUG translation reporters during a mitotic arrest normalized to interphase HeLa cells. Error bar represents standard error of the mean, n = 3 biological replicates. Statistics reflect unpaired Student’s t-tests. (f) Bar plot showing differences in the CUG/AUG translation in the indicated conditions. Error bar represents standard error of the mean, n = 2 biological replicates and unpaired Student’s t-tests used for this data. (g) Top, sequence logo created using weighted translation initiation efficiency fold changes between mitotic arrest and interphase. Bottom, unweighted sequence logo of nucleotides flanking the start codon for main ORFs as described in . (h) Schematic showing global increase in translation initiation stringency in the condition listed on the Y-axis relative to X-axis. (i) Relative translational efficiency correlations between interphase and mitotically-arrested HeLa cells. A slope >1 suggests an increased translation initiation stringency.
Figure 3.
Figure 3.. Nuclear release of eIF1 increases ribosome association during mitosis.
(a) Volcano plot showing whole cell quantitative proteomics from interphase and mitotically arrested HeLa cells. Dashed lines indicate the significance threshold. n = 3 biological replicates. (b) Schematic of ribosome fractionation and quantitative mass spectrometry analysis of HeLa cells to identify differential ribosome associations. (c) Plot showing rank-ordered relative fold change from proteomic analysis of the 40S ribosome fraction from interphase and mitotic cells. Each point represents the average of 2 biological replicates and the shading indicates standard error of mean. (d) Left, western blot analysis of 40S ribosome fractions isolated from interphase and mitotically-arrested HeLa cells. Right, quantification of western blots showing the change in eIF1/RPS3 or eIF5/RPS3 ratio between interphase and mitotic arrest. The error bars represent standard error of the mean, n = 2 biological replicates. (e) Live-cell imaging of GFP-eIF5 (left) and GFP-eIF1 (right) in HeLa cells. Scale bar, 5 μm. (f) Immunofluorescence of endogenous eIF1 in HeLa cells. α-eIF1 image intensity is scaled identically between images, but not for morphological markers (tubulin and DNA). Scale bar, 5 μm. (g) Immunofluorescence showing endogenous eIF1 localization in mouse cumulus cells. The yellow arrow indicates a mitotic cumulus cell. Scale bar, 5 μm. (h) Immunofluorescence showing endogenous eIF1 localization in mouse GV, meiosis I, and meiosis II eggs. Scale bar, 20 μm. Dotted lines represent cell boundaries.
Figure 4.
Figure 4.. Control of translation initiation stringency by nuclear/cytoplasmic translation factor ratios.
(a) Live cell imaging showing NLS-eIF5 localization in HeLa cells. Dotted lines represent cell boundaries. Scale bar, 5 μm. (b) Graph showing quantification of luciferase reporters in the indicated conditions. Mitotic CUG/AUG translation was normalized to interphase within each cell line. n = 3 biological replicates. Unpaired Student’s t-tests were used for plots on the left. Paired T-test was used for the plot on the right. (c-f) Change in translation of the indicated reporter during mitosis in cells expressing GFP or NLS-eIF5. n = 3 biological replicates and paired T-test was used. (g) Proposed model for eIF1 autoregulatory loop as described in . (h) Western blot showing eIF1 levels in cells expressing different versions of eIF1. (i) Quantification of endogenous eIF1 protein levels from Fig. 4h. (j) Graph showing translational changes in luciferase reporter harboring eIF1 5’UTR in different transgenic cells as indicated. n = 3 biological replicates. Statistics reflect an unpaired Student’s t-tests between indicated samples and the control GFP cells, * p < 0.05, *** p < 0.0005. (k) Live cell imaging showing localization of endogenous GFP-eIF1 and NES-GFP-eIF1. Scale bar, 5 μm. (l) Graph showing quantification of CUG/AUG luciferase reporters in endogenous GFP-eIF1 or NES-GFP-eIF1 cells. Mitotic CUG/AUG translation was normalized to interphase within each cell line. Error bar represents standard error of the mean, n = 3 biological replicates and Unpaired Student’s t-tests was used for plots on the left. Paired T-test was used for plots on the right. (m-p) Change in translation of the indicated reporter during mitosis in cells with and without nuclear eIF1. n = 3 biological replicates and paired T-test was used.
Figure 5.
Figure 5.. Depleting nuclear eIF1 sensitizes cells to anti-mitotic chemotherapeutics.
(a) Competitive growth assay to test relative growth of indicated cells. (b) Top, schematic of mitotic death assay. Left, flow cytometry plot of propidium iodide signal from mitotically-arrested cells. Right, quantification of mitotic death assays. Error bar represents standard error of the mean, n = 3 biological replicates, and Unpaired Student’s t-tests was used for plots on the right. (c) Left, schematic of viability assay after an 8-hour STLC treatment. Right, graph showing quantification of cell death after STLC washout using live cell imaging. Error bar represents standard error of the mean, n = 3 biological replicates and unpaired Student’s t-tests was used. >100 cells were quantified per replicate. (d) Quantification of a luciferase reporter harboring the MRPS34 5’UTR. n = 4 biological replicates and paired T-test was used. (e) Representative image of TMRE staining from interphase and mitotically-arrested cells. Scale bar, 50 μm. (f) Top, schematic of strategy to test the outcome of mitotically-arrested cells. Bottom, quantification of the proportion of mitotic slippage during taxol-induced mitotic arrest. Error bar represents standard error of the mean, n = 3 biological replicates, and Unpaired Student’s t-tests was used. >100 cells were quantified per replicate. (g) Top, western blot analysis of CDC20 protein isoform expression in mitotically-arrested GFP-eIF1 and NES-GFP-eIF1 cells. Bottom, quantification of CDC20 M43 isoform normalized to GAPDH in early (0 hr) and prolonged (8 hr) mitotic cells. n = 3 biological replicates and Unpaired Student’s t-tests was used. (h) Schematic for the programmed release of nuclear eIF1 during mitosis, enhancing the stringency of start codon selection to enable a physiological mitotic arrest.

Update of

References

    1. Wright BW, Yi Z, Weissman JS & Chen J The dark proteome: translation from noncanonical open reading frames. Trends Cell Biol 32, 243–258 (2022). 10.1016/j.tcb.2021.10.010 - DOI - PMC - PubMed
    1. Mouilleron H, Delcourt V & Roucou X Death of a dogma: eukaryotic mRNAs can code for more than one protein. Nucleic Acids Res 44, 14–23 (2016). 10.1093/nar/gkv1218 - DOI - PMC - PubMed
    1. Andreev DE et al. Non-AUG translation initiation in mammals. Genome Biol 23, 111 (2022). 10.1186/s13059-022-02674-2 - DOI - PMC - PubMed
    1. Ingolia NT, Lareau LF & Weissman JS Ribosome profiling of mouse embryonic stem cells reveals the complexity and dynamics of mammalian proteomes. Cell 147, 789–802 (2011). 10.1016/j.cell.2011.10.002 - DOI - PMC - PubMed
    1. Parsons GG & Spencer CA Mitotic repression of RNA polymerase II transcription is accompanied by release of transcription elongation complexes. Mol Cell Biol 17, 5791–5802 (1997). 10.1128/MCB.17.10.5791 - DOI - PMC - PubMed