. 2024 Nov;635(8040):969-977.
doi: 10.1038/s41586-024-08095-4. Epub 2024 Oct 23.

Rifaximin prophylaxis causes resistance to the last-resort antibiotic daptomycin

Affiliations

Rifaximin prophylaxis causes resistance to the last-resort antibiotic daptomycin

Adrianna M Turner et al. Nature. 2024 Nov.

Abstract

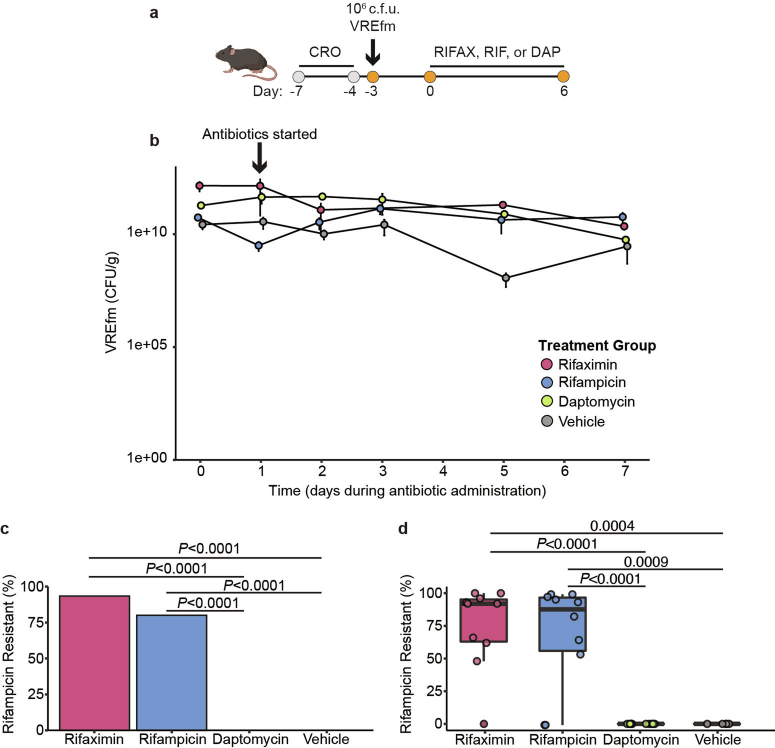
Multidrug-resistant bacterial pathogens like vancomycin-resistant Enterococcus faecium (VREfm) are a critical threat to human health1. Daptomycin is a last-resort antibiotic for VREfm infections with a novel mode of action2, but for which resistance has been widely reported but is unexplained. Here we show that rifaximin, an unrelated antibiotic used prophylactically to prevent hepatic encephalopathy in patients with liver disease3, causes cross-resistance to daptomycin in VREfm. Amino acid changes arising within the bacterial RNA polymerase in response to rifaximin exposure cause upregulation of a previously uncharacterized operon (prdRAB) that leads to cell membrane remodelling and cross-resistance to daptomycin through reduced binding of the antibiotic. VREfm with these mutations are spread globally, making this a major mechanism of resistance. Rifaximin has been considered 'low risk' for the development of antibiotic resistance. Our study shows that this assumption is flawed and that widespread rifaximin use, particularly in patients with liver cirrhosis, may be compromising the clinical use of daptomycin, a major last-resort intervention for multidrug-resistant pathogens. These findings demonstrate how unanticipated antibiotic cross-resistance can undermine global strategies designed to preserve the clinical use of critical antibiotics.


Conflict of interest statement

Competing interests: The authors declare no competing interests.

Figures

Fig. 1
Fig. 1. Identification of DAP-R RpoB substitutions.
a, Manhattan plot of 10,530 variants, displayed by their position on the reference genome and their association with DAP resistance, as determined using one-sided Fisher’s exact tests and a mixed-effects logistic regression model to correct for population structure; correction for multiple testing was performed using the Bonferroni method (dashed line). n = 998 study isolates and 2 control strains. b, The percentage of DAP-R strains with a RpoB substitution; the RRDR is shown in bold. The total number of VREfm containing each mutation is shown. c, Maximum-likelihood core-SNP-based phylogeny of clinical VREfm (n = 998 study isolates and 2 control strains) inferred from 6,574 SNPs. Overlaid are the results of in silico multi-locus sequence type (MLST), DAP phenotypic testing and RpoB substitutions associated with DAP resistance. In the first circle, ST is not shown for uncommon STs (n ≤ 5). The scale bar indicates number of nucleotide substitutions per site (top), with an approximation of SNP distance shown in parentheses. d, Rifampicin susceptibility testing results for the WT and isogenic rpoB mutants and complemented strains (designated by -C). n = 3. e, DAP susceptibility testing results for the WT and isogenic rpoB mutants and complemented strains. n = 3. The MIC for each strain is shown without error bars as there was no variation between the independent biological replicates. Source Data
Fig. 2
Fig. 2. Rifaximin approval is linked with the emergence of S491F.
a, Maximum-likelihood, core-SNP-based phylogeny for 4,476 VREfm inferred from 9,277 core-genome SNPs, demonstrating the presence of the S491F RpoB substitution in international VREfm. Overlaid is the region of isolation for each strain and the presence of the S491F substitution. The coloured branches indicate the three VREfm clusters identified with core genome MLST (cgMLST) used as the input for Bayesian evolutionary analyses. The scale bar indicates the number of nucleotide substitutions per site (top); an approximation of SNP distance is shown in parentheses. b, Bayesian phylodynamic analyses showing the MCC trees of the three VREfm clusters with the timing (years on x axis) of emergence for each lineage. The presence of the S491F RpoB trait for each isolate is shown in purple. Overlaid onto the MCC trees is the first instance of FDA approval for rifaximin (2004) and for hepatic encephalopathy (HE) (2010). c, Violin plots of the most recent common ancestor (MCRA) for each cluster, representing when the RpoB S491F substitution first emerged, with 95% highest-posterior density (HPD) intervals—2006 (HPD 1993–2012) for cluster 1, 2000 (HPD 1989–2008) for cluster 2, and 2004 (HPD 2001–2010) for cluster 3. Overlaid onto violin plots is the FDA approval date for rifaximin (2004).
Fig. 3
Fig. 3. Rifaximin use is linked to DAP-R VREfm carriage.
Summary of the percentage of VREfm with any rpoB SNP, DAP-associated rpoB SNP (S491F, G482D and H486Y) or DAP-R in patients in the control (n = 116) or rifaximin (n = 96) groups. Data were analysed using one-sided Fisher’s exact tests. Exact P values were as follows: P < 2.2 × 10−16 (any rpoB SNP); P = 3.044 × 10−14 (DAP-associated rpoB SNP) and P = 1.463 × 10−10 (DAP-R). Source Data
Fig. 4
Fig. 4. Rifaximin drives the emergence of DAP-R VREfm.
a, The percentage of total mice (n = 5 mice for vehicle, n = 10 mice for rifampicin, n = 10 mice for rifaximin, n = 10 mice for DAP) with DAP-R VREfm strains. b, The percentage of VREfm from each mouse (n = 50 colonies from each individual mouse) that were resistant to DAP after 7 days of antibiotic treatment. The points represent the percentage of DAP-R VREfm from each individual mouse. The percentage was calculated from DAP MIC values (either resistant or susceptible) from the 50 VREfm colonies isolated from each mouse. For all box plots, the centre line shows the median, the box limits show the 25th and 75th percentiles, the upper and lower whiskers extend from the hinge to the largest and smallest values at most 1.5× interquartile range from the hinge. c, Overview of the RpoB substitutions identified in the rifampicin-resistant colonies. Each point represents a single VREfm isolate. Isolates are separated by each RpoB substitution and grouped into either DAP-S or DAP-R. The RpoB substitutions coloured in red had an association with DAP resistance. n values represent the number of isolates containing each mutation for rifaximin (left) and rifampicin (right). Data in a and b were analysed using two-sided unpaired t-tests (vehicle versus rifampicin or vehicle versus rifaximin and rifampicin verses DAP or rifaximin verses DAP). Exact P values are provided when the P value is above P < 0.0001. Source Data
Fig. 5
Fig. 5. rpoB substitutions upregulate the prdR locus.
a, PCA denoting segregation of the total lipid classes obtained for the WT and RpoB mutants. b, The 25 significantly differentially expressed loci identified in both RNA-seq and proteomics. The fold change value for RNA-seq is shown in the colour scale (log2-transformed fold change). S+T, the double RpoB(S491F)/RpoC(T634K) mutant. c, Daptomycin susceptibility testing results for the WT and rpoB backgrounds (S491F, G482D or H486Y) with prdR, prdA or prdB deleted (n = 3). The MIC for each strain is shown without error bars as no variation between independent biological replicates was observed. d, PCA denoting the segregation of the total lipid classes obtained for the WT, S491F mutant, WTEV and WTprdR. e, The zeta potential (measured in mV). The points represent each biological replicate (n = 3), and the lines represent the median and interquartile range. Data were analysed using one-way analysis of variance (ANOVA) with correction for multiple testing using the Dunnett method, comparing WT versus RpoB mutant and WTEV versus WTprdR. f, Binding of BoDIPY–DAP, represented as relative fluorescence units (RFU). The points represent each biological replicate (n = 5) and the lines represent the median and interquartile range. Data were analysed using one-way ANOVA with correction for multiple testing using the Dunnett method, comparing WT versus RpoB mutant and WTEV versus WTprdR. Exact P values are provided when the P value is above P < 0.0001. Source Data
Extended Data Fig. 1
Extended Data Fig. 1. Specific RpoB substitutions are associated with DAP resistance in VREfm.
a. Maximum-likelihood core-SNP-based phylogeny of clinical VREfm (n = 1000) inferred from 6574 SNPs, demonstrating the interspersing of daptomycin resistance. Overlaid are the results of in silico MLST and daptomycin phenotypic testing. In the first heat map, ST is not shown for uncommon STs (n ≤ 5). The scale bar indicates number of nucleotide substitutions per site (top), with an approximation of SNP distance (in parentheses). ST=sequence type. SNP=single nucleotide polymorphism; MLST=multi-locus sequence type. b. Competition assays for the WT and RpoB S491F (dark purple) or WT and RpoB S491F/RpoC T634K (light purple) mutant pairs, with the percentage of rifampicin resistant (RIFR) to rifampicin susceptible (RIFS) isolates determined by plate count, shown on the y-axis. The x-axis denotes time in hours (either 0 or 24). Differences were assessed using two-way analysis of variance (ANOVA). All data points for independent biological replicates (n = 6) are displayed. Horizontal lines depict mean and error bars show the standard deviation. Exact P values are provided when the P value is above P < 0.0001. c. Maximum-likelihood core-SNP-based phylogeny of ST203, RpoB S491F VREfm (n = 80) inferred from 1960 SNPs, demonstrating the spread of isolates across different hospital networks. Overlaid are the year of isolation and hospital network for each isolate, represented as hospital 1 through 10 (H1-H10). The scale bar indicates number of nucleotide substitutions per site. d. Rifampicin susceptibility data for the clinical strains containing a mutation in the RpoB RRDR region (n = 169 isolates) versus a random selection of clinical strains containing a wild-type RRDR (n = 169 isolates). Bars represent the count of isolates containing each MIC. Three independent replicates were performed for each isolate. RRDR=rifampicin resistance determining region; MIC=minimum inhibitory concentration. Source Data
Extended Data Fig. 2
Extended Data Fig. 2. DAP resistance RpoB substitutions are present globally.
a. Map of 4,476 VREfm genomes included. Circle size corresponds to total number of genomes and colour corresponds to region of isolation. Country coordinates are the country centroid position. This map is derived from the public domain project Natural Earth and available from www.naturalearthdata.com (“world”). b. The frequency of RpoB substitutions within the rifampicin resistance determining region (RRDR) in 4,476 VREfm genomes, sampled from 43 MLSTs. Bars are coloured by the number of isolates from each region of isolation containing the mutation. The identified daptomycin resistance associated mutations are coloured in red. c. The frequency of various MLSTs identified in the 630 VREfm carrying RpoB mutations in the rifampicin resistance determining region (RRDR). The identified daptomycin resistance mutations are coloured in red. d. Maximum-likelihood core-SNP-based phylogeny of clinical (n = 4,378) and animal VREfm (n = 98) inferred from an alignment of 8,435 SNPs, demonstrating the presence of RRDR RpoB mutations in clinical VREfm isolates. Overlaid is a heatmap showing the presence of at least one substitution in the RRDR of RpoB. VREfm that were animal-associated are highlighted in pink. Source Data
Extended Data Fig. 3
Extended Data Fig. 3. The RpoB S491F substitution is maintained in the VREfm population.
a. Linear regression of root-to-tip distance as a function of sampling time. The slope is a crude estimate of the substitution rate (substitution/site) for the recombination-free SNP alignment, with the x-intercept indicative of the age of the root node and the r2 is a measure of clocklike behaviour. The x-axis is time (in years) and the y-axis displays the root-tip-divergence. The points represent an individual isolate in each cluster. b-d. Markov jump counts for the number of transitions between the binary trait of wild-type (WT) rpoB allele and RpoB S491F substitution. The number of Markov jumps for each cluster is shown on the x-axis, with the height of each bar representing the posterior probability for each individual jump.
Extended Data Fig. 4
Extended Data Fig. 4. Rifaximin prophylaxis is associated with DAP resistance in VREfm colonized patients.
a. Maximum-likelihood, core-SNP-based phylogeny for VREfm inferred from 14,420 core-genome SNPs, demonstrating which isolates were from the “control” (n = 116) or “rifaximin” (n = 96) groups from the Melbourne cohort. The scale bar indicates number of nucleotide substitutions per site. b. Summary of the percentage of HSCT patients (Germany cohort; n = 22 control patients and n = 35 rifaximin patients) with a VREfm isolate with any rpoB SNP or daptomycin (DAP) associated rpoB SNP (G482D, H486Y, or S491F). Data was analysed using a Fisher’s exact test (one-sided). The y-axis represents the number (shown as percent) of patients in the control or rifaximin group containing a rpoB mutation. Source Data
Extended Data Fig. 5
Extended Data Fig. 5. Rifaximin drives daptomycin resistance in VREfm colonized mice.
a. Timeline of the mouse experiment. VREfm-colonized mice (n = 5 independent mice for vehicle, n = 10 independent mice for rifampicin, n = 10 independent mice for rifaximin, n = 10 independent mice for daptomycin) received a human-equivalent dose of vehicle, rifampicin, or rifaximin (twice per day for rifaximin) for 7 days by oral gavage or subcutaneous injection with daptomycin for 7 days. CRO=ceftriaxone; DAP=daptomycin; RIFAX=rifaximin; RIF=rifampicin. Figure to scale. b. The colony forming units (CFU) for the duration of the mouse experiment. Each point represents the average VREfm CFU/g of faeces and error bars represent standard error of the mean. n = 5 independent mice for vehicle and n = 10 independent mice for DAP, RIF, and RIFAX. The x-axis is day of collection and y-axis is the CFU/g faeces of VREfm. c. Percentage of mice with rifampicin-resistant VREfm strains for each treatment group. d. Percentage of VREfm from each mouse (n = 50 colonies from each individual mouse) that were resistant to rifampicin after 7 days of antibiotic treatment. Points represent the percentage of rifampicin-resistant VREfm from each individual mouse. Percentage was calculated from rifampicin MIC values (either resistant or susceptible) from the 50 VREfm colonies isolated from each mouse. For all box plots, the lower and upper hinges depict the 25th and 75th percentiles. The upper and lower whiskers extend from the hinge to the largest and smallest values at most 1.5 × IQR from the hinge. The centre line in the box shows the median. Data in c and d were analysed using an unpaired t-test (two-sided) (vehicle versus rifampicin or vehicle versus rifaximin and rifampicin versus daptomycin or rifaximin versus daptomycin). Exact P values are provided when the P value is above P < 0.0001. The y-axes represent the percentage of rifampicin-resistant VREfm isolates. Source Data
Extended Data Fig. 6
Extended Data Fig. 6. Cell membrane lipid profile and molecular modelling of RpoB mutants.
a-d. The main lipid species differentially produced by the WT and RpoB mutants shown as normalized abundance (intensity/total protein). Bars represent the median value and error bars represent the SEM. Each point represents an independent biological sample (n = 5). Data was analysed with a Two-way ANOVA (WT versus RpoB mutant) and P values were corrected for multiple testing using the Dunnett method. Exact P values are provided when the P value is above P < 0.0001; ns=not significant. The y-axis is the normalized intensity (Normalized Int.) for each lipid identified. e. Structural localization of missense rpoB mutations. All studied mutations were located within interaction proximity of the ligand rifampicin binding site (grey), and the nucleic acids of the replication fork (dark red).
Extended Data Fig. 7
Extended Data Fig. 7. PrdR is over-expressed in VREfm with RpoB substitutions.
a. Intersection between RNAseq and proteomics analyses displayed as an UpSet plot (n = 5 independent biological replicates for RNAseq and n = 5 independent biological replicates for proteomics). The bar represents the count of each locus that was identified in each sample. RNA seq significance (FDR < 0.05, log2FC > 1 or log2FC < −1) and proteomics significance (adjusted p-value < 0.05, log2FC > 1 or log2FC < −1). b. Locus map of the prdR locus in the VREfm AUS0233 genome ([proteins] AGS74325, AGS74326, AGS74327 or EFAU233_00444, EFAU233_00445, EFAU233_00446). c. Proteomics comparing the abundance of the PrdRAB locus across five different clinical strain pairs (n = 5 independent biological replicates for each strain). Bars are the fold-change (log2) from five independent biological replicates showing proteins with statistically significant (<0.05) P-values. The y-axis is the log2 fold-change. Data was analysed using an unpaired t-test of daptomycin-susceptible clinical strain versus daptomycin-resistant clinical strain (with a RpoB mutation). d. Protein abundance changes of the clinical VREfm strain pairs (n = 5 independent biological replicates each isolate) containing mutations in RpoB from different genetic backgrounds, demonstrating the conserved upregulation of the PrdRAB operon. The x-axis is the log2 fold-change and the y-axis is the -log10 P value.
Extended Data Fig. 8
Extended Data Fig. 8. PrdR over-expression changes the cell membrane lipid profile.
a. Protein abundance changes for the prdR deletant mutant, compared to the WT strain, demonstrating the specificity of the regulator for the prdAB membrane proteins (n = 5 independent biological replicates for proteomics). The x-axis is the log2 fold-change and the y-axis is the -log10 P value. b-d. The lipid species differentially produced by the WT, S491F mutant, WT EV, and WTprdR shown as normalized abundance (intensity/total protein). Bars represent the median value and error bars represent the SEM. Each point represents independent biological replicates (n = 5). Data was analysed with a Two-way ANOVA ((WT versus RpoB mutant and WT EV versus WTprdR) and P values were corrected for multiple testing using the Dunnett method. Exact P values are provided when the P value is above P < 0.0001; ns=not significant. The y-axis is the normalized intensity (Normalized Int.) for each lipid identified. e-f. Lipid species differentially produced by the ST203 and ST80 RpoB S491F clinical strain pairs, shown as normalized abundance (intensity/total protein). Bars represent the median value and error bars represent the SEM. Each point represents independent biological replicates (n = 5). Data was analysed with a Two-way ANOVA (DAP-S versus DAP-R) and P values were corrected for multiple testing using the Dunnett method. Lipid species with a significant difference are denoted. The y-axis is the normalized intensity (Normalized Int.) for each lipid identified.
Extended Data Fig. 9
Extended Data Fig. 9. Cell membrane charge and daptomycin binding.
a-b. Zeta potential (measured in mV) is shown on the y-axis. Points represent each independent biological replicates (n = 3) and lines represent the median and interquartile range. Data was analysed with a one-way ANOVA [daptomycin-susceptible clinical strain versus daptomycin-resistant clinical strain (with a RpoB mutation) (ST203 [H486Y], ST80 [G482D], ST1421 [S491F]) or WT versus RpoB complement (-C)] and P values were corrected for multiple testing using the Dunnett method. c-d. Binding of BoDIPY-DAP, represented as relative fluorescence units (RFU) is shown on the y-axis. Points represent each independent biological replicates (n = 4 for the clinical strains and n = 5 for the RpoB complement strains) and lines represent the median and interquartile range. Data was analysed with a one-way ANOVA [daptomycin-susceptible clinical strain versus daptomycin-resistant clinical strain (with a RpoB mutation) (ST203 [H486Y], ST80 [G482D], ST1421 [S491F]) or WT versus RpoB complement (-C)] and P values were corrected for multiple testing using the Dunnett method. For a-d exact P values are provided when the P value is above P < 0.0001; ns=not significant. Source Data

References

    1. Murray, C. J. et al. Global burden of bacterial antimicrobial resistance in 2019: a systematic analysis. Lancet399, 629–655 (2022). - PMC - PubMed
    1. Cairns, K. A. et al. Therapeutics for vancomycin-resistant enterococcal bloodstream infections. Clin. Microbiol. Rev.36, e0005922 (2023). - PMC - PubMed
    1. Bass, N. M. et al. Rifaximin treatment in hepatic encephalopathy. N. Engl. J. Med.362, 1071–1081 (2010). - PubMed
    1. Arias, C. A. & Murray, B. E. The rise of the Enterococcus: beyond vancomycin resistance. Nat. Rev. Microbiol.10, 266–278 (2012). - PMC - PubMed
    1. Top, J., Willems, R. & Bonten, M. Emergence of CC17 Enterococcus faecium: from commensal to hospital-adapted pathogen. FEMS Immunol. Med. Microbiol.52, 297–308 (2008). - PubMed

MeSH terms

LinkOut - more resources