. 2024 Dec;636(8041):190-197.
doi: 10.1038/s41586-024-08102-8. Epub 2024 Oct 23.

Anti-viral defence by an mRNA ADP-ribosyltransferase that blocks translation

Affiliations

Anti-viral defence by an mRNA ADP-ribosyltransferase that blocks translation

Christopher N Vassallo et al. Nature. 2024 Dec.

Abstract

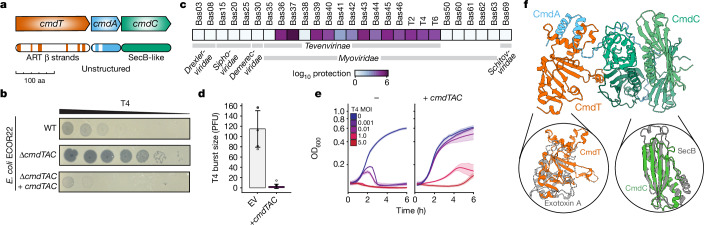
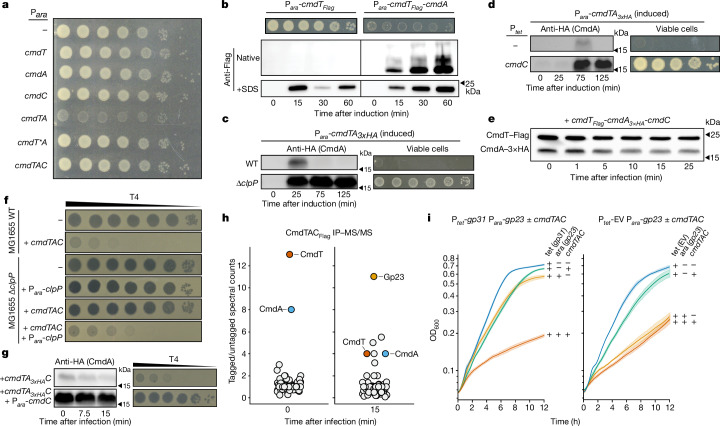
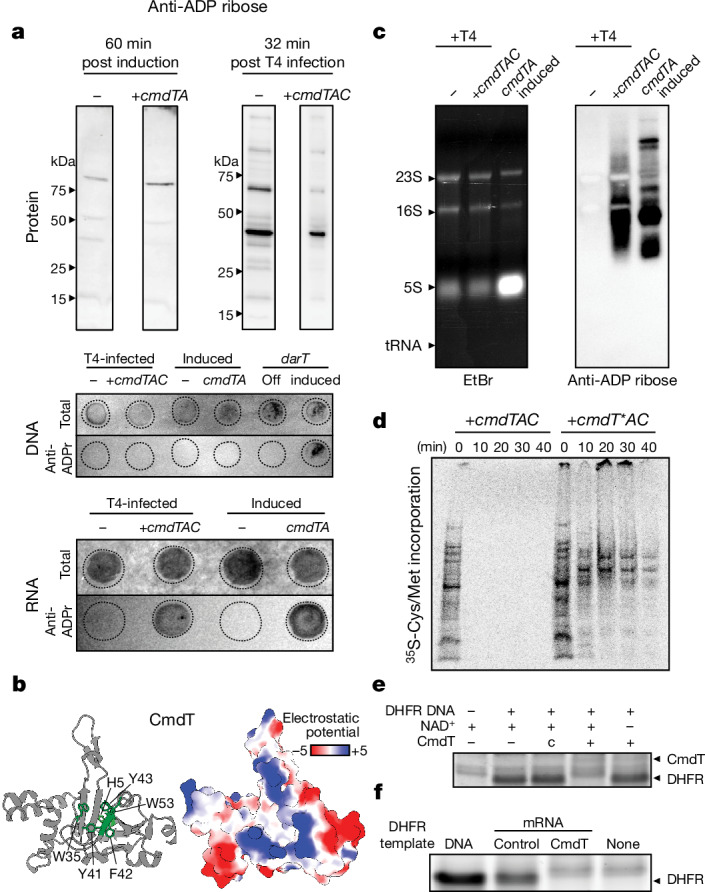
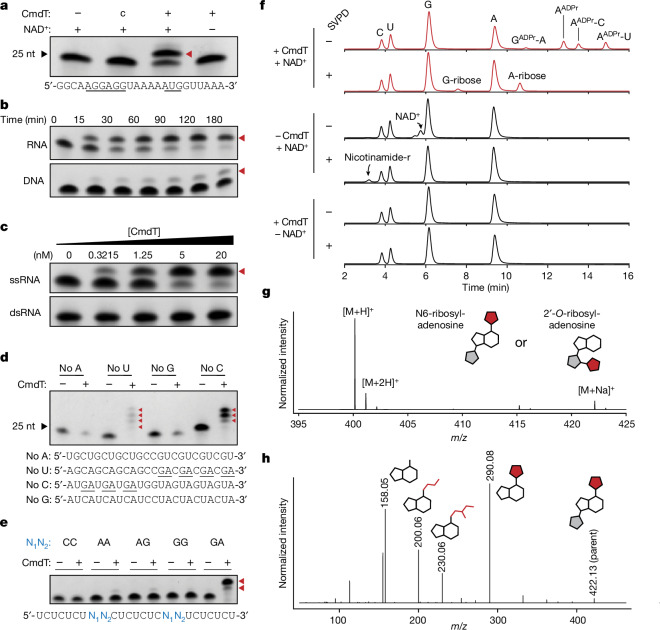
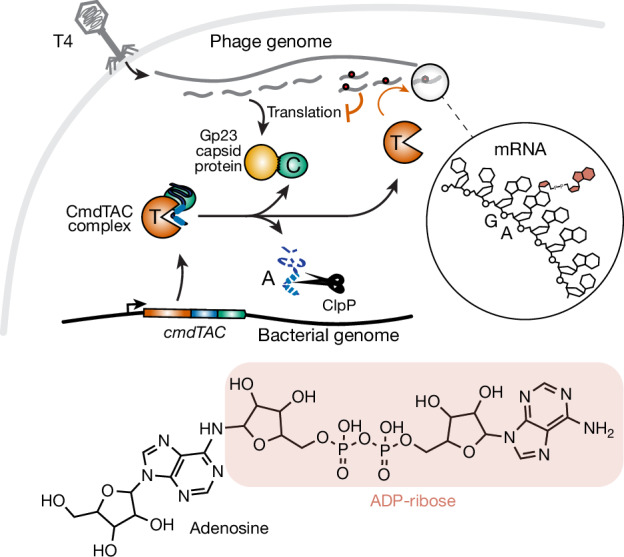
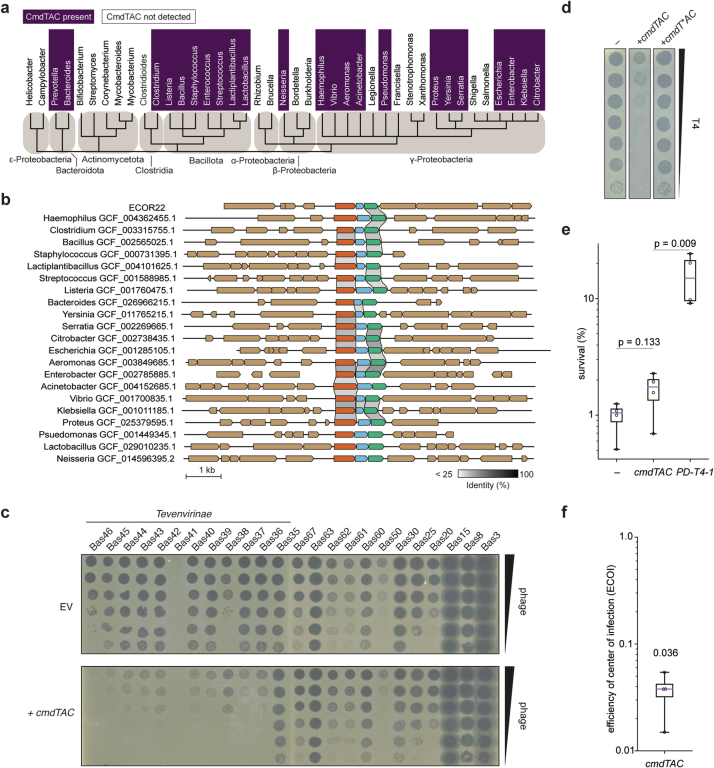
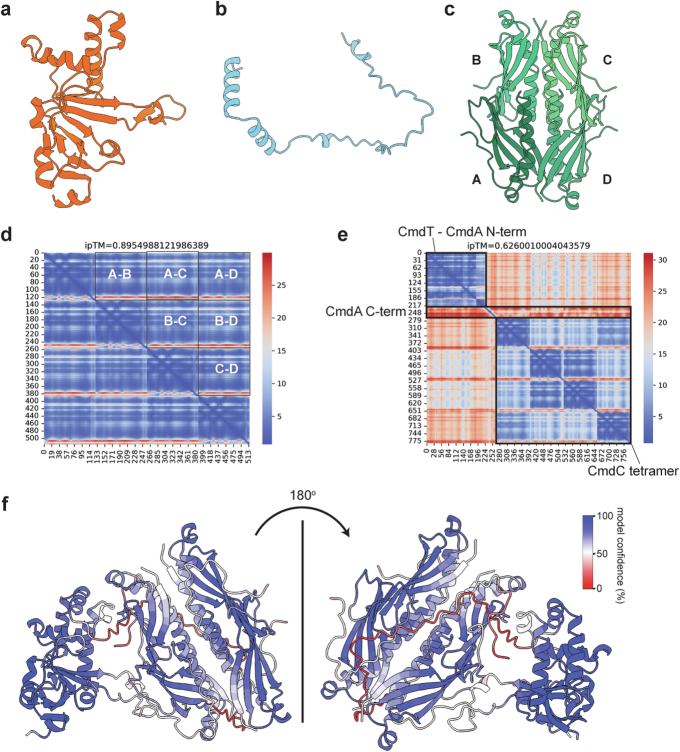
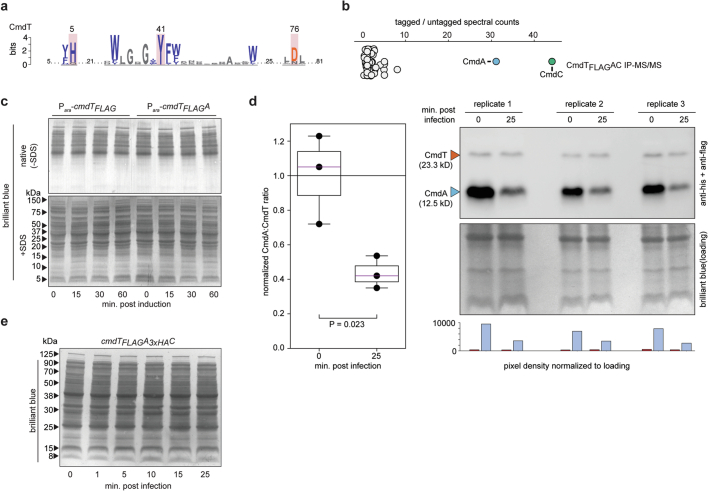
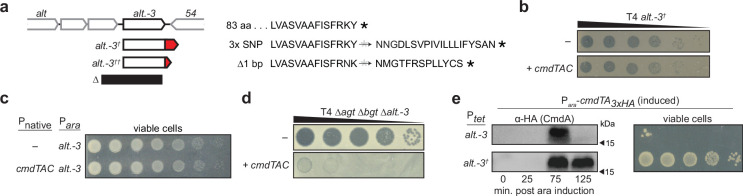
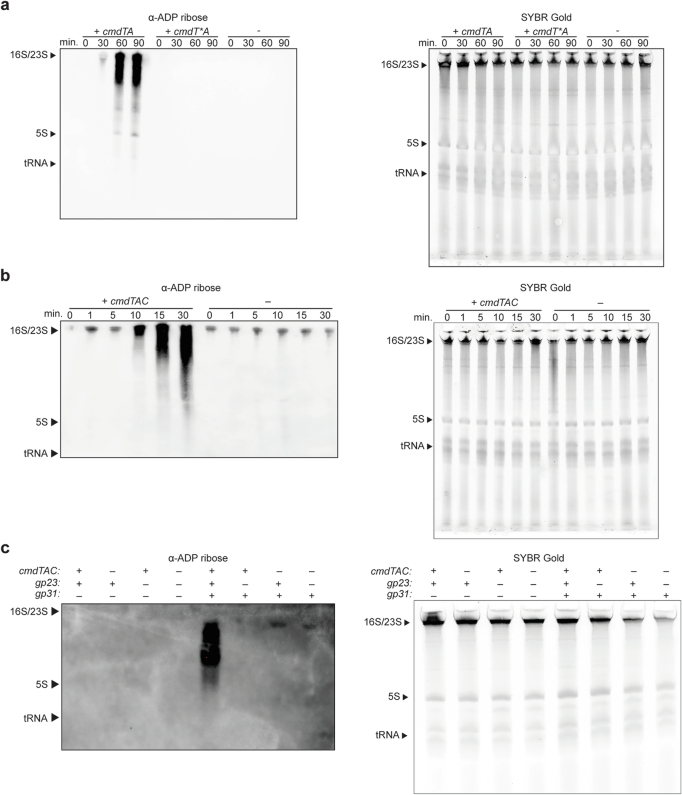
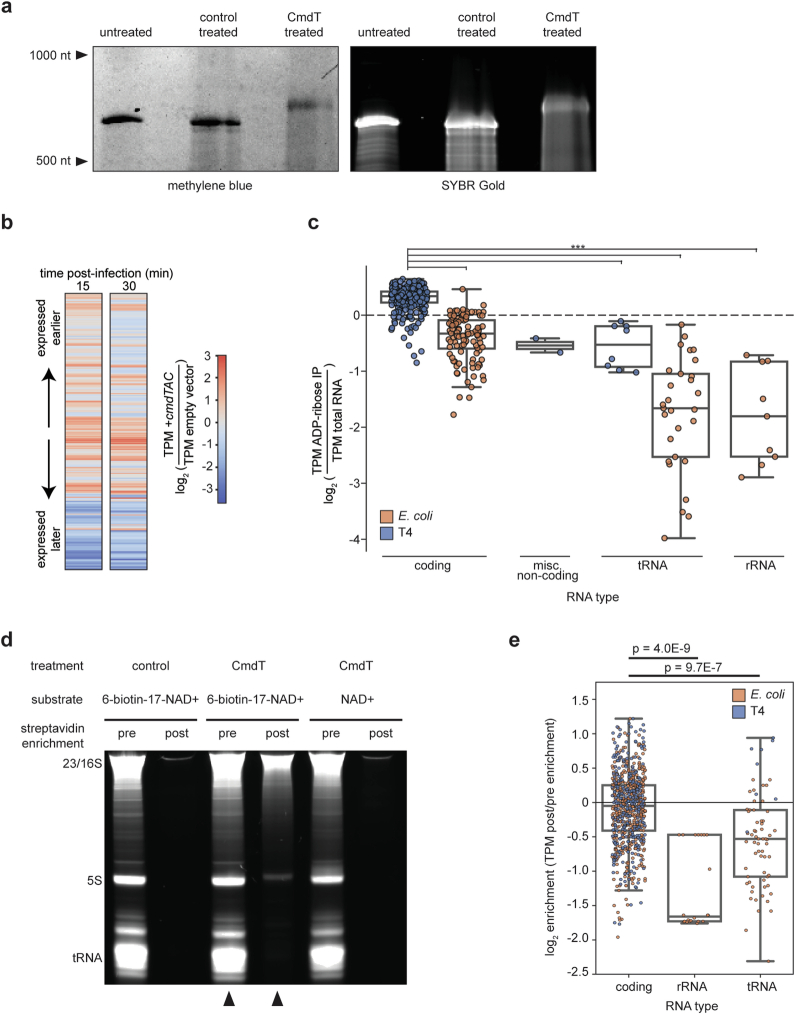
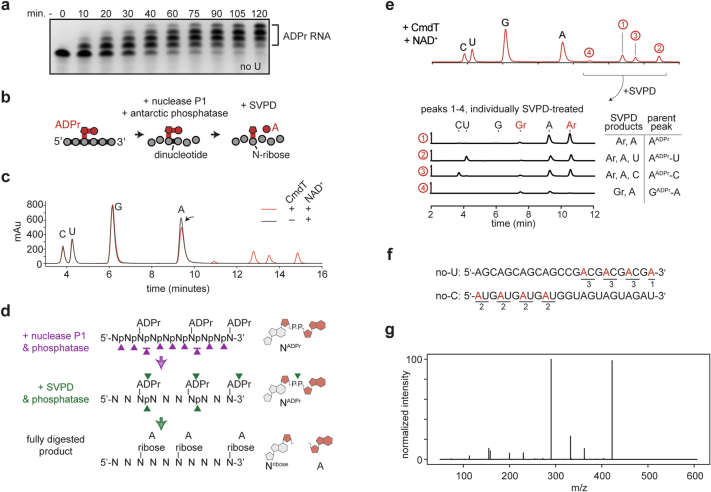
Host-pathogen conflicts are crucibles of molecular innovation1,2. Selection for immunity to pathogens has driven the evolution of sophisticated immunity mechanisms throughout biology, including in bacterial defence against bacteriophages3. Here we characterize the widely distributed anti-phage defence system CmdTAC, which provides robust defence against infection by the T-even family of phages4. Our results support a model in which CmdC detects infection by sensing viral capsid proteins, ultimately leading to the activation of a toxic ADP-ribosyltransferase effector protein, CmdT. We show that newly synthesized capsid protein triggers dissociation of the chaperone CmdC from the CmdTAC complex, leading to destabilization and degradation of the antitoxin CmdA, with consequent liberation of the CmdT ADP-ribosyltransferase. Notably, CmdT does not target a protein, DNA or structured RNA, the known targets of other ADP-ribosyltransferases. Instead, CmdT modifies the N6 position of adenine in GA dinucleotides within single-stranded RNAs, leading to arrest of mRNA translation and inhibition of viral replication. Our work reveals a novel mechanism of anti-viral defence and a previously unknown but broadly distributed class of ADP-ribosyltransferases that target mRNA.


Conflict of interest statement

Competing interests: The authors declare no competing interests.

Figures

Fig. 1
Fig. 1. The anti-phage defence system CmdTAC protects E. coli against infection by Tevenviridae.
a, Schematic of the cmdTAC operon (NCBI proteins RCP66309-11.1) indicating structural features predicted by HHpred. ART, ADP-ribosyltransferase. b, Plaquing of tenfold serially diluted T4 phage on lawns of E. coli strain ECOR22 and an ECOR22 ΔcmdTAC mutant without or with a low-copy plasmid containing cmdTAC under its native promoter. c, Efficiency of plating of the phages indicated on E. coli K-12 + cmdTAC relative to an empty vector control. T2, T4 and T6 data from ref. . d, T4 burst size in E. coli K-12 + cmdTAC or an empty vector (EV) (1 h at 30 °C). Data are mean ± s.d.; n = 5 biological replicates. e, Growth of E. coli K-12 + cmdTAC or empty vector and infected with T4 at the indicated MOIs. The centre line indicates mean, shaded area represents 95% confidence interval; n = 6 technical replicates; representative of 3 biological replicates. f, AlphaFold2-predicted model of CmdTAC complex with insets showing structural alignments of CmdT to the ADP-ribosyltransferase exotoxin A (Protein Data Bank (PDB) 1AER, root mean square deviation (r.m.s.d.) 6.93 Å) and CmdC monomer to the SecB chaperone monomer (PBD 1OZB, r.m.s.d. 4.13 Å ). r.m.s.d. values were generated by Foldseek. Source Data
Fig. 2
Fig. 2. CmdTAC is a TAC system that is activated by the T4 major capsid protein.
a, Plating viability (tenfold serial dilutions) of strains containing empty vector or the indicated components and induced with 0.2% arabinose from an arabinose-inducible promoter (Para). b, Cells expressing cmdT or cmdTA with a Flag tag on the C terminus of CmdT were assessed for plating viability by growth on LB + arabinose (top) and CmdT expression by immunoblotting of native gels (middle) or SDS–PAGE (bottom). Loading control shown in Extended Data Fig. 3c. c, MG1655 Wild-type or MG1655 ΔclpP cells expressing cmdTA with a 3×HA tag at the N terminus of CmdA were assessed for CmdA levels by immunoblotting (left) and plating viability on LB + arabinose (right). d, Cells expressing cmdTA with CmdA harbouring an N-terminal 3×HA tag. The cells also contain empty vector or a vector with cmdC under the control of a tetracycline-inducible promoter. CmdA levels were measured by immunoblot (left) and cell viability was assessed by tenfold serial dilutions on LB with inducers (right). e, Immunoblots of cells harbouring cmdTAC with CmdT and CmdA engineered to have a Flag or 3×HA tag on their C and N terminus, respectively. Samples taken from cells infected with T4. Loading control shown in Extended Data Fig. 3e. f, Phage plaques of tenfold serially diluted T4 on MG1655 wild-type or MG1655 ΔclpP E. coli with empty vector or the indicated plasmids. g, Cells with cmdTAC (with N-terminally 3×HA tagged CmdA) and expressing an additional copy of cmdC (bottom) or not (top) were assessed for CmdA levels by immunoblot (left) and for defence by tenfold serially diluted T4 plaquing (right). h, IP–MS/MS analysis of proteins that co-precipitate with N-terminally Flag-tagged CmdC at 0 and 15 min after infecting cells harbouring cmdTAC with T4 phage. i, Growth of uninfected E. coli cells harbouring cmdTAC, with expression of Gp23 and Gp31 as indicated. The centre line indicates mean, shaded area represents 95% confidence intervals. n = 3 biological replicates. Source Data
Fig. 3
Fig. 3. CmdT is an ADP-ribosyltransferase that specifically targets mRNA to block translation.
a, ADP ribose antibody was used for immunoblots (top) or DNA and RNA dot blots (bottom) as indicated. Top left, samples taken from cells expressing cmdTA or harbouring an empty vector, 60 min post-induction. Top right, samples taken from cells expressing cmdTAC under its native promoter or harbouring an empty vector and infected with T4 phage for 32 min. Proteins were separated by SDS–PAGE; DNA and RNA samples were spotted onto nylon membranes. Total RNA and DNA are indicated by methylene blue staining. b, AlphaFold2-predicted structure of CmdT (left) with conserved aromatic residues and putative catalytic residues (see Extended Data Fig. 3a) shown in green, with the corresponding electrostatic surface representation. Colour bar is in units of kcal/(mol·e) (right). c, RNA samples from indicated strains and conditions were resolved on agarose gels and then stained with ethidium bromide (EtBr) to visualize total RNA or blotted with anti-ADP ribose to visualize ADP-ribosylated RNA. d, Protein synthesis, as measured by 35S-labelled cysteine and methionine incorporation at the indicated timepoints during T4 infection of cells harbouring CmdTAC or CmdT*AC, which has a catalytically inactive CmdT. Proteins were resolved by SDS–PAGE before phosphorimaging. Representative image from two independent biological replicates. e, In vitro transcription–translation reactions with DNA encoding dihydrofolate reductase (DHFR) used as template. Purified CmdT and NAD+ were added, where indicated, with DHFR production visualized by Coomassie staining. c indicates control eluant (mock purification). The DHFR band was identified based on the ladder in Supplementary Fig. 1. f, In vitro transcription–translation reactions using a DNA template encoding DHFR or mRNA templates produced by T7 RNA polymerase and treated with CmdT (or eluent from a mock purification of untagged CmdT) prior to addition. The DHFR band was identified based on positive and negative controls in lanes 1 and 4, respectively.
Fig. 4
Fig. 4. CmdT modifies the N6 methyl group of adenine in GA dinucleotides of ssRNA.
a, The indicated RNA oligonucleotide was incubated with 4 nM CmdT–His6, protein from a mock purification of untagged CmdT (c) or no protein (−), with or without NAD+. Reaction products were resolved on a polyacrylamide TBE-urea gel and imaged by methylene blue staining. Red arrowheads indicate ADP-ribosylated products. b, ADP-ribosylation by 4 nM CmdT–His6 of the RNA (top) or equivalent DNA (bottom) oligonucleotide at the indicated timepoints, visualized as in a. c, ADP-ribosylation by CmdT–His6 of the ssRNA oligonucleotide from b or the corresponding dsRNA with increasing concentrations of CmdT–His6 for 60 min. d, ADP-ribosylation by CmdT–His6 of the indicated oligonucleotides, which lack A, U, G or C. e, ADP-ribosylation by CmdT–His6 of the indicated oligonucleotide (bottom) with the identity of the variable dinucleotides (N1N2) indicated above each reaction. f, HPLC analysis of nucleosides isolated following incubation of the no-U and no-C RNA oligonucleotides in d with CmdT and NAD+, as indicated, and then treated with nuclease P1 and antarctic phosphatase, with or without SVPD, as indicated. Peaks corresponding to A, C, G and U nucleosides, NAD+, G-ribose, A-ribose and nicotinamide-riboside (nicotinamide-r, produced from SVPD cleavage of unused NAD+) are marked, along with species from the top row identified in Extended Data Fig. 7e as GA, A, AC and AU, with the first nucleotide in each case being ADP-ribosylated (ADPr). The y axis represents absorbance at 254 nm. g, ESI-MS analysis of the A-ribose peak fraction from f. h, MS/MS fragmentation of the A-ribose sodium adduct from g. Collision energy, 40 eV. Predicted fragments are annotated with structures and m/z is indicated. Grey, ribose from adenosine; red, ribose from ADP ribose; white, adenine. Structures of fragmentation products are shown in Extended Data Fig. 8a. Source Data
Fig. 5
Fig. 5. Model for anti-phage defence by the CmdTAC system.
Top, CmdTAC produced by E. coli forms a complex prior to infection. Following T4 infection, newly synthesized capsid protein (Gp23) binds CmdC chaperone, leading to degradation of CmdA by ClpP and subsequent release of active CmdT toxin. CmdT ADP-ribosylates GA dinucleotides in ssRNAs thereby preventing their translation and the production of mature T4 virions. Bottom, structure of ADP-ribosylated adenosine.
Extended Data Fig. 1
Extended Data Fig. 1. Taxonomic distribution of cmdTAC and efficiency of plaquing for BASEL and T-even phages.
(a) Presence or absence of CmdTAC homologs in bacterial genera with > 1000 sequenced genomes (see Methods). (b) Examples of CmdTAC homologs found in diverse bacterial species. Grey bars between genes capture percent identity, defined by the color bar below. (c) Plaquing of the phages indicated on E. coli K12 harboring cmdTAC under control of its native promoter or an empty vector control. Data used to generate EOP data in Fig. 1c. (d) Plaquing of T4 phage on EV, cmdTAC+, or cmdT*AC+. (e) Survival assay of empty vector, cmdTAC+ cells or cells expressing a direct defense system (PD-T4-1) from its native promoter on the same low-copy plasmid. Values represent the number of CFUs of each strain after 18 min of infection divided by the CFUs pre-infection. Boxplots represent the median and quartile ranges of n = 4 biological replicates, with whiskers indicating max/min values. p-values are indicated at the top and represent a two-sided independent t-test. (f) Efficiency of center of infection assays with cmdTAC+ cells which measures the number of infected cells that go on to produce > 0 progeny phage. Value is measured relative to the empty vector control. Boxplots represent the median and quartile ranges of n = 4 biological replicates, with whiskers indicating max/min values. Source Data
Extended Data Fig. 2
Extended Data Fig. 2. AlphaFold2-based prediction of CmdTAC structures.
(a-c) AlphaFold2 predicted structures of CmdT (A), CmdA (B), and tetrameric CmdC (C). For the CmdC tetramer in panel (c) each subunit is labeled with a letter (A-D) where noted in panel (d). (d) PAE plot and per-residue model confidence score (pLDDT) for AlphaFold2-predicted CmdC tetramer. For the upper triangle of the plot, each subunit-subunit interaction is boxed and labeled with the corresponding subunit interactions corresponding to the subunits labeled in (c). (e) PAE plot and per-residue model confidence score (pLDDT) for the AlphaFold2-predicted complex of CmdTAC. Outlined in black and labeled within the plot are regions corresponding to notable features in the CmdTAC complex. (f) Ribbon diagrams of predicted CmdTAC complex, color-coded based on per-residue model confidence score (pLDDT).
Extended Data Fig. 3
Extended Data Fig. 3. Sequencing logo and IP-MS/MS interacting partners of CmdT, loading controls of for immunoblots, and quantification of CmdA degradation.
(a) Sequence logo showing conservation of putative catalytic residues in CmdT homologs. Shaded residues indicate active site residues in known ADP-ribosyltransferases. Blue color indicates conserved, aromatic residues. Amino acid numbers for CmdTECOR22 listed across the top. (b) IP-MS/MS of proteins co-precipitating with N-terminally FLAG-tagged CmdT. Data points corresponding to CmdC and CmdA are labeled. The x-axis indicates the ratio of spectral counts for cmdTFLAGAC and cmdTAC containing cells, both on low copy plasmids under the cmdTAC native promoter. A pseudocount is added to each sample set. (c) Coomassie stained gels used as loading controls for immunoblots shown in Fig. 2b. (d) Western blot for CmdTFLAG and CmdA3xHA at 0 and 25 min post T4 infection of ML4220. Left, quantification of CmdA to CmdT ratios as measured by pixel intensity of the Western blot on the right and normalized to total protein stain, bottom right. The normalized ratios were adjusted so that the mean time 0 value is equal to 1.0. Box plots display the values, median, and quartiles of three biological replicates, with whiskers indicating max/min values. Two-sided independent t-test p-value is shown. (e) Coomassie stained gel used as loading control for immunoblot shown in Fig. 2e. Source Data
Extended Data Fig. 4
Extended Data Fig. 4. Mutations to alt.-3 inhibit CmdTAC defense by blocking CmdA degradation.
(a) The alt.-3 and alt.-3†† mutations isolated as cmdTAC escape mutants are summarized below a diagram of the alt.-3 region of the T4 genome. The region deleted in T4 Δagt Δbgt Δalt.-3 is shown below. The C-termini of Alt.-3, Alt.-3, and Alt.-3†† are shown on the right. (b) Plaquing of 10-fold serially diluted T4 phage harboring the alt.-3 mutation on lawns of E. coli expressing cmdTAC or carrying an empty vector. (c) Plating viability of strains harboring cmdTAC or an empty vector and expressing the wild-type alt.-3 gene. (d) Plaquing of 10-fold serially diluted T4 Δagt Δbgt Δalt.-3 phage on lawns of E. coli harboring cmdTAC or an empty vector. The bacterial genotype was ∆mcrAmcrBC, as required for T4 ∆agtbgt. (e) Cells expressing cmdTA from an inducible promoter with CmdA engineered to have an N-terminal 3xHA tag. Cells also express alt.-3 or alt.-3 from a tetracycline-inducible promoter. CmdA levels were measured by immunblot (left), with cell viability assessed by 10-fold serial dilutions (right).
Extended Data Fig. 5
Extended Data Fig. 5. Anti-ADP ribose immuno-northern blots and total RNA staining of TBE-urea gels for varying methods of CmdT expression.
(a) Immuno-northern blot (left) and total RNA (right) of RNA samples taken from cells harboring arabinose-inducible cmdTA, cmdT*A, or an empty vector harvested at the times indicated post-induction. RNA was resolved on polyacrylamide gels. (b) Same as panel (a) but for cells harboring cmdTAC infected with T4 and harvested post-infection at the times indicated. (c) Same as panel (a) but for cells harboring cmdTAC, or an empty vector, and producing the combinations of Gp23 and Gp31 indicated.
Extended Data Fig. 6
Extended Data Fig. 6. TBE-urea gel resolution of in vitro modified mRNA and RNA-seq and RIP-seq analysis of ADP-ribosylated RNA.
(a) TBE-urea gel showing in vitro transcribed DHFR mRNA used as a translation template for the in vitro translation conducted in Fig. 3f. The DHFR transcript was either treated with a control eluant or CmdT. CmdT-treatment resulted in molecular weight increase equivalent to approximately 80 nucleotides. Sizes were determined based on a low-range ssRNA marker. (b) Heat maps summarizing, for each T4 transcript, the ratio of TPM values in cells harboring cmdTAC or an empty vector. Transcripts are ordered from top to bottom based on peak time of expression, as determined previously. Data are the average of two biological replicates. (c) Ratio of ADP-ribose IP enriched TPM to baseline RNA TPM values for each transcript. Transcripts are separated by RNA type and T4 vs MG1655 origin. Note that the T4 genome does not contain rRNA. Boxplots represent the median and quartile ranges, with whiskers indicating 1.5x interquartile range. Asterisks indicate p-value < 0.01 for a two-sided Welch’s t-test. Exact p-values for tests shown (all in comparison to T4 coding transcripts) are: E. coli coding, p = 9.9E-35; T4 tRNA, p = 4.9E-4; E. coli tRNA, p = 1.3E-11; E. coli rRNA, p = 9.0E-5. Data are the average of n = 2 biological replicates. (d) TBE-urea gel showing total RNA from T4-infected cells after treatment +/- CmdT and with 6-biotin-17-NAD+ or NAD+. RNA is shown pre- and post- streptavidin enrichment, with arrows indicating samples that were sequenced. (e) Ratio of TPM after streptavidin enrichment of biotinylated RNA to TPM pre-enrichment for each transcript. Transcripts are separated by RNA type and T4 vs MG1655 origin. Note that the T4 genome does not contain rRNA. Two-sided Welch’s t-test p-values are indicated. Boxplots represent the median and quartile ranges, with whiskers indicating 1.5x interquartile range.
Extended Data Fig. 7
Extended Data Fig. 7. Additional analyses of ADP-ribosylation of RNA by CmdT.
(a) The no-U oligo (see Fig. 4d) incubated with CmdT for the times indicated, with all reactions visualized as in Fig. 4. (b) Schematic showing enzymatic digestion of ADP-ribosylated oligos with nuclease PI and antarctic phosphatase, with or without snake venom phosphodiesterase (SVPD). (c) Overlay of HPLC traces from Fig. 4f derived from analysis of nucleosides isolated following incubation of the no-U and no-C RNA oligos with CmdT and NAD+ (or without NAD+, as indicated) and then treated with nuclease P1 and antarctic phosphatase. Arrow highlights the decrease in adenosine for reaction containing CmdT and NAD+. Peaks corresponding to A, C, G, and U nucleosides are marked. (d) Schematic summarizing enzymatic digestion activities of nuclease P1, antarctic phosphatase, and snake venom phosphodiesterase on ADP-ribosylated RNA oligos. (e-f) HPLC analysis of nucleosides produced after treating the numbered peaks from top row of Fig. 4f (reproduced at the top) with SVPD. The products are labeled and the inferred parent molecule indicated on the far right with the origin of the peaks on the oligo substrates shown in (f). Gr = G-ribose; Ar = A-ribose; ADPr = ADP-ribose. (g) MS/MS fragmentation of the A-ribose sodium adduct. Collision energy = 25 eV, as used previously. Note the absence of a ribose-ribose peak at m/z = 287. Source Data
Extended Data Fig. 8
Extended Data Fig. 8. Mass spectrometry and UV-Vis analysis of CmdT-dependent ADP-ribosylated adenosine.
(a) Predicted fragmentation of adenosine ribosylated on the N6 position (far left) to produce ribosylated adenine (second from left), which is predicted to further fragment into three species (right), with m/z values of 200, 230, and 158, corresponding to the peaks seen in Fig. 4h. (b) Predicted fragmentation of adenosine ribosylated on the 2′-OH (left) to produce the ribosylated adenine (right), with an m/z value of 287. This peak was not seen in Fig. 4h, but was seen with prior analysis of RhsP2 (ref. ). (c) UV-Vis spectroscopy of adenosine and CmdT-produced adenosine-ribose from Fig. 4f. Source Data

Similar articles

Cited by

References

    1. Daugherty, M. D. & Malik, H. S. Rules of engagement: molecular insights from host-virus arms races. Annu. Rev. Genet.46, 677–700 (2012). - PubMed
    1. McLaughlin, R. N. & Malik, H. S. Genetic conflicts: the usual suspects and beyond. J. Exp. Biol.220, 6–17 (2017). - PMC - PubMed
    1. Georjon, H. & Bernheim, A. The highly diverse antiphage defence systems of bacteria. Nat. Rev. Microbiol.21, 686–700 (2023). - PubMed
    1. Vassallo, C. N., Doering, C. R., Littlehale, M. L., Teodoro, G. I. C. & Laub, M. T. A functional selection reveals previously undetected anti-phage defence systems in the E. coli pangenome. Nat. Microbiol.7, 1568–1579 (2022). - PMC - PubMed
    1. Cohen, M. S. & Chang, P. Insights into the biogenesis, function, and regulation of ADP-ribosylation. Nat. Chem. Biol.14, 236–243 (2018). - PMC - PubMed

MeSH terms