. 2024 Nov;635(8038):434-443.
doi: 10.1038/s41586-024-08085-6. Epub 2024 Oct 23.

Chromatin remodelling drives immune cell-fibroblast communication in heart failure

Affiliations

Chromatin remodelling drives immune cell-fibroblast communication in heart failure

Michael Alexanian et al. Nature. 2024 Nov.

Abstract

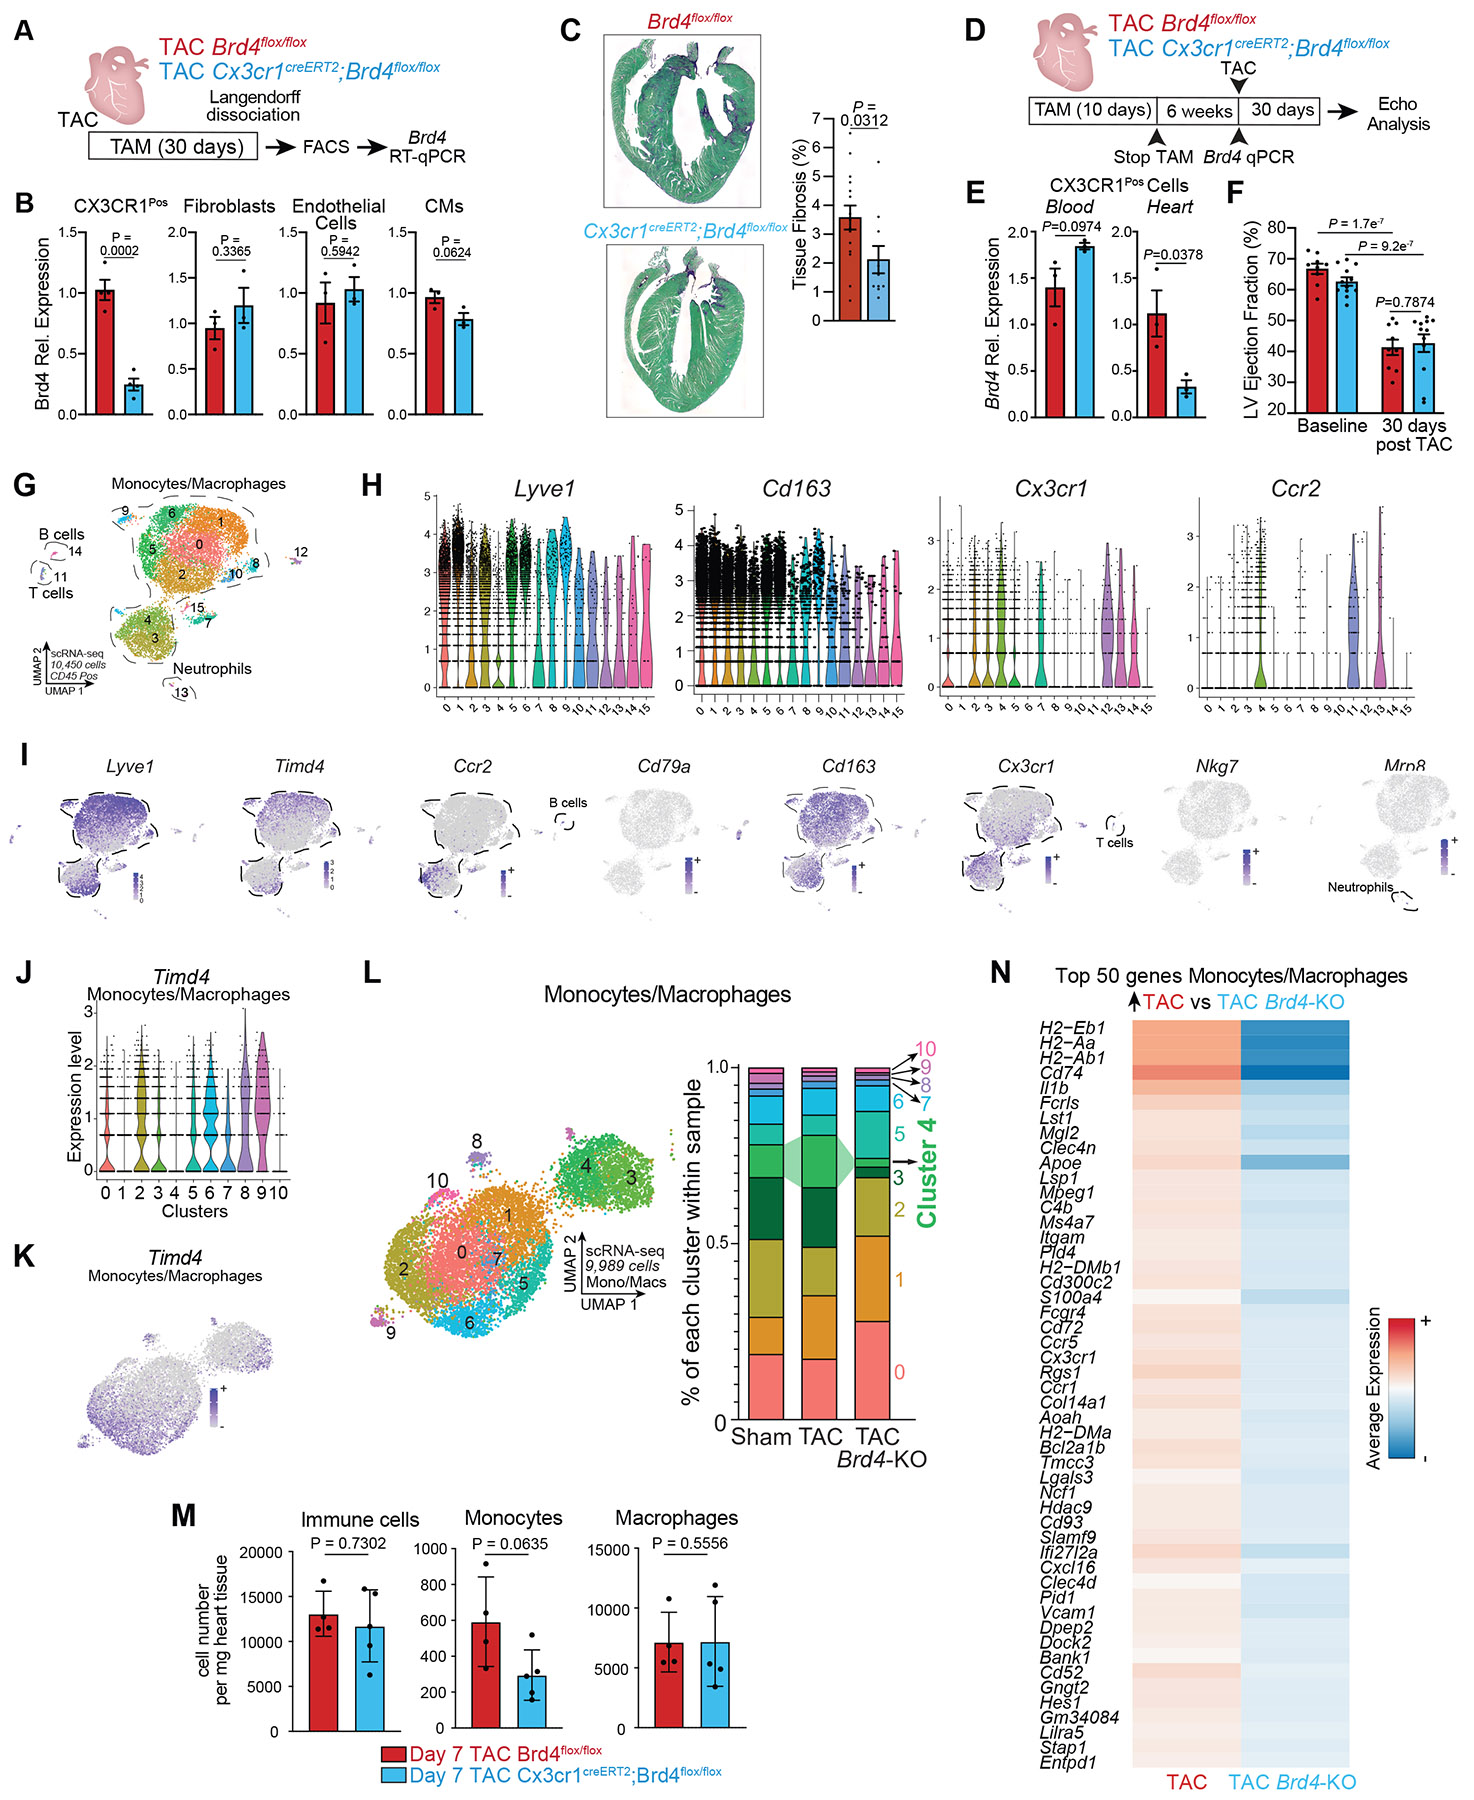
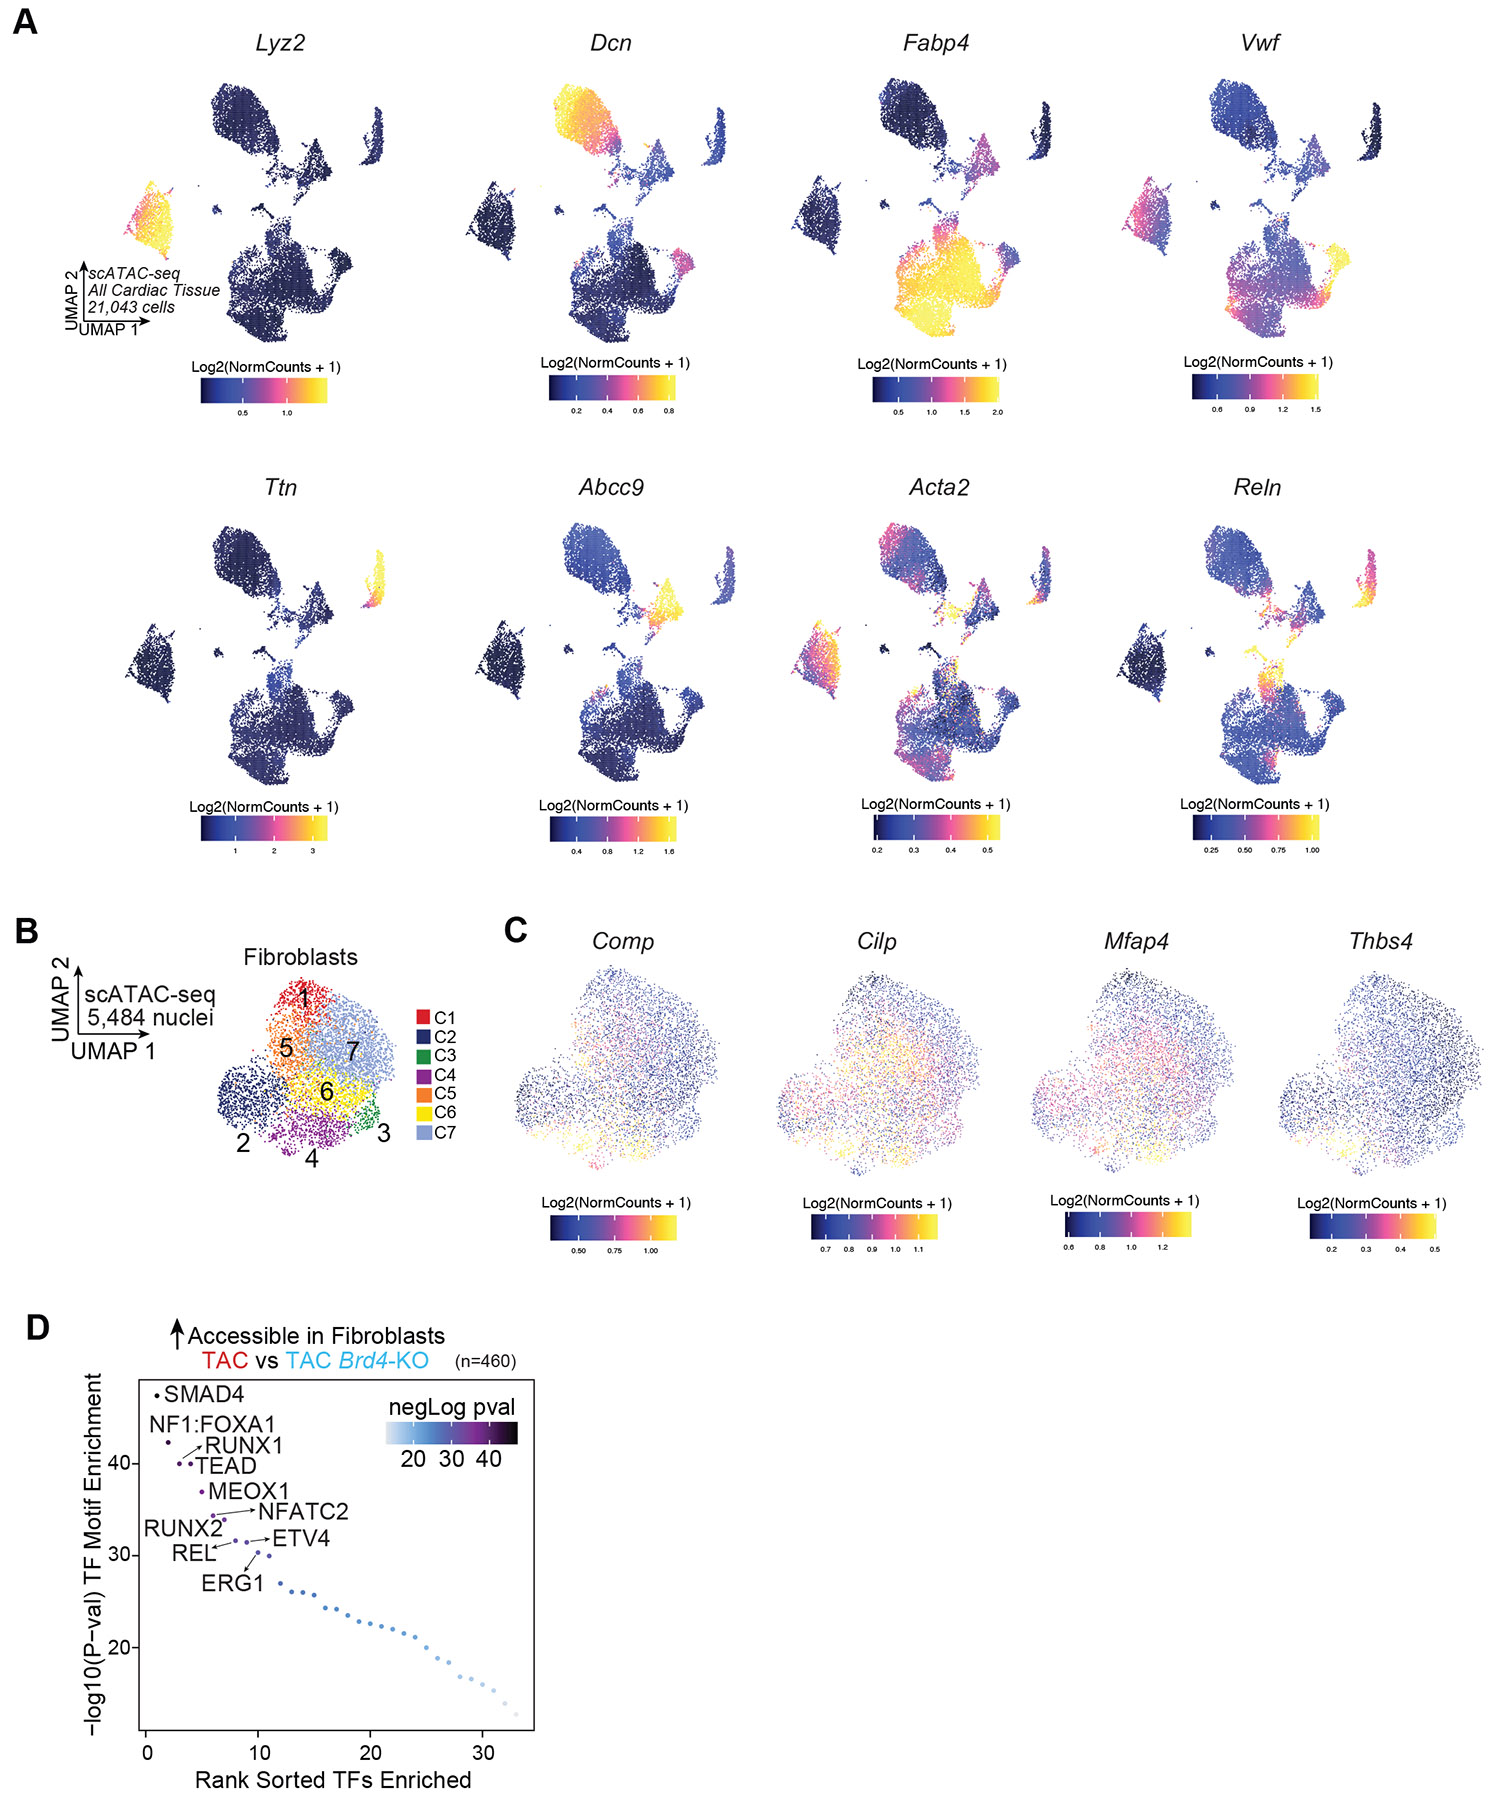
Chronic inflammation and tissue fibrosis are common responses that worsen organ function, yet the molecular mechanisms governing their cross-talk are poorly understood. In diseased organs, stress-induced gene expression changes fuel maladaptive cell state transitions1 and pathological interaction between cellular compartments. Although chronic fibroblast activation worsens dysfunction in the lungs, liver, kidneys and heart, and exacerbates many cancers2, the stress-sensing mechanisms initiating transcriptional activation of fibroblasts are poorly understood. Here we show that conditional deletion of the transcriptional co-activator Brd4 in infiltrating Cx3cr1+ macrophages ameliorates heart failure in mice and significantly reduces fibroblast activation. Analysis of single-cell chromatin accessibility and BRD4 occupancy in vivo in Cx3cr1+ cells identified a large enhancer proximal to interleukin-1β (IL-1β, encoded by Il1b), and a series of CRISPR-based deletions revealed the precise stress-dependent regulatory element that controls Il1b expression. Secreted IL-1β activated a fibroblast RELA-dependent (also known as p65) enhancer near the transcription factor MEOX1, resulting in a profibrotic response in human cardiac fibroblasts. In vivo, antibody-mediated IL-1β neutralization improved cardiac function and tissue fibrosis in heart failure. Systemic IL-1β inhibition or targeted Il1b deletion in Cx3cr1+ cells prevented stress-induced Meox1 expression and fibroblast activation. The elucidation of BRD4-dependent cross-talk between a specific immune cell subset and fibroblasts through IL-1β reveals how inflammation drives profibrotic cell states and supports strategies that modulate this process in heart disease and other chronic inflammatory disorders featuring tissue remodelling.


Conflict of interest statement

Competing interests D.S. is scientific co-founder, shareholder and director of Tenaya Therapeutics. S.M.H. is an executive, officer and shareholder of Amgen and is a scientific co-founder and shareholder of Tenaya Therapeutics. T.A.M. received funding from Italfarmaco for an unrelated project. K.S.P. is a shareholder of Tenaya Therapeutics.

Figures

Extended Data Fig. 1:
Extended Data Fig. 1:. Single-cell RNA-seq in heart failure with BET inhibition identifies a highly dynamic Cx3cr1-expressing monocyte/macrophage subpopulation
A. scRNA-seq expression Feature Plots of cell population markers in non-CM cells. B. Expression Dot Plot of the 24 most positively-correlated genes with LV ejection fraction in Sham, TAC, and TAC JQ1. C,D. UMAP plots of myeloid cells colored by cluster (C) and sample identity (D). E. Expression Feature Plots monocyte-derived and resident macrophages in myeloid cells. F. Sample distribution within clusters in myeloid cells. G. Sample distribution of resident macrophages (defined as clusters 0,2,3,4,6) and Ccr2-positive cells (defined as clusters 1 and 5). H,I. Flow cytometry strategy (H) and number of immune cells, monocytes and macrophages (I) obtained from the ventricular tissues of TAC and TAC JQ1 at day 7 post-surgery. I, Data are mean ± s.d. Two-tailed Mann-Whitney U test.
Extended Data Fig. 2:
Extended Data Fig. 2:. BRD4 in infiltrated but not resident Cx3cr1-expressing cells contributes to heart failure pathogenesis
A,B. Schematic of experimental settings of Brd4 deletion in Cx3cr1+ cells with continuous tamoxifen treatment (A), and Brd4 expression measured by qPCR in sorted CX3CR1+, fibroblasts (mEF-SK4+, CD45, CD31), endothelial cells (mEF-SK4, CD45, CD31+) and in unsorted CMs (B). C. Representative images of Sirius green staining (top) and fibrosis quantification (bottom) between TAC (red) and TAC Brd4-KO (blue). D,E. Schematic of experimental settings of pulsatile tamoxifen (TAM) treatment, which allows for Brd4 deletion specifically in Cx3cr1+ cardiac resident macrophages (D) and Brd4 expression measured by qPCR in blood and cardiac sorted CX3CR1+ cells (E). F. LV ejection fraction quantified by echocardiography in Brd4flox/flox and Cx3cr1CreERT2;Brd4flox/flox littermates. Only Cx3cr1+ resident macrophages have downregulation of Brd4 in this experiment. G. UMAP plot of CD45+ cells colored by cluster identity. H. Expression Violin Plots of monocyte/macrophage markers in CD45+ cells. I. Expression Feature Plots of immune cell markers in CD45+ cells. J,K. Expression of Timd4 by clusters (J) and in UMAP plot (K) in monocytes/macrophages. L. UMAP plot of monocytes/macrophages colored by cluster (left) and cluster composition within samples (right). Changes in cluster 4 are highlighted. M. Flow cytometry analysis of immune cells, monocytes and macrophages obtained from the ventricular tissues of Brd4flox/flox and Cx3cr1CreERT2;Brd4flox/flox littermates. N. Heatmap of expression depicting the top 50 genes upregulated in TAC versus TAC Brd4-KO in the monocyte/macrophage population. Data are mean ± s.e.m (B,C,E,F) and ± s.d. (M). Unpaired, two-tailed Student’s t-test (B,C,E), one-way ANOVA followed by Tukey post hoc test (F). Two-tailed Mann-Whitney U test (M).
Extended Data Fig. 3:
Extended Data Fig. 3:. Decreased profibrotic signature in fibroblasts with Brd4 deletion in Cx3cr1-expressing monocytes/macrophages.
A. Expression Feature Plots of cell population markers in nuclei from cardiac tissue. B. Expression of Brd4 in TAC and TAC Brd4-KO across all clusters. C. UMAP plot of fibroblasts colored by cluster sample identity. D. Expression Feature Plot of Brd4 in fibroblasts. E. UMAP plot of fibroblasts colored by cluster identity. F. Expression Violin Plots of profibrotic markers across clusters in fibroblasts. G. Expression Feature Plots of profibrotic markers in fibroblasts. H. Sample distribution within fibroblast clusters. I. Heatmap of expression depicting the top 50 genes upregulated in TAC versus TAC Brd4-KO in fibroblasts. J. Heatmap indicating significance (−log10(p–val)) for indicated GO terms in genes upregulated in TAC vs TAC Brd4-KO (left, in red) or upregulated in TAC Brd4-KO vs TAC (right, in blue) in fibroblasts. K. Venn diagram comparing the genes upregulated in fibroblasts in TAC versus TAC+JQ1 (from Fig. 1 analysis) and those upregulated in TAC vs TAC Brd4-KO (from Fig. 2 analysis).
Extended Data Fig. 4:
Extended Data Fig. 4:. Changes in fibroblast chromatin accessibility with Brd4 deletion in Cx3cr1-expressing monocytes/macrophages
A. Chromatin accessibility gene score of cell population markers across nuclei from cardiac tissue. B. UMAP plot (scATAC-seq) of fibroblasts colored by cluster identity. C. Chromatin accessibility gene score of Comp, Cilp, Mfap4 and Thbs4 in fibroblasts. D. TF motif enrichment of fibroblast chromatin regions more accessible in TAC versus TAC Brd4-KO. Top 10 motifs are highlighted. A hypergeometric test was used to calculate p-values.
Extended Data Fig. 5:
Extended Data Fig. 5:. Identification of monocyte/macrophage population with single-cell ATAC-seq
A. UMAP plot (scATAC-seq) of CD45+ cells colored by cluster, the clusters encompassing the monocyte/macrophage populations are highlighted. B. Chromatin accessibility gene score of monocyte/macrophage markers in CD45+ cells. C. UMAP plot (scATAC-seq) of monocytes/macrophages colored by cluster identity. D. Monocyte/macrophage cluster distribution within samples.
Extended Data Fig. 6:
Extended Data Fig. 6:. Chromatin accessibility and BRD4 occupancy in Cx3cr1-expressing cells identifies set of highly dynamic monocyte/macrophage distal elements in heart failure
A. Distribution of accessibility in monocytes/macrophages in the TAC state identifies a class of distal regions (super-enhancers (SE)) for which the accessibility falls over the inflection point of the curve. B. Volcano plot depicting p65/RELA binding in all differentially expressed genes between TAC and TAC Brd4-KO (Log2FC>0.125 or Log2FC<−0.125; FDR<0.05) in monocytes/macrophages. C. Schematic of the targeting strategy to generate the Brd4 3xFlag mouse. D. Western blot showing WT and 3xFLAG knock-in bands in WT and Brd4flag/+ animals. E. Liver tissue western blot showing expression of endogenous long and short BRD4 isoforms treated with vehicle or with the small-molecule BET protein degrader dBET1. F. Coverage from anti-FLAG Cut&Run in Sham and TAC identifies regions enriched with BRD4 in stress (left) or at baseline (right). G. Genes that are upregulated in TAC Brd4-KO vs TAC in monocytes/macrophages (from Figure 2 analysis) categorized by BRD4 binding in TAC. H. Examples of BRD4-dependent genes that display dynamic BRD4 recruitment in TAC in sorted Cx3cr1-positive cells. I. LogFC of BRD4 binding by CUT&RUN in TAC vs Sham at the super enhancers identified in the monocyte/macrophage population. J. Coverage from anti-FLAG CUT&RUN in Sham and TAC in selected ten super enhancer regions.
Extended Data Fig. 7:
Extended Data Fig. 7:. BRD4-dependent regulation of the Il1b super enhancer in heart failure
A. Schematic of the Il1b super enhancer locus displaying the 7 distal regions (Peak1 to Peak7) called as accessible peaks in scATAC-seq in monocytes/macrophages. B. Chromatin accessibility trend between samples (mean and 95% confidence interval) in all identified Il1b super-enhancer peaks. C. Schematic of the Il1b locus displaying the location of the gRNAs used to delete the 7 distal regions (Peak1 to Peak7). D,E. Agarose gel electrophoresis to assess distal peak deletions in Il1b locus (D) and unaffected region around Il1b promoter (E) (1813bp) in WT and KO clones.
Extended Data Fig. 8:
Extended Data Fig. 8:. Chromatin accessibility in human myeloid cells
A. Chromatin accessibility gene score of TIMD4, LYVE1 and CCR2 in human cardiac myeloid cells. B. Dot Plot indicating significance (−log10(p–val)) for indicated GO terms across human myeloid cell clusters.
Extended Data Fig. 9:
Extended Data Fig. 9:. IL1B synergizes with TGFB to drive profibrotic function of human induced pluripotent stem cell (iPSC) derived cardiac fibroblast
A. UMAP plot (snRNA-seq) of nuclei from cardiac tissue colored by cluster identity. B. Expression Feature Plot of Il1r1 in nuclei from cardiac tissue. Fibroblasts are highlighted. C. Protocol to generate human induced pluripotent cardiac fibroblasts (iPSC-CFs). D. Immunofluorescence staining of αSMA (left) in Unstimulated iPSC-CFs or treated with IL1B, TG-B or TGFB+IL1B. Nuclei are marked by Hoechst. Scale bars, 200 μm. Right, quantification of αSMA staining. E. Images (left) and quantification (right) of iPSC-CFs seeded on compressible collagen gel matrices in unstimulated or with IL1B, TGFB or TGFB+IL1B treatments. F. IL1R1 expression by qPCR in Unstimulated human iPSC-CFs with control or IL1R1-targeting siRNAs. G-J. Representative images (G) and quantification of human iPSC-CFs seeded on compressible collagen gel matrices comparing unstimulated cells with IL1B-treated (H), TGFB-treated (I) or TGFB+IL1B-treated (J) using a control or IL1R1-targeting siRNAs. K. Il1b expression by qPCR in Unstimulated and LPS treated RAW264-7 macrophages. L. MEOX1 expression by qPCR in Unstimulated human iPSC-CFs with control or MEOX1-targeting siRNAs. M,N,O. Representative images (M) and quantification of human iPSC-CFs seeded on compressible collagen gel matrices comparing unstimulated cells with L1B-treated (N) and TGFB-treated (O) using a control or MEOX1-targeting siRNAs. P. Human MEOX1 locus showing H3K27Ac in unstimulated iPS-CFs. The syntenic region of the mouse Meox1 Peak9/10 regulatory element is highlighted and the six p65/RELA motifs within the region indicated. Q. MEOX1 expression by qPCR in Unstimulated iPSC-CFs or treated with IL1B, TGFB, or TGFB+IL1B with vehicle or JQ1. R. p65/RELA expression by qPCR in Unstimulated iPSC-CFs or treated with IL1B, TGFB or TGFB+IL1B with control or p65/RELA-targeting siRNAs. D-F,H-L,N,O,Q,R. Data are mean ± s.e.m. One-way (D,Q,R) and Two-way (E,H-J,N,O) ANOVA followed by Tukey post hoc test. Unpaired, two-tailed Student’s t-test (F,K,L).
Extended Data Fig. 10:
Extended Data Fig. 10:. In vivo antibody-mediated IL1B neutralization decreases tissue fibrosis and profibrotic gene expression in fibroblasts
A. Representative images of Sirius green staining (left) and fibrosis quantification (right) between IgG Ab (red) and Anti-IL1B Ab (blue). B. UMAP plot of non-cardiomyocyte cells colored by cluster. C. Expression Feature Plots of cell population markers in non-cardiomyocyte cell population. D. Expression Feature Plots of Comp, Cilp, Mfap4 and Thbs4 in fibroblasts. E. Expression Violin Plots of Comp, Cilp, Mfap4 and Thbs4 across clusters in fibroblasts. F. Heatmap indicating significance (−log10(p–val)) of top GO terms for each fibroblast cluster. G. Expression Violin Plots of Comp, Cilp, Mfap4 and Thbs4 across samples in fibroblasts. H. Heatmap of expression of the top 50 genes upregulated in TAC IgG Ab versus TAC Anti-IL1B Ab in fibroblasts. I. Heatmap indicating significance (−log10(p–val)) for indicated GO terms in genes upregulated in IgG vs Anti-IL1B (red) or upregulated in Anti-IL1B vs IgG (blue) in fibroblasts. J. Heatmap indicating significance (−log10(p–val)) for indicated GO in genes upregulated or downregulated in fibroblasts clusters 3&5 vs all other clusters. A, Data are mean ± s.e.m. Unpaired, two-tailed Student’s t-test.
Extended Data Fig. 11:
Extended Data Fig. 11:. Decreased profibrotic signature in fibroblasts with Il1b deletion in Cx3cr1-expressing myeloid cells
A. Schematic of experimental settings for scRNA-seq from sorted cardiac fibroblasts at day 10 post TAC of Il1bflox/flox (TAC) and Cx3cr1CreERT2;Il1bflox/flox (TAC Il1b-KO) littermates (left). Il1b expression measured by qPCR in cardiac sorted CX3CR1+ cells (right). B. UMAP plot of fibroblast, endothelial, pericytes and smooth muscle cell markers in sorted fibroblasts at day 10 post TAC. C. Expression Violin Plots of profibrotic markers across clusters in sorted fibroblasts. D. Heatmap indicating significance (−log10(p−val)) of top GO terms for each fibroblast cluster. E. Expression Feature Plots of profibrotic markers in sorted fibroblasts. F. Expression Violin Plots profibrotic markers across samples in sorted fibroblasts. G. Heatmap of expression of the top 50 genes upregulated in TAC versus TAC Il1b-KO in sorted fibroblasts. H. Heatmap indicating significance (−log10(p–val)) for indicated GO terms in genes upregulated in TAC vs TAC Il1b-KO (red) or upregulated in TAC Il1b-KO vs TAC (blue) in sorted fibroblasts. A, Data are mean ± s.e.m. Unpaired, two-tailed Student’s t-test.
Extended Data Fig. 12:
Extended Data Fig. 12:. Comparison of cardiac fibroblast transcription with systemic IL1B inhibition and Il1b deletion in Cx3cr1-expressing cells after TAC.
A,B. UMAP plot generated by merging the fibroblasts from TAC IgG/TAC-Anti IL1B and TAC/TAC Il1b-KO datasets displaying clusters (A) and sample composition (B). C. Sample distribution within clusters in fibroblasts. D,E. Expression Feature plot (D) and violin plot across clusters (E ) of Postn and Meox1 expression. F. Heatmap indicating significance (−log10(p–val)) of top GO terms for each fibroblast cluster. G. Sample distribution of fibroblasts categorized as transcriptionally positive or negative for Postn and Meox1.
Fig. 1.
Fig. 1.. Stress-activated Cx3cr1+ macrophages contribute to heart failure pathogenesis.
A. Experimental schematic in Sham and TAC mice treated with JQ1 (50mg/kg daily). B. LV ejection fraction quantified by echocardiography (n=3 per group). Statistical significance shown between TAC and TAC JQ1 at day 30 post TAC. C. UMAP plot of non-cardiomyocyte cells colored by cluster. D. Schematic of correlation analysis between LV ejection fraction and gene expression. E. Number of genes with strong positive and negative correlations across cell populations (min. 250 cells). EC=Endothelial Cells. Lymph=Lymphatic; SMCs=Smooth Muscle Cells. F. Volcano plot of correlation coefficients and p-values for 17,519 genes in myeloid cells, referred to Fig. 1D. Cx3cr1 (pval 6.75e−11) and Il1b (pval 2.66e−9) are highlighted among the 22 genes with scores < −5. G. Expression Dot Plot of the 22 most anti-correlated genes from Fig. 1D. H,I. UMAP plot of myeloid cells colored by cluster (H) and sample identity (I). J. Violin Plots of macrophage markers across myeloid clusters. K. Violin Plots of Cx3cr1 and Il1b expression across samples. L. Heatmap of significance (−log10(p-val)) for GO terms in genes upregulated in TAC vs. TAC JQ1 or TAC JQ1 vs. TAC. Fisher’s exact test. M. Experimental schematic for conditional Brd4 deletion in Cx3cr1+ cells. N. LV ejection fraction quantified by echocardiography in Sham (n=3), Cx3cr1CreERT2 (n=6), Brd4flox/flox (n=12) and Cx3cr1CreERT2;Brd4flox/flox (n=19) TAC. B,N Data are mean ± s.e.m. One-way ANOVA followed by Tukey post hoc test.
Fig. 2.
Fig. 2.. BRD4 in Cx3cr1-positive macrophages drives proinflammatory transcription in heart failure pathogenesis.
A. Schematic for scRNA-seq in sorted CD45+ cells from Brd4flox/flox (TAC) and Cx3cr1CreERT2;Brd4flox/flox (TAC Brd4-KO) hearts. B. UMAP of monocytes/macrophages colored by cluster. C. Expression Violin Plots of macrophage markers across clusters. D. Feature Plots of macrophage marker expression. E. UMAP plots of monocytes/macrophages colored by sample identity. F. Heatmap of significance (−log10(p–val)) for proinflammatory GO terms across clusters. G. Expression Dot Plot of the 10 top gene markers in cluster 4 across all clusters. H. Expression Dot Plot of the 13 genes upregulated TAC versus Sham and downregulated in TAC-Brd4KO versus TAC across samples (Log2FC>0.5 and FDR<0.05). I. Violin Plot of Il1b expression across clusters. J. Feature Plot of Il1b expression. K. Violin Plot of Il1b expression across samples.
Fig. 3.
Fig. 3.. BRD4 in Cx3cr1+ macrophages activates cardiac fibroblasts non-cell autonomously.
A. Schematic for snRNA-seq and ATAC-seq from Brd4flox/flox (TAC) and Cx3cr1CreERT2;Brd4flox/flox (TAC Brd4-KO) hearts. B,C. UMAP plots of cardiac tissue nuclei by cluster (B) and sample identity (C). D. Number of DE genes between TAC and TAC Brd4-KO across cell populations with ≥800 cell (Log2FC>0.125; FDR<0.05). E,F. Fibroblast UMAP by cluster (E) and sample identity (F). G. Feature Plot of Postn and Meox1 expression in fibroblasts. H. GO terms for genes upregulated in TAC vs. TAC Brd4-KO. Fisher’s exact test. I. scATAC-seq UMAP of cardiac tissue nuclei by cluster. J, K. Fibroblast scATAC-seq UMAP by cluster (J) and sample (K). L. Postn and Meox1 accessibility gene score in fibroblasts. M,N Accessibility score UMAP of genes upregulated in TAC (n=2) vs. TAC Brd4-KO (n=2) (M) and violin plot quantification (N) in fibroblasts. N: Medians are center lines; boxes, 25th and 75th percentiles; whiskers, 1.5 times the IQR. One-tailed Wilcoxon rank sum test with continuity correction. O. Sample distribution within clusters in fibroblasts. P. TF motif enrichment of fibroblast chromatin regions more accessible in cluster 5 vs. cluster 2. Top 10 motifs highlighted. P-values calculated with hypergeometric test. Q. Fibroblast chromatin accessibility in TAC and TAC Brd4-KO at Postn and Meox1 loci. Key regulatory elements in red, showing co-accessibility with gene promoters.
Fig. 4.
Fig. 4.. BRD4-bound enhancers regulate stress-induced Il1b expression.
A. Schematic of scATAC-seq in CD45+ cells. B,C. Macrophage UMAP by cluster (B) and sample (C). D. Accessibility score of macrophage markers. E,F. UMAP (E) and violin (F) plots of accessibility score across genes upregulated in TAC vs. TAC Brd4-KO in Sham (n=1), TAC (n=2) and TAC Brd4-KO (n=2). F: Medians are center lines; boxes, 25th and 75th percentiles; whiskers extend 1.5 times IQR. G. GO term of chromatin regions driving cluster 4. Fisher’s exact test. H. TF motif enrichment of cluster 4 chromatin regions (background cluster 3). Hypergeometric test. I. Accessibility changes between samples at 748 macrophage super-enhancers. Genes proximal to candidate enhancers in top right quadrant. J. Chromatin accessibility changes between TAC/TAC Brd4-KO and p65/RELA occupancy at macrophage super-enhancers (same genes from 4I). K. Targeting strategy for Brd4flag allele and schematic for CUT&RUN in CX3CR1+ cells. L. Il1b locus. Distal Peak1-7 highlighted in red. M. Il1b expression in Unstimulated or LPS-treated RAW 264-7 macrophages in CRISPR WT and Peak1-7 KO clones (significance shown between WT and Peak5- and Peak6-KO), n=3, 3 experiments. N. Luciferase assay of Il1b Peak5 and Peak6 with BRD4 and p65/RELA. n=3, 3 experiments. O. scATAC-seq UMAP of human cardiac myeloid cells. P. Chromatin accessibility gene score of human CX3CR1 and IL1B. Q. Human IL1B locus, cardiac myeloid cell scATAC-seq accessibility in controls and myocardial infarction patients. Red boxes in Peak 5/6. Dashed grey lines: Peak5 y-axis value in Ctrl. M,N. Data are mean ± s.e.m. Two-way (M) and One-way (N) ANOVA followed by Tukey post hoc test. F, Kruskal-Wallis test followed by pairwise one-tailed Wilcoxon tests with FDR correction. I,J, One-sided Wilcoxon rank-sum tests.
Fig. 5.
Fig. 5.. Systemic IL1B inhibition or targeted il1b deletion prevents stress-induced MEOX1 expression and fibroblast activation.
A. Schematic of BMDM-conditioning experiment (left), collagen-contraction assay on human iPSC-CFs (right). n=6, 2 experiments. B. Bulk RNA-seq in iPSC-CFs. MEOX1 is highlighted. C. Collagen contractility of iPSC-CFs, unstimulated or TGFB+IL1B-treated with control or MEOX1-targeting siRNAs. n=3, 3 experiments. D. Human MEOX1 locus showing H3K27Ac and p65/RELA in unstimulated iPSC-CFs (syntenic mouse Meox1 Peak9/10 enhancer highlighted). E. Luciferase assay of MEOX1 enhancer (from D) with BRD4 and p65/RELA. n=4, 2 experiments. F. MEOX1 expression in iPSC-CFs treated with IL1B, TGFB, or TGFB+IL1B with control or p65/RELA-targeting siRNAs. n=3, 3 experiments. G. TAC C57BL/6J mice treated with 500μg IgG or anti-IL1B antibodies, IP injections every 3 days. Non-CMs processed at day 30 for scRNA-seq. H. LV ejection fraction, IgG (n=5), anti-IL1b antibody (n=9). I,J,K. Fibroblast UMAPs by cluster (I), sample (J) and Postn/Meox1 expression (K). L. Violin plots of Postn and Meox1 across fibroblast clusters. M. Sample distribution within fibroblast clusters. N. Violin plots of Postn and Meox1 in fibroblasts across samples. O. Schematic of scRNA-seq from sorted cardiac fibroblasts at day 10 post-TAC with Il1b deletion. P,Q. UMAPs of sorted fibroblasts by cluster (P) and sample (Q). R. Sample distribution within clusters in sorted fibroblasts. S. UMAPs of Postn and Meox1 expression in sorted fibroblasts. T. Violin plots of Postn and Meox1 expression in sorted fibroblasts across samples. U. Working model depicting aspects of the molecular mechanisms regulating crosstalk between Cx3cr1-positive cells and activated fibroblasts through IL1B and MEOX1. A,C,E. Data are mean ± s.e.m. Two-way (A,C) and One-way (E,H) ANOVA followed by Tukey post hoc test.

References

    1. Badeaux AI & Shi Y Emerging roles for chromatin as a signal integration and storage platform. Nat. Rev. Mol. Cell Biol 14, 211–224 (2013). - PMC - PubMed
    1. Buechler MB et al. Cross-tissue organization of the fibroblast lineage. Nature 593, 575–579 (2021). - PubMed
    1. Wang N, Wu R, Tang D & Kang R The BET family in immunity and disease. Signal Transduct Target Ther 6, 23 (2021). - PMC - PubMed
    1. Alexanian M. et al. A transcriptional switch governs fibroblast activation in heart disease. Nature vol. 595 438–443 Preprint at 10.1038/s41586-021-03674-1 (2021). - DOI - PMC - PubMed
    1. Filippakopoulos P. et al. Selective inhibition of BET bromodomains. Nature 468, 1067–1073 (2010). - PMC - PubMed

MeSH terms

LinkOut - more resources