. 2024 Oct 23;23(1):238.
doi: 10.1186/s12943-024-02118-4.

Epigenome-wide analysis across the development span of pediatric acute lymphoblastic leukemia: backtracking to birth

Affiliations

Epigenome-wide analysis across the development span of pediatric acute lymphoblastic leukemia: backtracking to birth

Akram Ghantous et al. Mol Cancer. .

Abstract

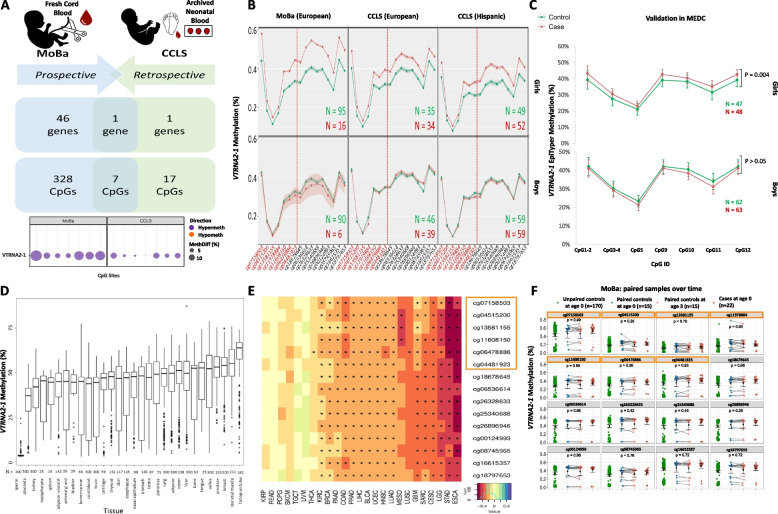
Background: Cancer is the leading cause of disease-related mortality in children. Causes of leukemia, the most common form, are largely unknown. Growing evidence points to an origin in-utero, when global redistribution of DNA methylation occurs driving tissue differentiation.

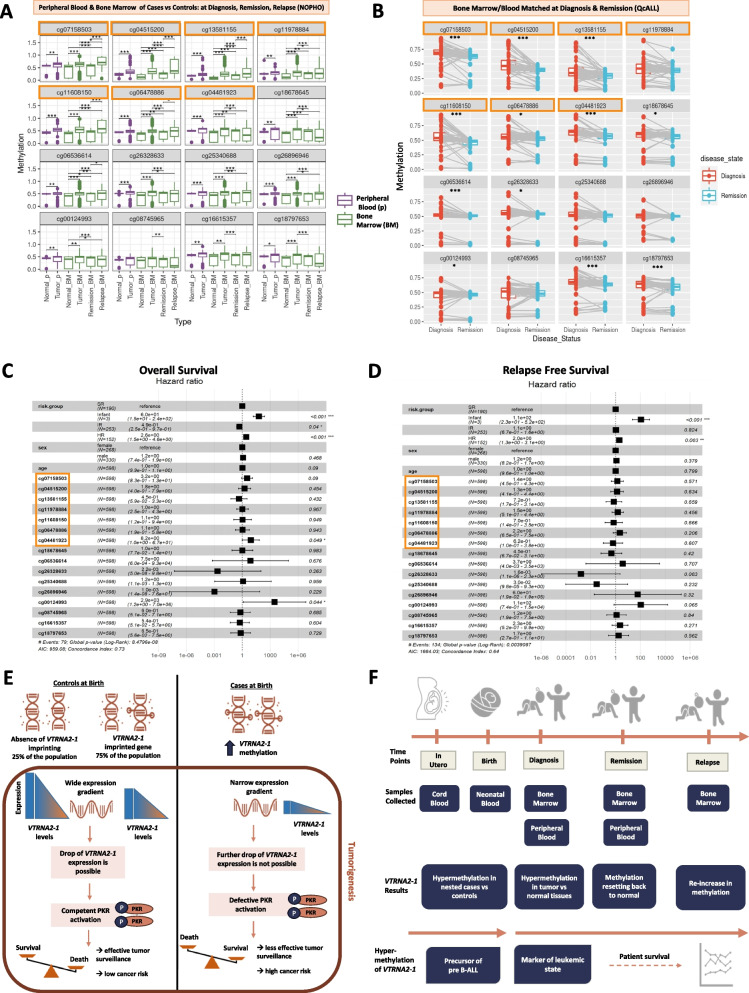
Methods: Epigenome-wide DNA methylation was profiled in surrogate (blood) and target (bone marrow) tissues at birth, diagnosis, remission and relapse of pediatric pre-B acute lymphoblastic leukemia (pre-B ALL) patients. Double-blinded analyses was performed between prospective cohorts extending from birth to diagnosis and retrospective studies backtracking from clinical disease to birth. Validation was carried out using independent technologies and populations.

Results: The imprinted and immuno-modulating VTRNA2-1 was hypermethylated (FDR<0.05) at birth in nested cases relative to controls in all tested populations (totaling 317 cases and 483 controls), including European and Hispanic ancestries. VTRNA2-1 methylation was stable over follow-up years after birth and across surrogate, target and other tissues (n=5,023 tissues; 30 types). When profiled in leukemic tissues from two clinical cohorts (totaling 644 cases), VTRNA2-1 methylation exhibited higher levels at diagnosis relative to controls, it reset back to normal levels at remission, and then re-increased to above control levels at relapse. Hypermethylation was significantly associated with worse pre-B ALL patient survival and with reduced VTRNA2-1 expression (n=2,294 tissues; 26 types), supporting a functional and translational role for VTRNA2-1 methylation.

Conclusion: This study provides proof-of-concept to detect at birth epigenetic precursors of pediatric pre-B ALL. These alterations were reproducible with different technologies, in three continents and in two ethnicities, and can offer biomarkers for early detection and prognosis as well as actionable targets for therapy.

Keywords: VTRNA2-1; Birth cohort; DNA methylation; Epigenetics; Neonatal blood spots; Pediatric leukemia.


Conflict of interest statement

The authors declare no competing interests.

Figures

Fig. 1
Fig. 1
Discovery, validation and functional analysis of VTRNA2-1 methylation in association with pediatric pre-B ALL development. A Upper section: Prioritized differentially methylated genes with at least one CpG with effect size ≥3% after DMR analysis for blood samples taken from newborns of either MoBa or CCLS. 7 CpG sites were significantly enriched (p = 2.2 x 10⁻¹⁶) between MoBa and CCLS relative to the total number of array CpGs analyzed (470,963 CpGs); all CpGs mapped to the same gene, which was also significantly enriched (p = 4.4 x 10⁻³) relative to the total number of genes in the human genome (21,306 genes) (Fisher’s Exact Test). Lower section: The 7 significant CpGs within the DMR of VTRNA2-1 are symbolized in CCLS and MoBa by circles of varying sizes and colors, representing the effect sizes and directions of effect, respectively, as per the figure legend. The 7 CpGs are arranged in order according to their genomic position. The direction of effect is reported for the pre-B ALL nested cases relative to the controls: hypermethylation (Hypermeth) or hypomethylation (Hypometh). B VTRNA2-1 differential methylation in nested cases and controls was stratified by subject sex and ethnicity in MoBa and CCLS cohorts. Data points represent average methylation values at each CpG site, and the ribbons denote the 95% confidence intervals. CpG HM450 IDs are shown on the x-axes. In addition to the CpGs (in red) identified in the Adjusted Models in both MoBa and CCLS, we also show (in black) the additional CpGs identified in the Crude Models in both MoBa and CCLS (detailed in Supplementary Fig. 7 and Supplementary Table 2). C Validation, based on profiling of VTRNA2-1 methylation using EpiTyper, which is sequencing- rather than array-based, applied to an independent set of biological samples from MEDC. Data points represent average methylation values at each CpG site, and the error bars denote the 95% confidence intervals. The p-values indicate the statistical significance across the whole DMR region and were calculated by inverse variance based meta-analysis using METAL software. The DMR profiled by EpiTyper partially overlaps with that by HM450; specifically, CpGs 10 and 11 in (C) are identical to the last two CpGs in (B), cg16615357 and cg18797653, respectively. CpG1-2 and CpG3-4 each represents an average methylation value of two adjacent CpGs, as detected by EpiTyper. The genomic coordinates of the CpG ID numbers are detailed in Supplementary Fig. 8. D Box plots showing the methylation distribution of VTRNA2-1 across a panel of human tissue types using data extracted from the EWAS Open Platform [10]. The box plots encompass the first quartile (bottom border), the median (middle line), the fourth quartile (upper border) and the extreme values (dots). No statistically significant differences (p>0.05; Mann-Whitney test) were detected in VTRNA2-1 mean methylation between the target bone marrow and surrogate cord blood tissues. The sample sizes (N) are indicated for each tissue type. (n=5,023 tissues; 30 types) E Pearson correlation of VTRNA2-1 expression with the methylation of its CpGs in a panel of cancer tissues extracted from the MEXPRESS database [11] (n=2,273 tissues; 25 types). Cancer types and sample sizes are as follows: kidney renal papillary cell carcinoma (KIRP, N = 140), rectum adenocarcinoma (READ, N = 28), pheochromocytoma and paraganglioma (PCPG, N = 66), skin cutaneous carcinoma (SKCM, N = 74), testicular germ cell tumor (TGCT, N = 47), uveal melanoma (UVM, N = 28), thyroid carcinoma (THCA, N = 162) , kidney renal clear cell carcinoma (KIRC, N = 136), breast invasive carcinoma (BRCA, N = 106), pancreatic adenocarcinoma (PAAD, N = 67), colon adenocarcinoma (COAD, N = 95), prostate adenocarcinoma (PRAD, N = 75), liver hepatocellular carcinoma (LIHC, N = 90), bladder urothelial (BLCA, N = 106), uterine corpus endometrial carcinoma (UCEC, N = 121), head and neck squamous cell carcinoma (HNSC, N = 103), lung adenocarcinoma (LUAD, N = 74), mesothelium (MESO, N = 42), lung squamous cell carcinoma (LUSC, N = 44), glioblastoma multiforme (GBM, N = 44), sarcoma (SARC, N = 82), cervical squamous cell carcinoma and endocervical adenocarcinoma (CESC, N = 127), brain lower grade glioma (LGG, N = 96), stomach adenocarcinoma (STAD, N = 217) and esophageal carcinoma (ESCA, N = 103). The asterisk (*) mark significant correlation after adjustment for multiple testing (FDR < 0.05). One CpG (cg11978884) was omitted from the analysis because it had no methylation values. F VTRNA2-1 methylation in MoBa paired samples over time. None of the VTRNA2-1 CpGs were significantly (p>0.05) differentially methylated in cord blood collected from the control subjects at age 0 (blue) versus paired peripheral blood collected from the same controls at age 3 (orange) years (Wilcoxon test). Methylation values at birth from nested unpaired controls (green) and cases (red) are shown as a reference. The y-axes represent the methylation (beta) values, and p values are reported for each CpG. In E-F, the orange rectangles represent CpGs common to Adjusted Models of both MoBa and CCLS. The remaining CpGs are those identified in the Crude Models of both datasets
Fig. 2
Fig. 2
Longitudinal analysis of VTRNA2-1 methylation post-diagnosis and its hypothesized role in pre-B ALL development. A Methylation of VTRNA2-1 CpGs in peripheral blood and bone marrow of cases versus controls at diagnosis, remission and relapse in NOPHO. In purple: Methylation of VTRNA2-1 CpGs in peripheral blood samples from sorted B-cells of normal subjects (N=26) and from pediatric pre-B ALL patients collected at diagnosis (n=74) from NOPHO. In green: Methylation of VTRNA2-1 CpGs in sorted B-cells (N=26) from bone marrow of fetuses (N=8) and in bone marrow samples from cases of pediatric pre-B ALL collected at diagnosis (n=535), remission (n=82) and relapse (n=32) from NOPHO. Whiskers represent the minimum and the maximum, while the top, the bottom, and the band in the box represent the first and third quartile and the median respectively. Significant differences between methylation of normal and tumor samples are marked for each CpG with an asterisk (Wilcoxon test). B Methylation of VTRNA2-1 CpGs in 46 pediatric pre-B ALL samples collected at diagnosis (red) and remission (blue) from the same patients in QcALL. Significant differences between methylation at diagnosis and remission are marked for each CpG with an asterisk (Wilcoxon test). The data are represented in the form of a dot plot to better visualize the paired samples (a line links each pair). Red and blue box plots are also shown for each time point (diagnosis and remission, respectively), representing the first quartile (bottom border), the median (middle line) and the fourth quartile (upper border) for each condition. C and D Methylation of VTRNA2-1 CpGs in relation to overall and relapse-free survival, respectively, represented by hazard ratios. In NOPHO, 598 pre-B ALL patients were followed up for ten years or more. VTRNA2-1 methylation at two CpG sites significantly affected overall survival (denoted by *, Wald test), after adjusting for patient sex, age and risk groups using a Multivariate Cox Regression model. Risk group variables also affected overall and relapse-free survival (denoted by ** or ***, Wald test). HR: high risk, IR: intermediate risk and SR: standard risk. * denotes p<0.05, ** denotes p<0.01, *** denotes p<0.001. In A-D, the orange rectangles represent CpGs common to Adjusted Models of both MoBa and CCLS. The remaining CpGs are those identified in the Crude Models of both datasets. E The tumor surveillance model offering a biologically plausible mechanism of VTRNA2-1 in pediatric pre-B ALL development. The basal methylation and expression level of VTRNA2-1 determines the degree of gradients (narrow: RIGHT versus wide: LEFT), which is important to shift the balance from cell survival (RIGHT) to cell death (LEFT) via PKR activation. Graphic icons used to construct the figure were retrieved from thenounproject.com. F Summary of the study’s time points, sample types, and VTRNA2-1 results

References

    1. Steliarova-Foucher E, Colombet M, Ries LAG, Moreno F, Dolya A, Bray F, et al. International incidence of childhood cancer, 2001–10: a population-based registry study. Lancet Oncol. 2017;18(6):719–31. - PMC - PubMed
    1. Hunger SP, Mullighan CG. Acute lymphoblastic leukemia in children. N Engl J Med. 2015;373(16):1541–52. - PubMed
    1. Erdmann F, Ghantous A, Schüz J. Environmental agents and childhood cancer. In: Nriagu J, editor. Encyclopedia of Environmental Health. 2nd ed. Burlington: Elsevier B.V.; 2019. p. 336–47. https://scholar.google.com/scholar_lookup?title=Encyclopedia+of+Environm....
    1. Ghantous A, Hernandez-Vargas H, Byrnes G, Dwyer T, Herceg Z. Characterising the epigenome as a key component of the fetal exposome in evaluating in utero exposures and childhood cancer risk. Mutagenesis. 2015;30(6):733–42. - PMC - PubMed
    1. Gröbner SN, Worst BC, Weischenfeldt J, Buchhalter I, Kleinheinz K, Rudneva VA, et al. The landscape of genomic alterations across childhood cancers. Nature. 2018;555(7696):321–7. - PubMed

Substances