. 2024 Oct 23;21(1):272.
doi: 10.1186/s12974-024-03247-9.

Impairment of spinal CSF flow precedes immune cell infiltration in an active EAE model

Affiliations

Impairment of spinal CSF flow precedes immune cell infiltration in an active EAE model

Li Xin et al. J Neuroinflammation. .

Abstract

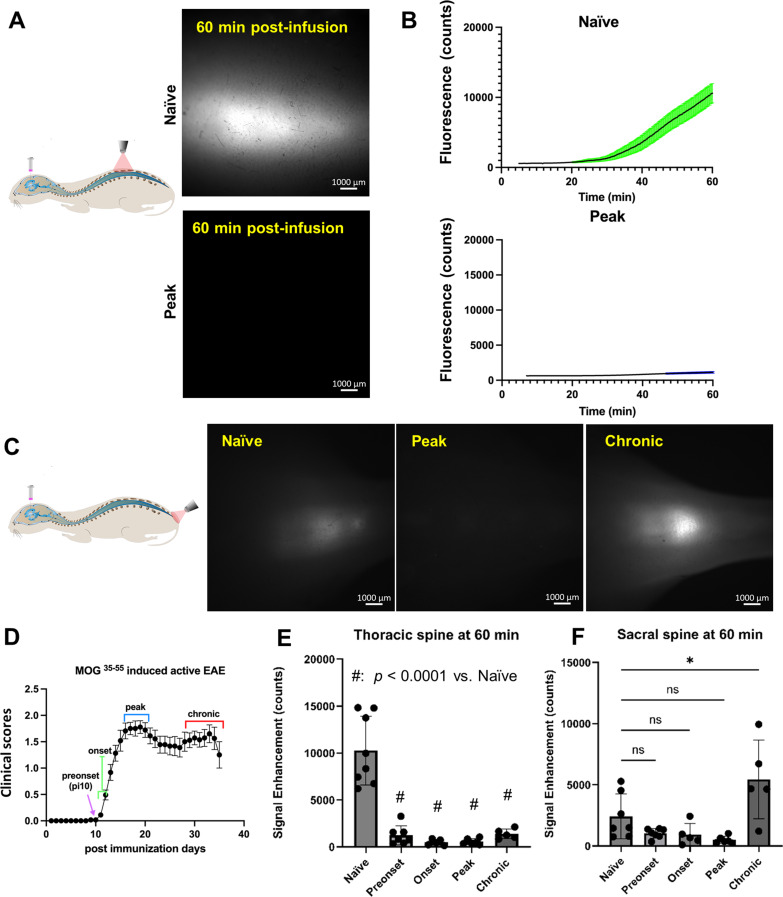
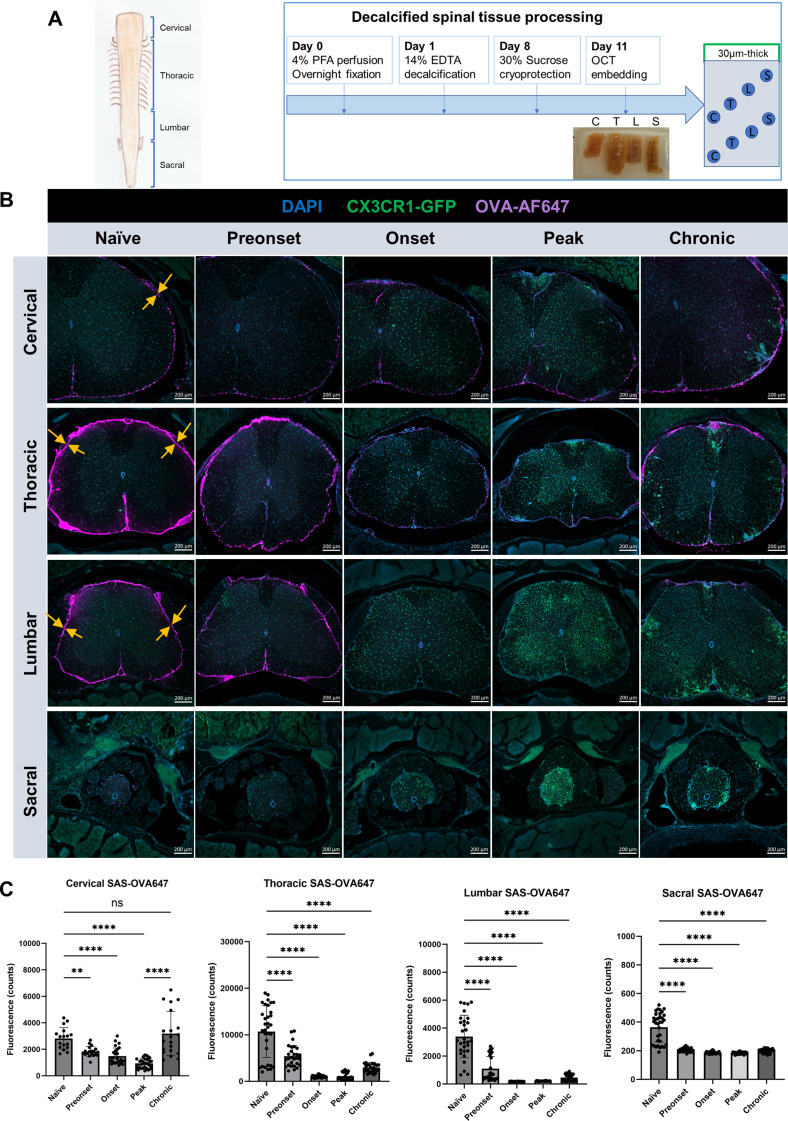
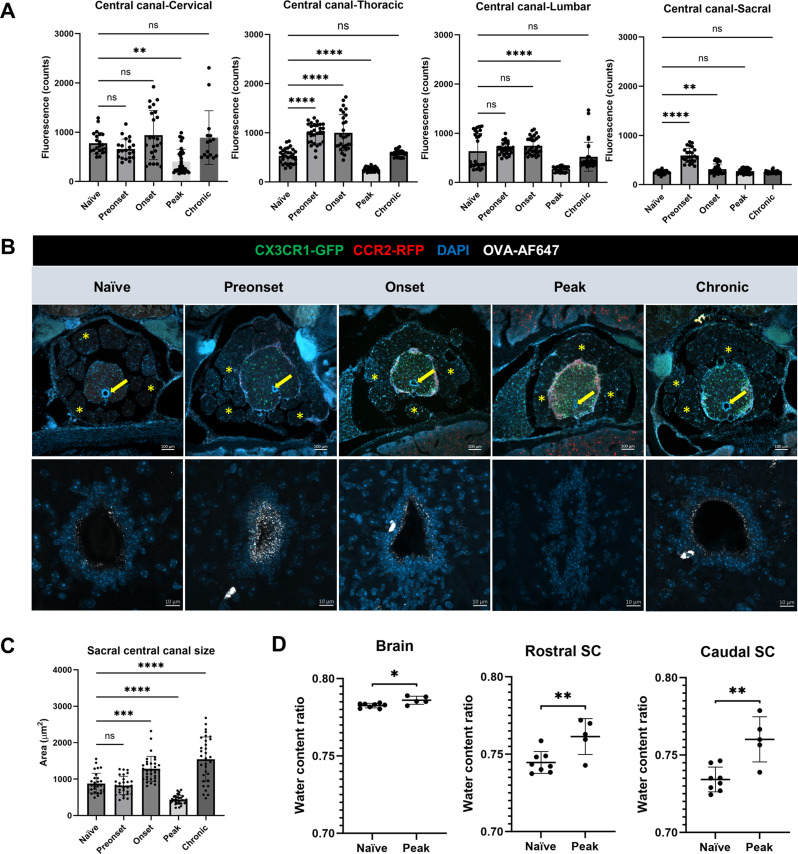
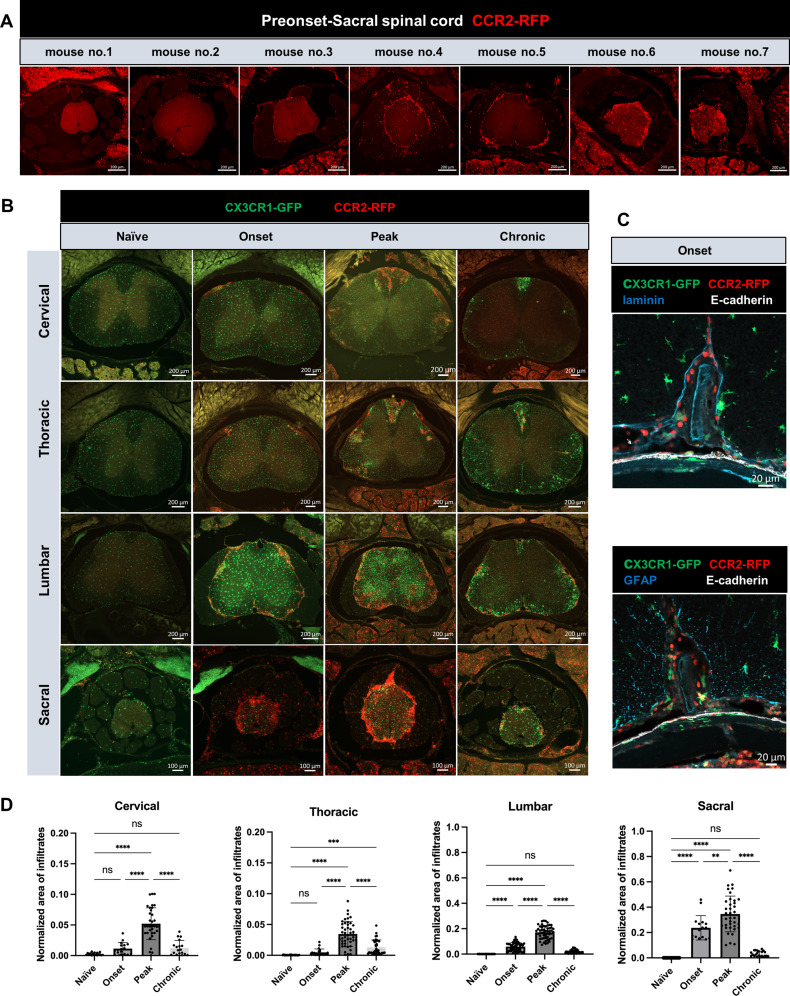
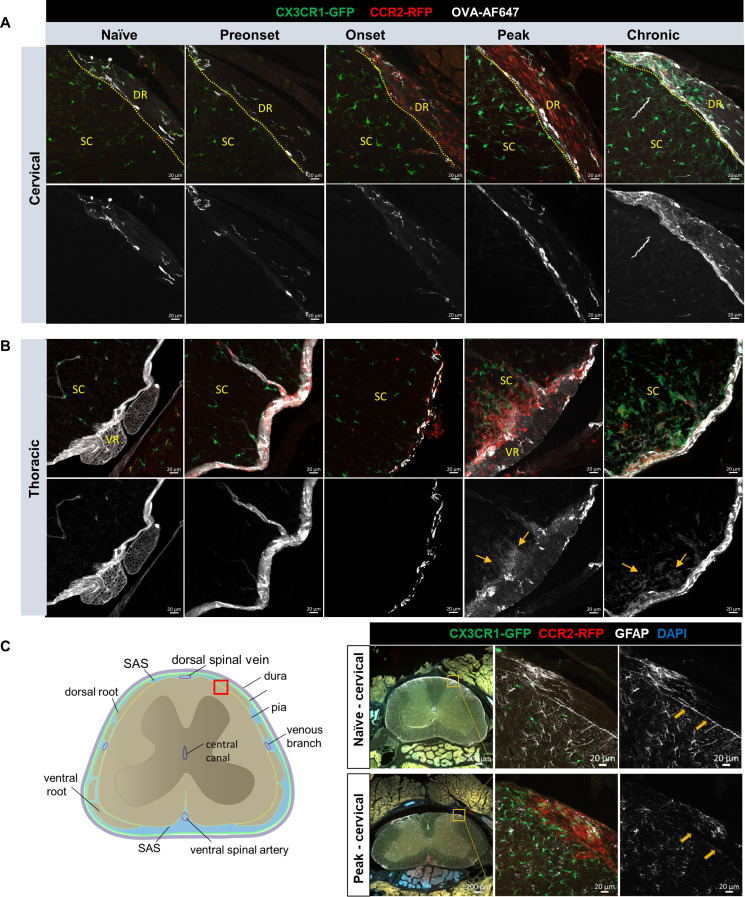
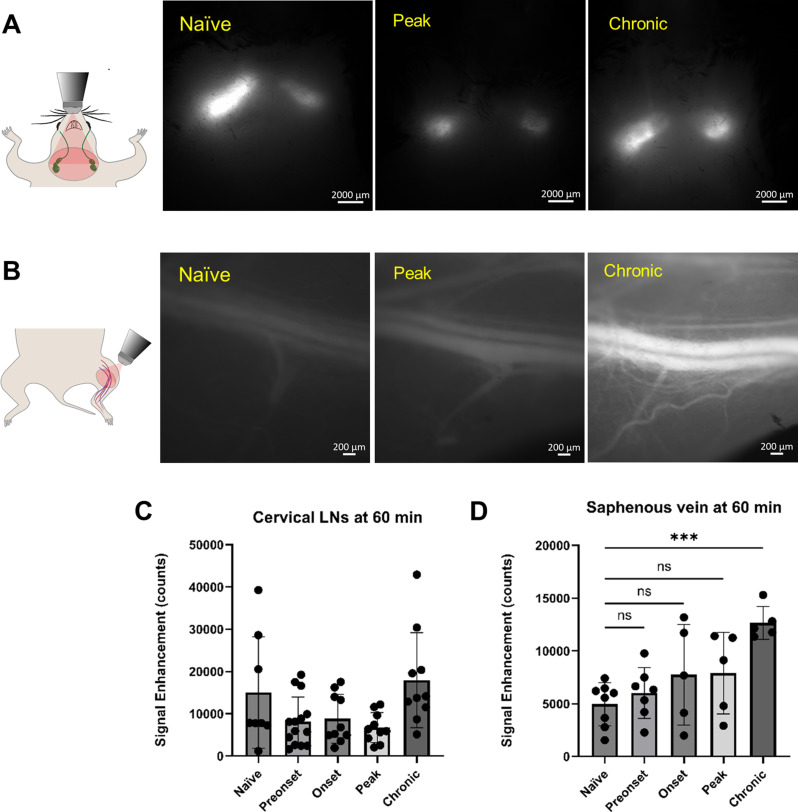
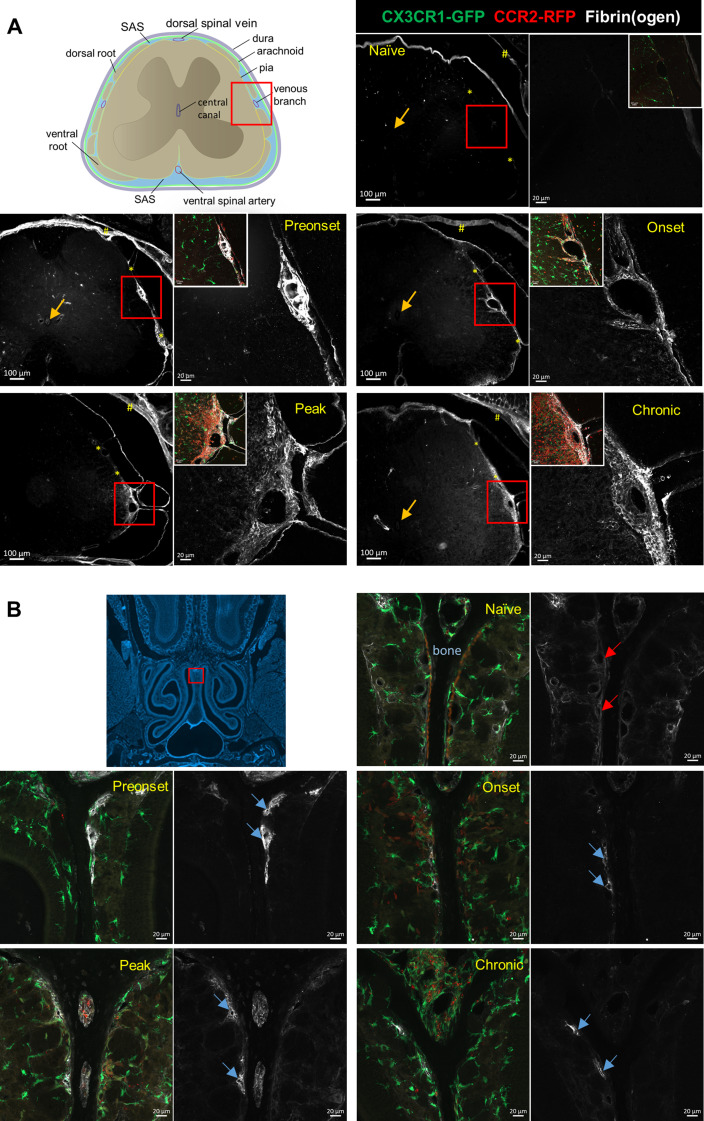
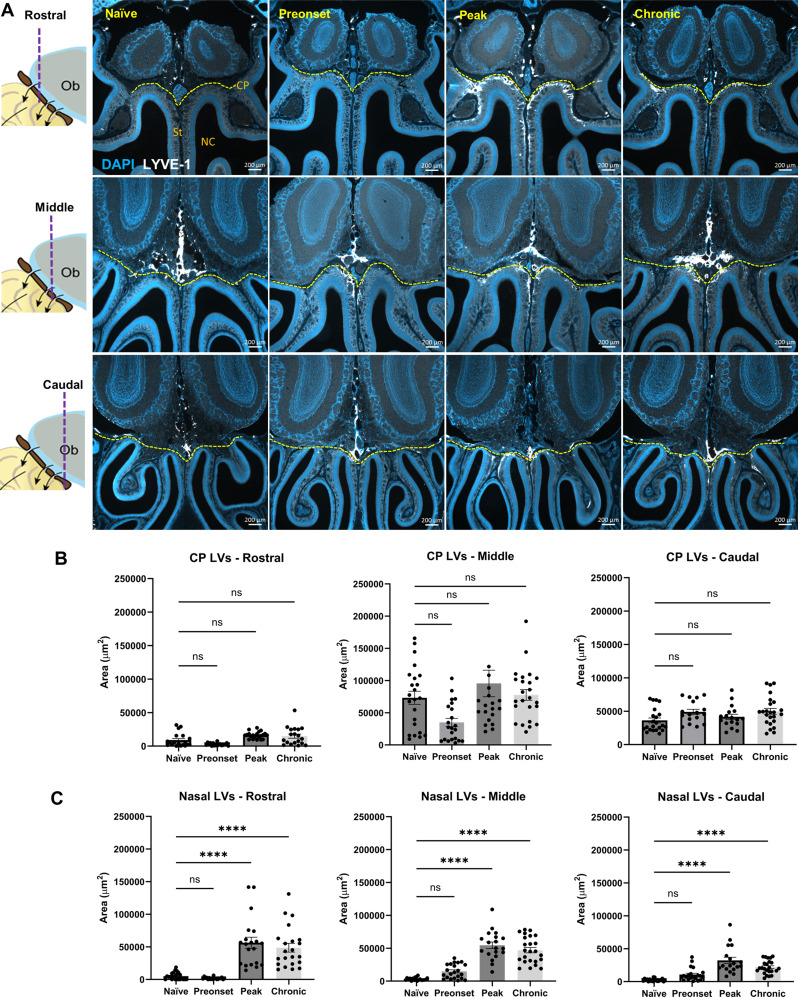
Accumulation of immune cells and proteins in the subarachnoid space (SAS) is found during multiple sclerosis and in the animal model experimental autoimmune encephalomyelitis (EAE). Whether the flow of cerebrospinal fluid (CSF) along the SAS of the spinal cord is impacted is yet unknown. Combining intravital near-infrared (NIR) imaging with histopathological analyses, we observed a significantly impaired bulk flow of CSF tracers within the SAS of the spinal cord prior to EAE onset, which persisted until peak stage and was only partially recovered during chronic disease. The impairment of spinal CSF flow coincided with the appearance of fibrin aggregates in the SAS, however, it preceded immune cell infiltration and breakdown of the glia limitans superficialis. Conversely, cranial CSF efflux to cervical lymph nodes was not altered during the disease course. Our study highlights an early and persistent impairment of spinal CSF flow and suggests it as a sensitive imaging biomarker for pathological changes within the leptomeninges.

Keywords: CSF flow; Cerebrospinal fluid; Experimental autoimmune encephalomyelitis; Glia limitans; Multiple sclerosis; Neuroinflammation; Subarachnoid space.


Conflict of interest statement

The authors declare no competing interests.

Figures

Fig. 1
Fig. 1
Impaired CSF flow along the spinal cord in EAE mice. (A) Representative images of P40D800 tracer within the thoracic spine at 60 min post-i.c.v infusion into naïve mice and mice of EAE peak stage showing impaired CSF flow at peak EAE. (B) P40D800 tracer fluorescence intensity counts within the thoracic spine plotted against post-infusion time in naïve and EAE peak groups (n = 8 naïve, n = 6 peak). (C) Representative pictures of P40D800 tracer within the sacral region of the spine 60 min post i.c.v-infusion. (D) Average clinical scores of active EAE mice (n = 29 mice) illustrating the time-points evaluated during EAE development. (E) Quantification of fluorescence signal enhancement in the thoracic region at 60 min post-i.c.v infusion. Data are presented as mean ± SD (n = 8 naïve, n = 7 preonset, n = 5 onset, n = 6 peak, n = 5 chronic mice). (F) Quantification of fluorescence signal enhancement in the sacral region (n = 7 naïve, n = 7 preonset, n = 5 onset, n = 6 peak, n = 5 chronic mice). Statistics with one-way ANOVA with Dunnett’s post hoc test (ns, no statistical difference; *, p < 0.1)
Fig. 2
Fig. 2
Assessments of OVA-AF647 signals in decalcified spinal columns confirm CSF flow impairment. (A) Schematics of spinal cord segments (left) and decalcification protocol with tissue processing (right). Decalcified spinal column was cut into four segments (C: cervical, T: thoracic, L: lumbar, S: sacral) and further into 30 μm cryosections. (B) Representative overview images of OVA-AF647 distribution in the SAS of spinal cord of naïve and EAE mice at preonset, onset, peak and chronic stages. Opposing arrows mark the interface between nerve roots and the spinal cord parenchyma. Scale bars: 200 μm. (C) Quantification of OVA-AF647 signal in the SAS of each spinal cord segment (one-way ANOVA with Dunnett’s post hoc test., ns, no significant difference; **, p < 0.01; ****, p < 0.0001)
Fig. 3
Fig. 3
CSF flow along the central canal fluctuates during EAE development. (A) Quantification of OVA-AF647 distribution inside the central canal (data are pooled from 3 animals per condition). (B) Upper panel, overview of the sacral spinal cords exhibiting signs of edema (merged nerve roots) at EAE peak (asterisk: nerve roots, arrow: central canal). Lower panel, confocal images of sacral spinal cords show OVA-AF647 distribution on the wall of central canal. At EAE peak, no OVA-AF647 signal is visible and central canal appears collapsed. Scale bars: 100 μm (upper panels), 10 μm (lower pannels). (C) Quantification of the size of central canal. (D) Quantification of the water content ratio (n = 8 naïve brain, rostral SC and caudal SC., n = 5 peak brain, rostral SC and caudal SC). SC, spinal cord. Statistics with one-way ANOVA with Dunnett’s post hoc test (ns, no statistical difference; *, p < 0.1, **, p < 0.01; ***, p < 0.001; ****, p < 0.0001)
Fig. 4
Fig. 4
Caudal-rostral development of CCR2+ infiltrates during EAE. (A) Representative overview images of sacral spinal cord showing varying degrees of CCR2+ infiltrates in 7 mice from preonset group. Scale bars: 200 μm. (B) CCR2+ cell distribution on each of the four segments of spinal cord of naïve, onset, peak and chronic EAE mice. (C) Confocal images of lumbar spinal cord with Laminin/E-cadherin and GFAP/E-cadherin co-immunostaining showing CCR2+ infiltrates first appear in the SAS of the spinal cord. (D) Quantification of CCR2+ cells covered area normalized to the area of each spinal cord section. Each data point is one measurement of one image for a specific spinal cord segment. Data are pooled from 3–6 mice per experimental group, presented as mean ± SD (one-way ANOVA with Dunnett’s post hoc test, ns, no significant difference; **, p < 0.01; ***, p < 0.001; ****, p < 0.0001)
Fig. 5
Fig. 5
OVA-AF647 tracer not found in the spinal cord parenchyma at early stage of EAE. (A) Confocal images of OVA-AF647 distribution on the dorsal aspect of cervical spinal cords, where OVA-AF647 tracer signals are seeing at the interface (dotted line) between dorsal root (DR) and spinal cord (SC), but no obvious OVA-AF647 is visible in the parenchyma of spinal cord, except for occasional perivascular distribution, e.g. at chronic stage. Scale bars: 20 μm (B) Confocal images of OVA-AF647 distribution on the ventral aspect of thoracic spinal cords. In naïve, preonset and onset groups, OVA-AF647 signals are mostly found on the surface of the spinal cord, and in perivascular spaces, but not inside the parenchyma. From the mouse at EAE peak and chronic stage, clear signals of OVA-AF647 are found inside the parenchyma, where abundant CCR2+ infiltrates are also found. Scale bars: 20 μm (C) Representative images of GFAP staining from cervical spinal cord show continuous (naïve) and discontinuous GFAP immunoreactivities (arrows, peak EAE) at the interface between the spinal cord parenchyma and dorsal roots (red box on the schematic)
Fig. 6
Fig. 6
CSF tracer clearance to superficial cervical lymph nodes (scLNs) and the systemic circulation is maintained during EAE. (A) Schematic and representative picture of P40D800 tracer within the scLNs at 60 min post i.c.v-infusion. (B) Schematic and representative pictures of P40D800 tracer within the saphenous vein 60 min post i.c.v-infusion. (C) Quantification of fluorescence signal enhancement of P40D800 tracer within the scLNs, no statistical differences are found as compared to naïve group (signals from left and right scLNs are pooled together). (D) Quantification of fluorescence signal enhancement of P40D800 tracer within the saphenous vein. Statistics with one-way ANOVA with Dunnett’s post hoc test, no significant difference; ***, p < 0.001
Fig. 7
Fig. 7
Fibrin(ogen) detected in spinal leptomeninges prior to EAE disease onset and the entire disease course. (A) Fibrin(ogen) staining is positive around the lateral venous branch and at the interface (*) between the spinal cord parenchyma and dorsal roots of mice in all conditions, except for the naïve mice. Note that dura mater (#) shows positive fibrin(ogen) staining due to fenestrated blood vessels inside dura mater. For each condition, left panel shows an overview picture and right panel shows the confocal picture of area inside the red boxes. Inserts on the right panels are overlay pictures of the same region. Arrows mark negative fibrinogen staining inside the central canal in all conditions. (B) Positive fibrin(ogen) immunoreactivies are seen in the lumen of vessels (blue arrows) against the nasal septum bone (dark area between the orange lines shown in naïve condition) in all EAE conditions, but not in Naïve condition (red arrows). Scale bars: 20 μm
Fig. 8
Fig. 8
Significantly enlarged LYVE-1+ lymphatic vessel covered area. (A) Schematics on the left showing the rostral, middle and caudal olfactory bulb (Ob) region that representative images of LYVE-1 and DAPI staining on decalcified coronal sections for each experimental group were taken. Yellow dashed line marks the location of cribriform plate (CP). St, septum., NC, nasal cavity. (B) Quantification of LYVE-1+ area above/through the cribriform plate (CP-LVs) at rostral, middle and caudal olfactory region. (C) Quantification of LYVE-1+ area below the cribriform plate (Nasal-LVs) at rostral, middle and caudal olfactory region. Data are pooled from 3 mice per experimental group, presented as mean ± SD (one-way ANOVA with Dunnett’s post hoc test; ns, no significant difference; ****, p < 0.0001)

Similar articles

Cited by

References

    1. Trapp BD, Nave KA. Multiple sclerosis: an immune or neurodegenerative disorder? Annu Rev Neurosci. 2008;31:247–69. - PubMed
    1. Magliozzi R, Howell O, Vora A, Serafini B, Nicholas R, Puopolo M, Reynolds R, Aloisi F. Meningeal B-cell follicles in secondary progressive multiple sclerosis associate with early onset of disease and severe cortical pathology. Brain. 2007;130:1089–104. - PubMed
    1. Serafini B, Rosicarelli B, Magliozzi R, Stigliano E, Aloisi F. Detection of ectopic B-cell follicles with germinal centers in the meninges of patients with secondary progressive multiple sclerosis. Brain Pathol. 2004;14:164–74. - PMC - PubMed
    1. Howell OW, Reeves CA, Nicholas R, Carassiti D, Radotra B, Gentleman SM, Serafini B, Aloisi F, Roncaroli F, Magliozzi R, Reynolds R. Meningeal inflammation is widespread and linked to cortical pathology in multiple sclerosis. Brain. 2011;134:2755–71. - PubMed
    1. Magliozzi R, Howell OW, Calabrese M, Reynolds R. Meningeal inflammation as a driver of cortical grey matter pathology and clinical progression in multiple sclerosis. Nat Rev Neurol. 2023;19:461–76. - PubMed

MeSH terms

Substances