. 2025 Jan;14(2):e2401939.
doi: 10.1002/adhm.202401939. Epub 2024 Oct 23.

Humanized In Vivo Bone Tissue Engineering: In Vitro Preculture Conditions Control the Structural, Cellular, and Matrix Composition of Humanized Bone Organs

Affiliations

Humanized In Vivo Bone Tissue Engineering: In Vitro Preculture Conditions Control the Structural, Cellular, and Matrix Composition of Humanized Bone Organs

Agathe Bessot et al. Adv Healthc Mater. 2025 Jan.

Abstract

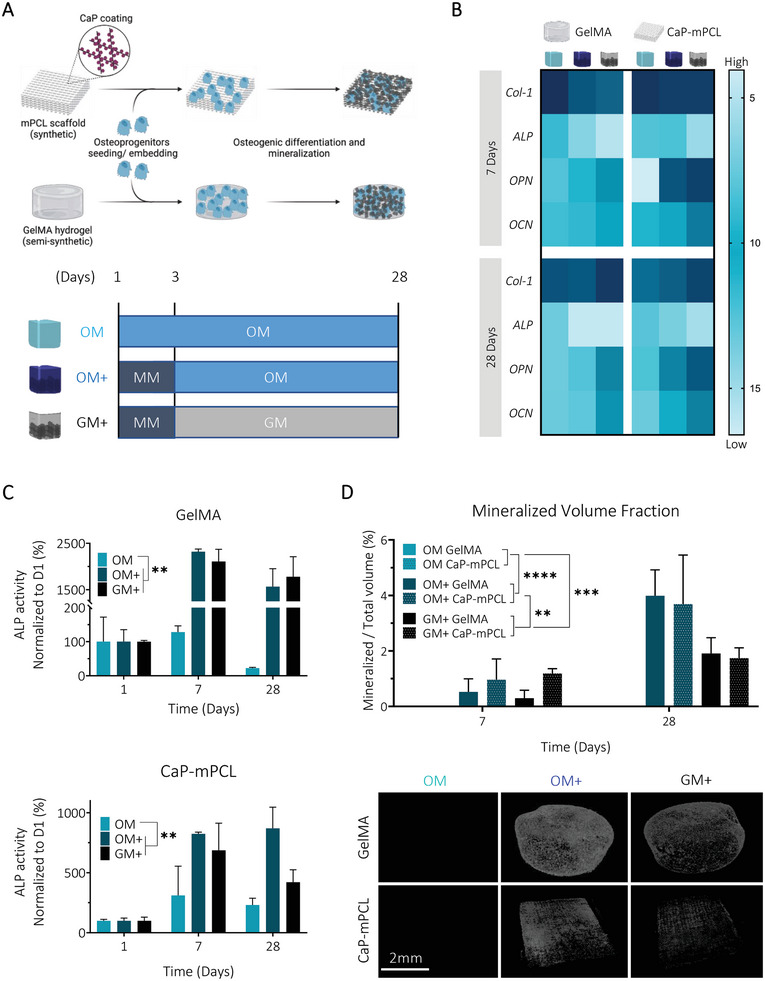
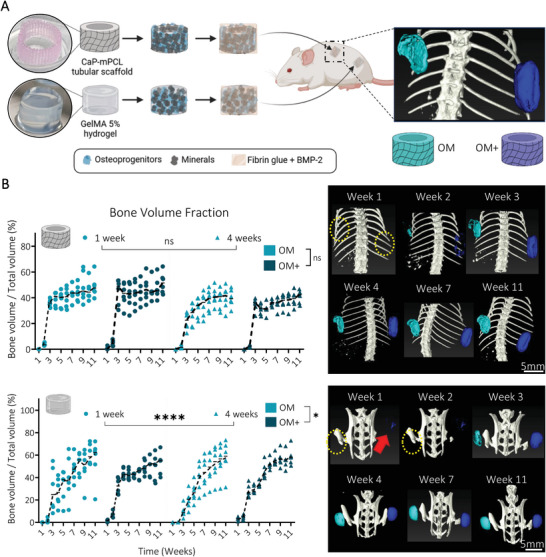
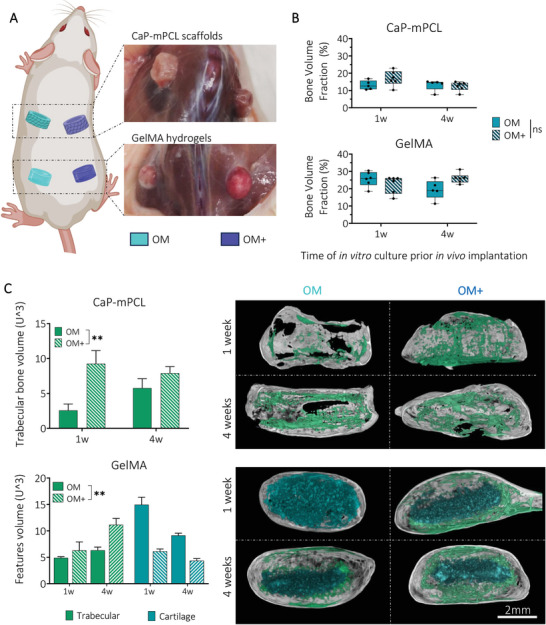
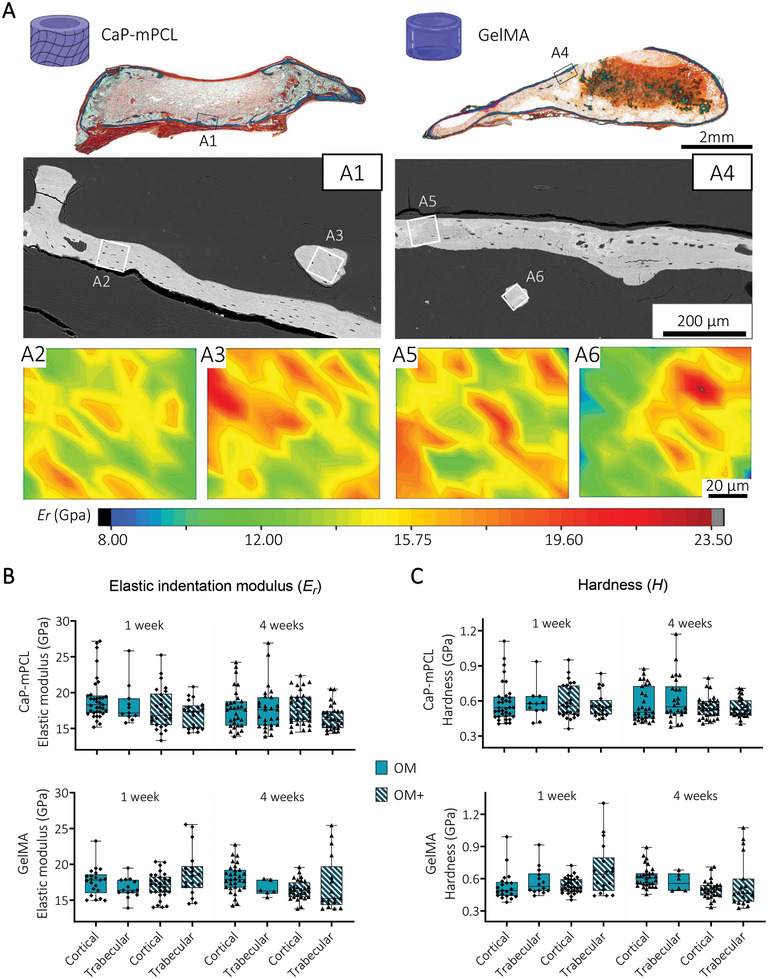
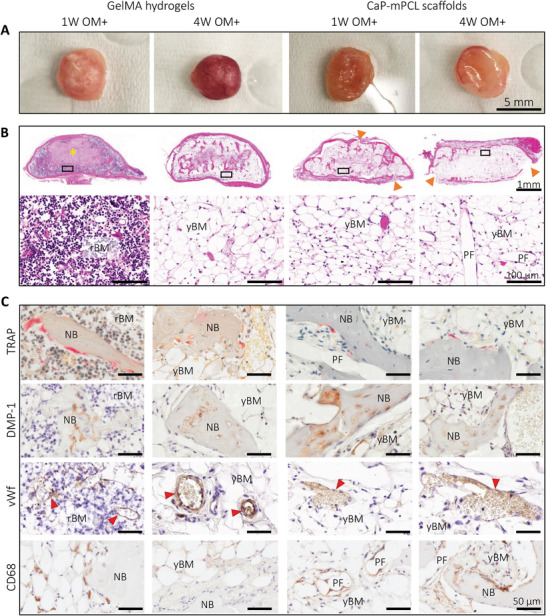
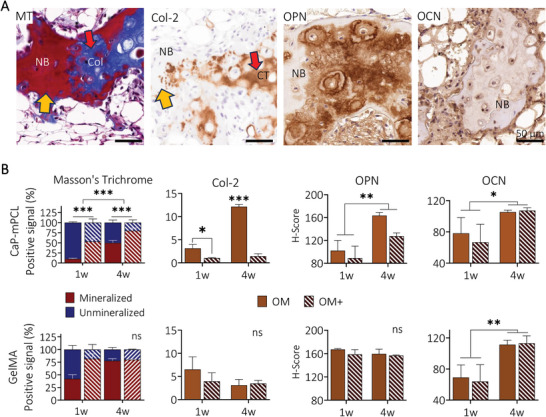
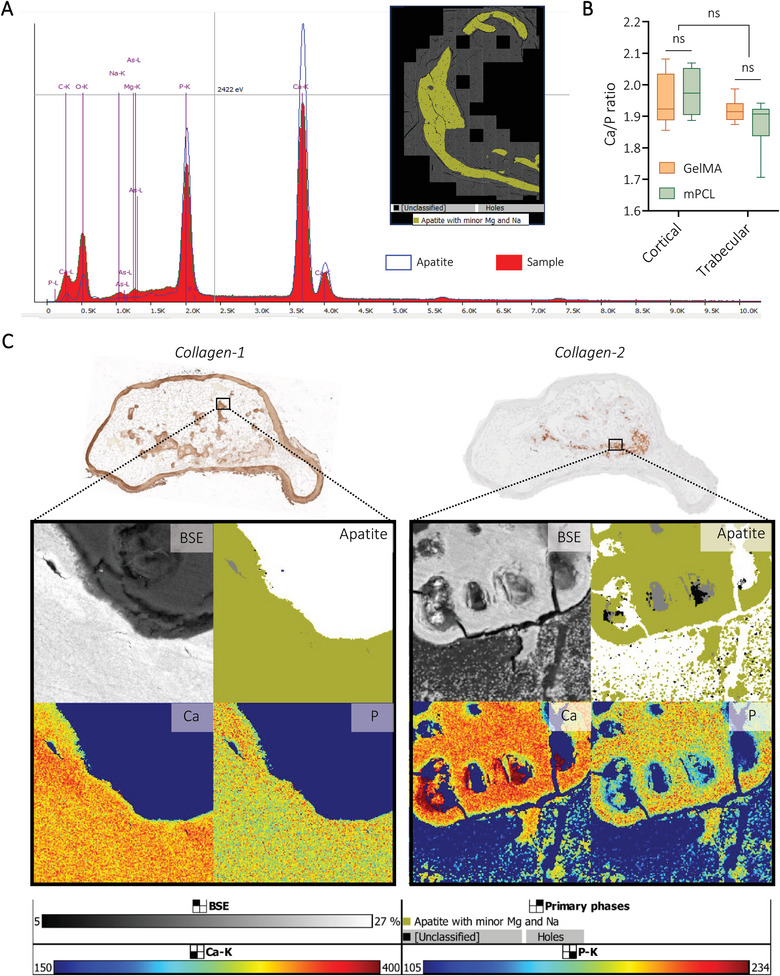
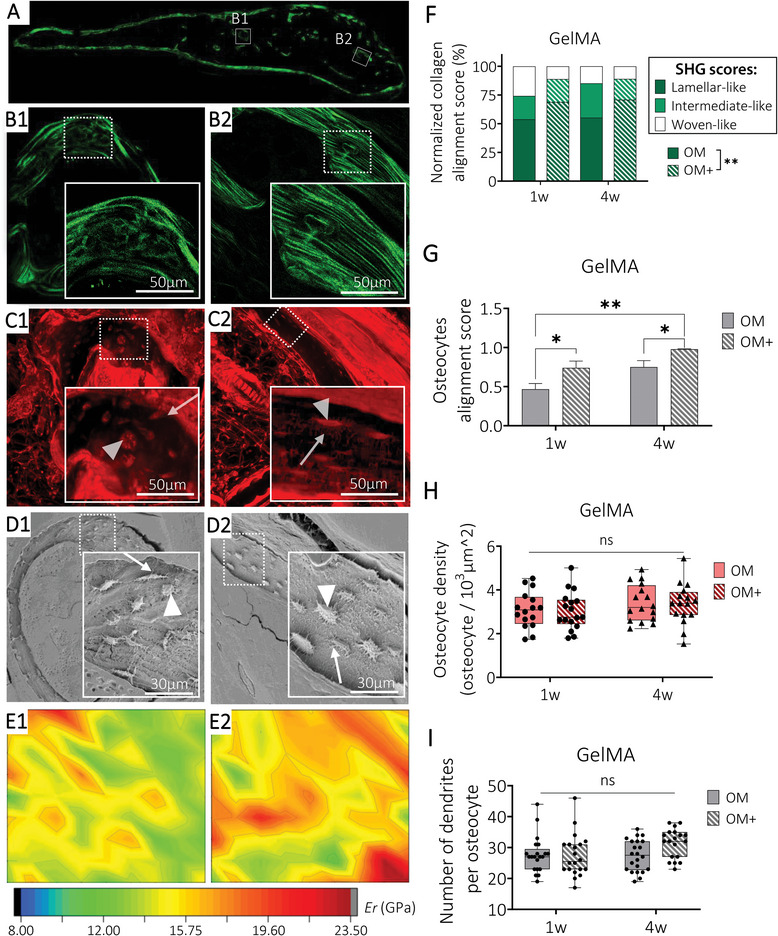
Bone tissue engineering (BTE) has long sought to elucidate the key factors controlling human/humanized bone formation for regenerative medicine and disease modeling applications, yet with no definitive answers due to the high number and co-dependency of parameters. This study aims to clarify the relative impacts of in vitro biomimetic 'preculture composition' and 'preculture duration' before in vivo implantation as key criteria for the optimization of BTE design. These parameters are directly related to in vitro osteogenic differentiation (OD) and mineralization and are being investigated across different osteoprogenitor-loaded biomaterials, specifically fibrous calcium phosphate-polycaprolactone (CaP-mPCL) scaffolds and gelatin methacryloyl (GelMA) hydrogels. The results show that OD and mineralization levels prior to implantation, enhanced by a mineralization medium supplement to the osteogenic medium (OM), significantly improve ectopic BTE outcomes, regardless of the biomaterial type. Specifically, preculture conditions are pivotal in achieving more faithful mimicry of human bone structure, cellular and extracellular matrix composition and organization, and provide control over bone marrow composition. This work emphasizes the potential of using biomimetic culture compositions, specifically the addition of a mineralization medium as a cost-effective and straightforward approach to enhance BTE outcomes, facilitating rapid development of bone models with superior quality and resemblance to native bone.

Keywords: bone structure; bone tissue engineering (BTE); extracellular matrix; humanized mouse model; in vivo bone model; mineralization; osteogenic differentiation (OD).


Conflict of interest statement

D.W.H. is a co‐founder and shareholder of GELOMICS PTY LTD, a Brisbane‐based company developing and distributing hydrogels for 3D cell culture applications. All other authors declare no competing interests.

Figures

Figure 1
Figure 1
Osteogenic culture medium combined with an initial mineralization medium treatment leads to higher mineralization and osteogenesis in both biomaterial groups (CaP‐mPCL and GelMA). A) Schematic of the experimental design. Primary human osteoprogenitors were seeded on CaP‐mPCL scaffolds or embedded in GelMA 5% w/v hydrogels and were cultured for up to 28 days in OM or in mineralization medium for three days followed by osteogenic medium (OM+) or growth medium (GM+). B) Mean ΔCq heatmap from RTqPCR analysis, normalized to the geomean of 7SL and RPL32 housekeeping genes. Light blue represents lower mRNA expression (i.e., higher ΔCq) and dark blue represents higher mRNA expression (i.e. lower ΔCq). C) Alkaline phosphatase activity, normalized to DNA content and to day one. D) Representative images of microcomputed tomography after four weeks of culture and quantification of the mineralized volume fraction. Graphs: Mean + SD, n = 3, General Linear Model (Univariate), **p < 0.01, ***p < 0.001, ****p < 0.0001.
Figure 2
Figure 2
In vivo mineralization of the ectopically formed bone organ from semi‐synthetic GelMA hydrogels was significantly affected by biomimetic culture composition and preculture duration. A) Experimental design: CaP‐mPCL scaffolds and GelMA 5% hydrogels loaded with primary human osteoprogenitors and cultured for four weeks in OM or OM+ prior subcutaneous implantation into immunodeficient mice. B) Quantification and representative images of in vivo mineralization from µCT analyses. Yellow circles represent the location of undetectable implants, red arrow indicates the GelMA OM+ mineralized implants. Median plots with data points and trend line, n = 6, General Linear Model (Univariate), ns: not significant, *p < 0.05, ****p < 0.001.
Figure 3
Figure 3
OM+ biomimetic culture leads to similar mineralized bone volume fraction, yet higher trabecular network formation in vivo compared to OM culture. A) After 11 weeks in vivo, mineralized tissues were collected and B) analyzed using µCT. Boxplots, min to max with all data points, n = 6, General Linear Model (Univariate), ns = not significant. C) Quantification and representative images of trabecular and cartilage ossifications from µCT reconstructed images. Bar plots, mean ± SE, n = 6, **p < 0.01.
Figure 4
Figure 4
Local mechanical properties of cortical and trabecular bone are similar between bioengineered mineralized tissues. A) Goldner's trichrome staining and BSE images of GelMA and CaP‐mPCL bioengineered mineralized tissues (OM+, 4 weeks preculture represented here) were used to select region of interest (ROI) from cortical (A2, A5) and trabecular (A3, A6) bone for local indentation elastic modulus (Er ) mapping (2D contour maps, color scale representing Er values). B) Quantification of Er and C hardness (H) from cortical and trabecular regions of the bioengineered bones using depth‐sensing nanoindentation. Box plots (min to max with data points), n = 3, average of 15 regions of interest per sample, General Linear Model (Univariate). No significance found (p>0.05).
Figure 5
Figure 5
Characterization of the bone cellular matrix from ex vivo samples precultured in OM+ biomimetic culture. A) Macroscopic images of collected explants after 11 weeks of culture in vivo. B) Histology analyses using H&E staining to characterize tissues morphology, ossification and marrow content, with overview (top) and high magnification (bottom). Yellow star: GelMA hydrogel, orange arrows: depleted cortical shell. C) IHC analyses were used to detect osteoclasts (tartrate‐resistant acid phosphatase (TRAP)), osteocytes and chondrocytes (dentin matrix acidic phosphoprotein 1 (DMP‐1)), vascularization (von Willebrand factor (vWf), red arrows) and macrophages (cluster of differentiation (CD68)) using their respective markers. NB: new bone, rBM: red bone marrow, yBM: yellow bone marrow, FT: fibrous tissue, PF: CaP‐mPCL fibers.
Figure 6
Figure 6
Characterization of bone ossification and extracellular matrix deposition from ex vivo samples. A) Representative images of MT, collagen type 2 (Col‐2) (yellow arrows: mature bone, red arrows: unmineralized collagen deposition, sample: GelMA‐derived sample cultured in OM+ for one week), and the key bone proteins osteopontin (OPN) and osteocalcin (OCN) from GelMA‐derived samples cultured in OM+ for four weeks prior to in vivo implantation. B) Quantification of MT, collagen type 2, osteopontin and osteocalcin from ex vivo samples. Bar plots with mean ± SE, n = 3 biological replicates per staining. General Linear Model (Univariate), ns: not significant, *p < 0.05, **p < 0.01 ***p < 0.001. NB: new bone, Col: unmineralized collagen, CT: cartilage tissue.
Figure 7
Figure 7
Application of TIMA analyses to determine mineral composition of bioengineered bone tissues. A) Spectra of apatite with minor levels of magnesium and sodium detected using TIMA. B) Quantification of Ca/P ratio using EDS analyses from Tescan MIRA. Box plots (Mean with min to max), n = 3, General Linear Model (Univariate), ns = not significant. C) Representative images of explants (GelMA‐derived, precultured for four weeks prior to 11 weeks in vivo) showing the correlation between ECM composition (IHC) and mineralization levels (BSE) with apatite, calcium (Ca), and phosphate (P) distribution.
Figure 8
Figure 8
Collagen fibers organization and their relationship with osteocyte LCN and mechanical properties. Representative ROI images from GelMA bioengineered humanized bone with one week of preculture in OM+ condition of A‐B) second harmonic generation imaging collagen fibers, C) laser confocal scanning microscopy imaging LCN from rhodamine‐stained samples and D) Scanning electron microscopy of acid etched samples detecting osteocytes embedded in the mineralized matrix. Osteocyte body indicated by arrowheads (Δ) and canaliculi indicated by arrows (↗). E) Indentation elastic modulus maps of the corresponding ROIs. Semi‐quantification of F) collagen alignment score classified into woven‐like (B1), intermediate and lamellar‐like (B2) arrangement (mean, n = 3 sample per group), G) osteocytes alignment score (mean ± SE, n = 10 ROIs with a total of 190 cells analyzed per condition), H) osteocyte density and I) number of dendrites per osteocytes (box plots, min‐max, n = 15‐20 ROIs per condition). General Linear Model (Univariate), ns = not significant, *p < 0.05, **p < 0.01.

Similar articles

References

    1. Scott M. A., Levi B., Askarinam A., Nguyen A., Rackohn T., Ting K., Soo C., James A. W., Stem Cells Dev. 2012, 21, 655. - PMC - PubMed
    1. Xu C., Liu Z., Chen X., Gao Y., Wang W., Zhuang X., Zhang H., Dong X., Chin. Chem. Lett. 2024, 35, 109197.
    1. Qi J., Yu T., Hu B., Wu H., Ouyang H., Int. J. Mol. Sci. 2021, 22, 10233. - PMC - PubMed
    1. Pina S., Ribeiro V. P., Marques C. F., Maia F. R., Silva T. H., Reis R. L., Oliveira J. M., Materials 2019, 12, 1824. - PMC - PubMed
    1. Qu H., Fu H., Han Z., Sun Y., RSC Adv. 2019, 9, 26252. - PMC - PubMed

LinkOut - more resources