. 2024 Oct 23;56(12):1761-1773.
doi: 10.3724/abbs.2024191.

Tim-1-mediated extracellular matrix promotes the development of hepatocellular carcinoma

Affiliations

Tim-1-mediated extracellular matrix promotes the development of hepatocellular carcinoma

Ruheng Hua et al. Acta Biochim Biophys Sin (Shanghai). .

Abstract

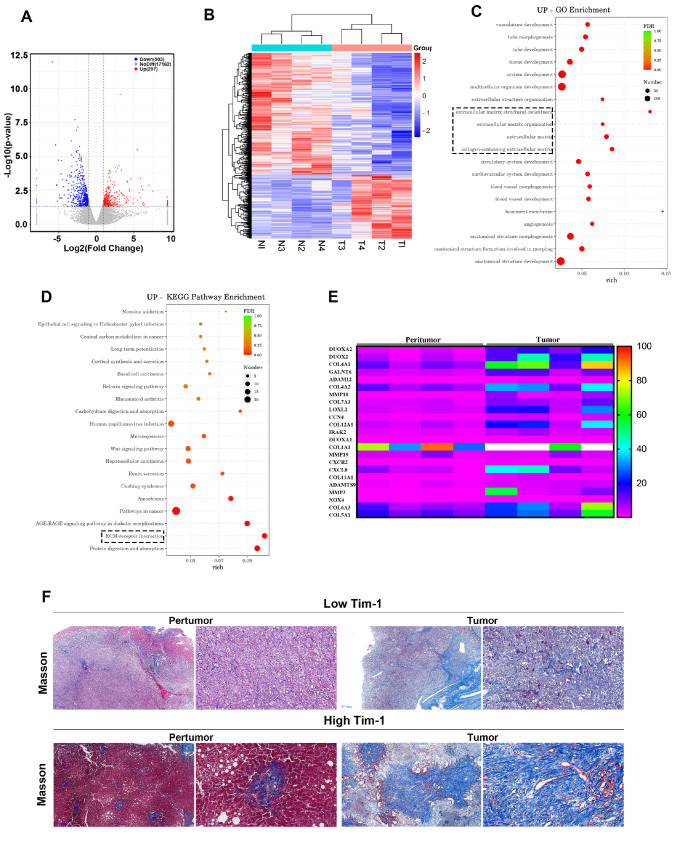
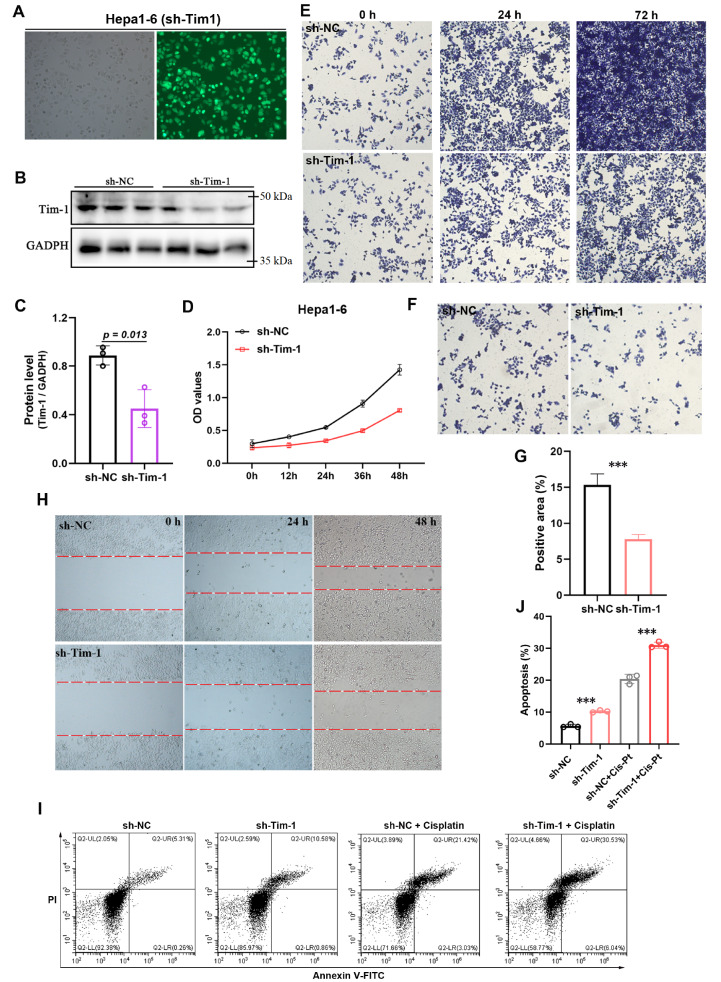
Tim-1 (T-cell immunoglobulin and mucin domain 1), also known as Kim-1 (kidney injury molecule 1) or hepatitis A virus cellular receptor 1 (HAVCR1), is a transmembrane protein expressed on various immune and epithelial cells. It plays a role in modulating inflammatory and immune responses. In this study, we find that Tim-1 is overexpressed in hepatocellular carcinoma (HCC) samples and that its expression is significantly correlated with postoperative survival. Bulk RNA sequencing reveals a general upregulation of extracellular matrix-related genes in HCC tissues with Tim-1 overexpression. The results of the cell and in vivo experiments reveal that Tim-1 in HCC not only affects biological processes such as the proliferation, migration, and invasion of HCC cells but also broadly promotes extracellular matrix processes by influencing cytokine secretion. Further studies demonstrate that Tim-1 mediates the activation of hepatic stellate cells and upregulates Th1 and Th2 cytokines, thereby promoting HCC progression. Thus, Tim-1 may represent a novel target for future interventions in HCC and liver fibrosis.

Keywords: NF-κB; Tim-1; extracellular matrix; hepatocellular carcinoma; liver fibrosis.


Conflict of interest statement

The authors declare that they have no conflict of interest.

Figures

None
Figure 1
High expression of Tim-1 in HCC is correlated with poor survival (A) Tumour tissue samples from 156 liver cancer patients were subjected to immunohistochemistry (IHC) with a Tim-1 antibody according to the manufacturer’s instructions. (B) H score analysis based on (A). (C) IHC staining data distinguishing between low and high Tim-1 expression in tumor samples. (D) Five-year survival rates were assessed in patients following surgery. (E) Tumor tissues and adjacent tissues were collected during surgery and subjected to western blot analysis with a Tim-1 antibody. (F) Tim-1 expression in (E) was quantified by calculating relative grayscale values via ImageJ. ***P<0.001.
None
Figure 2
Aberrant Tim-1 expression in HCC is closely linked to the tumor ECM (A) Analysis of bulk RNA sequencing data from tumor and adjacent tissues from patients with high Tim-1 expression (n= 4 each). (B) Heatmap showing upregulated and downregulated genes. (C) GO enrichment analysis of up-regulated transcriptional or splicing gene categories in peritumor and HCC tumor tissues. (D) KEGG pathway enrichment analysis of upregulated transcriptional or splicing gene categories in peritumor and HCC tumor tissues. (E) Heatmap displaying upregulated ECM-related genes. (F) Tumor tissues from patients with low and high Tim-1 expression were subjected to Masson staining to assess the severity of the ECM associated with intrahepatic tumors.
None
Figure 3
Blocking Tim-1 inhibits HCC-driven ECM A total of 107 Hepa1-6 cells were transplanted into mice via intravenous injection to establish an HCC model. Five days after transplantation, Tim-1 monoclonal antibody (5 μg per 20 g of mouse) was injected into the mice every two days for a total of five injections (n =10 each). (A) Liver morphology of mice transplanted with Hepa1-6 cells after 25 days and liver morphology of HCC mice after treatment with a Tim-1 monoclonal antibody ( n=5 each). (B) HE staining of liver tissues was performed to observe the infiltration of liver cancer cells. (C) Survival curves were used to estimate the survival period of the mice (n=5 each). (D) Liver weight after 25 days (n=5 each). (E) Masson staining of liver tissues after 25 days (n =5 each). (F) IHC staining with an anti-COL1A2 antibody was used to assess collagen generation in liver tissues. (G‒L) The contents of liver tissues were extracted to detect intracellular Th1-type cytokines, such as TNF-α (G), INF-γ (H), and IL-1β (I), and Th2-type cytokines, such as the cytokines TGF-β (J), MMP2 (K), and IL-4 (L), via ELISA kits. (M‒P) Intrahepatic cells were extracted and labelled with a PE-Tim-1 antibody and an Alexa Fluor-488-α-SMA antibody (M,N) or with a PE-Tim-1 antibody and a FITC-AFP antibody (O,P). These labelled cells were analyzed by flow cytometry to assess changes in HSCs and hepatoma cells. *P<0.05, ***P<0.001.
None
Figure 4
Tim-1 plays a crucial role in mediating the proliferation and migration of HCC cells A shRNA plasmid targeting Tim-1 expression was constructed and introduced into Hepa1-6 cells using lentivirus. (A) Fluorescence microscopy image showing stable knockdown of Tim-1 in Hepa1-6 cells. (B) Western blot analysis of Tim-1 protein confirming that the Tim-1 gene was knocked down. (C) The level of Tim-1 protein was quantified by calculating the relative grayscale values via the image analysis software ImageJ. (D,E) CCK8 signal abundance detection (D) and crystal violet staining (E) were performed to assess cell proliferation prior to and subsequent to Tim-1 protein downregulation. (F) Transwell experiments were performed to assess the impact of pre- and post-Tim-1 knockdown on cell invasion. (G) Quantification of the stained cell area in (F) using ImageJ. (H) An experimental design was used to assess the influence of Tim-1 gene knockdown, both before and after intervention, on the migratory capacity of the cells. (I) Flow cytometry was used to assess the effects of Tim-1 knockdown on cell apoptosis and the toxicity of cisplatin. (J) Quantification of the percentage of apoptotic cells in (I). ***P<0.001 (n=3 each).
None
Figure 5
Knockdown of Tim-1 inhibits the progression of orthotopic HCC To establish a HCC mouse model, 107 Hepa1-6 cells and 107 Hepa1-6sh-Tim-1 cells were intravenously injected into mice (n=10 each). (A) Following a period of 25 days, the liver morphologies of Hepa1-6 cells transplanted into mice were evaluated (n=5 each). (B) HE staining of liver tissue sections. (C) Changes in body weight (n=5 each). (D) Liver weight after 25 days (n=5 each). (E) Survival period of the mice (n=5 each). (F) Masson staining of liver tissue sections after 25 days (n=5 each). (G) Liver tissues were extracted and subjected to western blot analysis with COL1A2 and Tim-1 antibodies. (H,I) Quantification of Tim-1 and COL1A2 expressions in (G) by calculating the relative grayscale values using ImageJ software. (J) IHC staining of COL1A2 in liver tissue sections was used to estimate the generation of collagen proteins in liver tissues.
None
Figure 6
Tim-1 enhances cytokine secretion in hepatic stellate cells via NF-κB-related signaling pathways A plasmid construct designed to overexpress Tim-1 was generated and transduced into the JS1 cell line via lentivirus. (A) Fluorescence microscopy examination of Tim-1 protein expression in the JS1 cell line following stable overexpression. (B) Western blot analysis confirmed Tim-1 protein overexpression. (C) Quantification of Tim-1 protein levels in (B) by calculating the relative grayscale values using ImageJ. (D) CCK8 assay was used to evaluate cell proliferation before and after Tim-1 overexpression. These Tim-1-overexpressing cells were analyzed for the levels of intracellular Th1-type TNF-α (E), INF-γ (F), and IL-1β (G) and Th2-type TGF-β (H), MMP2 (I), and IL-4 (J) using corresponding ELISA kits. A comprehensive analysis of the bulk RNA-seq data obtained from JS1 cells displaying high Tim-1 expression was performed (n=3 each). (K,L) Heatmaps showing upregulated and downregulated genes. (M,O) GO enrichment analysis of upregulated and downregulated genes. (N,P) KEGG pathway enrichment analysis of upregulated and downregulated genes. (Q) JS1 cells with high Tim-1 expression were subjected to western blot analysis with antibodies against phosphorylated Akt, phosphorylated NF-κB p65, Akt, and NF-κB p65. (R) Quantification of the relative levels of phosphorylated Akt and phosphorylated NF-κB p65 in (Q) by calculating the relative grayscale values via ImageJ. **P<0.01; ***P<0.001.
None
Figure 7
High expression of Tim-1 in HSCs drives HCC progression by enhancing the ECM A total of 107 Hepa1-6 cells, 107 Hepa1-6sh-Tim-1 cells, 107 Hepa1-6+105 JS1 cells, and 107 Hepa1-6+105 JS1 OE-Tim-1 cells were injected into the subcutaneous tissues of BALB/c nude mice to establish subcutaneous tumors (n=10 each). (A) Sarcoma tissues were harvested during a 25-day proliferation period postcell engraftment, and the histopathological characteristics and sizes of the sarcoma tumors were comprehensively evaluated (n=5 each). (B) Sarcoma tissue volume (n=5 each). (C) Changes in body weight (n=5 each). (D) HE staining of liver tissue sections. (E) IHC staining with Ki67 antibody was used to assess the proliferative ability of sarcoma tissues. (F) Quantification of Ki67-positive cells via ImageJ. (G) IHC staining with Tim-1 antibody was used to assess Tim-1 levels in these sarcoma tissues. (H) Quantification of Tim-1 levels using ImageJ. (I) Masson staining of these sections of sarcoma tissues. (J) IHC staining with an anti-COL1A2 antibody was used to assess collagen protein levels in these sarcoma tissues. ** P<0.01, ***P<0.001.

Similar articles

References

    1. Filliol A, Schwabe RF. Contributions of fibroblasts, extracellular matrix, stiffness, and mechanosensing to hepatocarcinogenesis. Semin Liver Dis. . 2019;39:315–333. doi: 10.1055/s-0039-1685539. - DOI - PubMed
    1. You Y, Zheng Q, Dong Y, Xie X, Wang Y, Wu S, Zhang L, et al. Matrix stiffness-mediated effects on stemness characteristics occurring in HCC cells. Oncotarget. . 2016;7:32221–32231. doi: 10.18632/oncotarget.8515. - DOI - PMC - PubMed
    1. Liu QP, Luo Q, Deng B, Ju Y, Song GB. Stiffer matrix accelerates migration of hepatocellular carcinoma cells through enhanced aerobic glycolysis via the MAPK-YAP signaling. Cancers. . 2020;12:490. doi: 10.3390/cancers12020490. - DOI - PMC - PubMed
    1. Tsuchida T, Friedman SL. Mechanisms of hepatic stellate cell activation. Nat Rev Gastroenterol Hepatol. . 2017;14:397–411. doi: 10.1038/nrgastro.2017.38. - DOI - PubMed
    1. Wynn TA. Cellular and molecular mechanisms of fibrosis. J Pathol. . 2008;214:199–210. doi: 10.1002/path.2277. - DOI - PMC - PubMed

MeSH terms