. 2025 Jan;174(1):153-166.
doi: 10.1111/imm.13870. Epub 2024 Oct 24.

Sphingosine-1-Phosphate Signalling Inhibition Suppresses Th1-Like Treg Generation by Reversing Mitochondrial Uncoupling

Affiliations

Sphingosine-1-Phosphate Signalling Inhibition Suppresses Th1-Like Treg Generation by Reversing Mitochondrial Uncoupling

Rachel Coulombeau et al. Immunology. 2025 Jan.

Abstract

Inflammatory environments induce the generation of dysfunctional IFNγ+T-bet+FOXP3+ Th1-like Tregs, which show defective function and are found in autoimmune conditions including multiple sclerosis (MS). The pathways that control the generation of Th1-like Tregs are not well understood. Sphingosine-1-phosphate (S1P) signalling molecules are upregulated in Th1-like Tregs, and in vivo S1P inhibition with Fingolimod (FTY720) inhibits the expression of genes responsible for Treg plasticity in MS patients. However, the underlying mechanisms are unknown. Here we show that S1P signalling inhibition by FTY720 inhibits the generation of Th1-like Tregs and rescues their suppressive function. These effects are mediated by a decrease in mTORC1 signalling and reversal of the mitochondrial uncoupling that Tregs undergo during their reprogramming into Th1-like Tregs in vitro. Finally, these results are validated in in vivo-generated Th1-like Tregs, as Tregs from MS patients treated with FTY720 display decreased Th1-like Treg frequency, increased suppressive function and mitochondrial metabolism rebalance. These results highlight the involvement of mitochondrial uncoupling in Treg reprogramming and identify S1P signalling inhibition as a target to suppress the generation of dysfunctional Th1-like Tregs.

Keywords: EAE/MS; Treg; autoimmunity.


Conflict of interest statement

The authors declare no conflicts of interest.

Figures
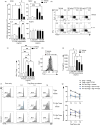
FIGURE 1
FIGURE 1
FTY720 inhibits the generation of Th1‐like Tregs in vitro. Sorted Tregs from healthy individuals were stimulated with anti‐CD3, anti‐CD28 and IL‐2 in the presence or absence of IL‐12 and increasing doses of FTY720. (A) Gene expression measured 48 h after activation (n = 4–9). Representative example (B) and summary (C) of IFNγ production 4 days after initial activation and a 4 h incubation with PMA and ionomycin in the presence of GolgiStop (n = 8). Representative histogram (D) and summary (E) of T‐bet expression measured 48 h after activation and represented as geometric mean fluorescence intensity (gMFI, n = 7). (F and G). Sorted Tregs (CD4+CD25highCD127low) were stimulated as above in the presence or absence of IL‐12. Seventy‐two hours later, cells were collected, washed and co‐cultured with Treg‐depleted, CFSE‐labelled CD4+ T cells (Tconv) for 3.5 days in the presence of various concentrations of FTY720. (F) Representative histogram of Tconv proliferation in co‐culture at various Treg:Tconv ratios. (G) Summary of percentage of suppression by Tregs and Th1‐like Tregs in the presence or absence of FTY720 at various Treg:Tconv ratios (n = 5). One‐way ANOVA or mixed effects model with Tukey's correction for multiple comparisons for (A), (C) and (E). Two‐way ANOVA with Tukeys correction for multiple comparisons in (G). *p < 0.05; **p < 0.01; ***p < 0.005.
FIGURE 2
FIGURE 2
FTY720 inhibits mTORC1 signalling to suppress Th1‐like Treg generation. CD4+ T cells from healthy individuals were stimulated with anti‐CD3, anti‐CD28 and IL‐2 in the presence or absence of IL‐12 and increasing doses of FTY720 for 18 h and fixed for cellular staining using FOXP3 and CD25 to identify Tregs. Representative histogram (A) and summary (B) of phosphorylation of AKT measured at Thr 308 (left, n = 10) and Ser 473 (right, n = 8). Representative histogram (C) and summary (D) of phosphorylation of FOXO1A (left, n = 11) and FOXO3A (right, n = 11). Representative histogram (E) and summary (F) of phosphorylation of mTOR (n = 4). Representative histogram (G) and summary (H) of S6 phosphorylation (n = 9). All summary plots are shown as normalised gMFI (to vehicle‐treated Treg values). One‐way ANOVA with Tukey's correction for multiple comparisons for (B), (D), (F) and (H). *p < 0.05; **p < 0.01; ****p < 0.005. gMFI, geometric mean fluorescence intensity.
FIGURE 3
FIGURE 3
mTORC1 inhibition with rapamycin is sufficient to inhibit Th1‐like Treg reprogramming. Sorted Tregs from healthy individuals were stimulated with anti‐CD3, anti‐CD28 and IL‐2 in the presence or absence of IL‐12 and increasing doses of rapamycin. (A) Gene expression measured 48 h after activation (n = 4). Representative example (B) and summary (C) of IFNγ production 4 days after initial activation and a 4 h stimulation with PMA and ionomycin in the presence of GolgiStop (n = 4). (D) Summary of FOXP3 expression 48 h after activation (n = 4). Representative histogram (E) and summary (F) of T‐bet expression measured 48 h after activation and represented as geometric mean fluorescence intensity (gMFI, n = 4). Representative histogram (G) and summary (H) of phosphorylation of AKT measured at Thr 308 (left, n = 7). Representative histogram (I) and summary (J) of phosphorylation of mTOR (n = 7). Representative histogram (K) and summary of S6 phosphorylation measured as gMFI (L) or frequency of phosphor‐S6+ Tregs (M, n = 7). All summary plots are shown as normalised gMFI (to vehicle‐treated Treg values). One‐way ANOVA with Tukey's correction for multiple comparisons for (A), (C), (D), (F), (H), (J) and (L). Only comparisons of Th1‐like Tregs treated with vehicle to all other groups are shown. *p < 0.05; **p < 0.01; ***p < 0.005.
FIGURE 4
FIGURE 4
Th1‐like Tregs display mitochondrial uncoupling that is reversed by S1P signalling inhibition. Sorted Tregs from healthy individuals were stimulated with anti‐CD3, anti‐CD28 and IL‐2 in the presence or absence of IL‐12 and FTY720 for 48 h. (A) Summary of puromycin incorporation measured as gMFI (n = 7). (B) Summary of percentage of mitochondrial dependence (n = 7). (C) Summary of basal oxygen consumption rate (OCR, n = 4). (D) Summary of ATP‐linked respiration (n = 4). (E) Summary of percentage of glucose dependence (n = 7). (F) Summary of basal extracellular acidification rate (n = 4). (G) Summary of percentage of glycolytic capacity (n = 7). (H) Summary of percentage of fatty acid and amino acid oxidation (n = 7). Representative histogram (I) and summary (J) of mitochondrial mass measured by MitoSpy Green incorporation (gMFI, n = 8). Representative histogram (K) and summary (L) of mitochondrial membrane polarisation measured by MitoSpy Red incorporation (gMFI, n = 8). One‐way ANOVA with Tukey's correction for multiple comparisons for (C), (D) and (F). Two‐way ANOVA with Tukey's correction for multiple comparisons for (A), (B), (E), (G), (H), (J) and (L). *p < 0.05; **p < 0.01. S1P, sphingosine‐1‐phosphate. gMFI, geometric mean fluorescence intensity.
FIGURE 5
FIGURE 5
In vivo FTY720 treatment restores mitochondrial imbalance in Tregs from RRMS patients. Sorted Tregs from healthy individuals (white) and patients with RRMS either untreated (grey) or treated with FTY720 (blue) were stimulated with PMA and ionomycin in the presence of GolgiStop for 4 h (A) or left unstimulated (B–G). (A) Summary of percentage of IFNγ and IL‐10 production and T‐bet and FOXP3 expression (gMFI, n = 10–11). (B) Representative histogram (left) and summary (right) of phosphorylation of AKT measured at Thr 308 (n = 10). (C) Representative histogram (left) and summary (right) of phosphorylation of FOXO3A (n = 8–10). (D) Representative histogram (left) and summary (right) of mTOR phosphorylation (n = 10). (E) Representative histogram (left) and summary (right) of S6 phosphorylation (n = 9–10). (F) Summary of percentage of mitochondrial dependence (n = 10–11). (G) Summary of percentage of glycolytic capacity (n = 10–11). (H) Correlation of mitochondrial dependence (percentage) with T‐bet expression (gMFI) in untreated (left) and FTY720‐treated (right) RRMS patients. (I) Correlation of glycolytic capacity (percentage) with T‐bet expression (gMFI) in untreated (left) and FTY720‐treated (right) RRMS patients. One‐way ANOVA with Tukey's correction for multiple comparisons for (A), (C), (D), (E), (F) and (G). Spearman correlation for (H) and (I). *p < 0.05; **p < 0.01; ***p < 0.005. gMFI, geometric mean fluorescence intensity; RRMS, relapsing–remitting multiple sclerosis.

References

    1. Dominguez‐Villar M. and Hafler D. A., “Regulatory T Cells in Autoimmune Disease,” Nature Immunology 19 (2018): 665–673. - PMC - PubMed
    1. Kitz A., de Marcken M., Gautron A. S., Mitrovic M., Hafler D. A., and Dominguez‐Villar M., “AKT Isoforms Modulate Th1‐Like Treg Generation and Function in Human Autoimmune Disease,” EMBO Reports 17 (2016): 1169–1183. - PMC - PubMed
    1. Dominguez‐Villar M., Baecher‐Allan C. M., and Hafler D. A., “Identification of T Helper Type 1‐Like, Foxp3+ Regulatory T Cells in Human Autoimmune Disease,” Nature Medicine 17 (2011): 673–675. - PMC - PubMed
    1. McClymont S. A., Putnam A. L., Lee M. R., et al., “Plasticity of Human Regulatory T Cells in Healthy Subjects and Patients With Type 1 Diabetes,” Journal of Immunology 186 (2011): 3918–3926. - PMC - PubMed
    1. Komatsu N., Okamoto K., Sawa S., et al., “Pathogenic Conversion of Foxp3+ T Cells Into TH17 Cells in Autoimmune Arthritis,” Nature Medicine 20 (2014): 62–68. - PubMed

Publication types

MeSH terms