. 2024;128(31):10.1021/acs.jpcc.4c02568.
doi: 10.1021/acs.jpcc.4c02568.

Orthogonal Determination of Competing Surfactant Adsorption onto Single-Wall Carbon Nanotubes During Aqueous Two-Polymer Phase Extraction via Fluorescence Spectroscopy and Analytical Ultracentrifugation

Affiliations

Orthogonal Determination of Competing Surfactant Adsorption onto Single-Wall Carbon Nanotubes During Aqueous Two-Polymer Phase Extraction via Fluorescence Spectroscopy and Analytical Ultracentrifugation

Christopher M Sims et al. J Phys Chem C Nanomater Interfaces. 2024.

Abstract

A combination of analytical ultracentrifugation (AUC) and fluorescence spectroscopy are utilized to orthogonally probe compositions of adsorbed surfactant layers on the surface of (7,5) species single-wall carbon nanotubes (SWCNTs) under conditions known to achieve differential partitioning in aqueous two-phase extraction (ATPE) separations. Fluorescence emission intensity and AUC anhydrous particle density measurements independently probe and can discriminate between adsorbed surfactant layers on a (7,5) nanotube comprised of either of two common nanotube dispersants, the anionic surfactants sodium deoxycholate and sodium dodecyl sulfate. Measurements on dispersions containing mixtures of both surfactants indicate near total direct exchange of the dominant surfactant species adsorbed to the carbon nanotube at a critical concentration ratio consistent with the ratio leading to partitioning change in the ATPE separation. By conducting these orthogonal measurements in a complex environment reflective of an ATPE separation, including multiple surfactant and polymer solution components, the results provide direct evidence for the hypothesis that it is the nature of the adsorbed surfactant layer that primarily controls partitioning behavior in selective ATPE separations of SWCNTs.

Keywords: SWCNT; Single-wall carbon nanotube; analytical ultracentrifugation; aqueous two-phase extraction; separation.


Figures

Figure 1.
Figure 1.
Schematic of the surfactant exchange mechanism hypothesis for ATPE separations [11]. At a constant concentration of one surfactant, e.g., the bile salt sodium deoxycholate (DOC), the dominant composition of the adsorbed surfactant layer on the (7,5) nanotube surface depends on the concentration of the second, competing, co-surfactant, e.g., the alkyl chain surfactant sodium dodecyl sulfate (SDS). At low concentrations of SDS, the (7,5) is covered by DOC and preferentially partitions to the bottom dextran phase in an ATPE separation, yielding Ki<1; above a critical SDS concentration the dominant adsorbed surfactant on the (7,5) switches to SDS and top, PEG, phase partitioning occurs (Ki>1).
Figure 2.
Figure 2.
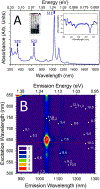
Spectroscopic characterization of the (7,5)-rich SWCNT dispersion in 10.0 g/L DOC in H2O. A. Absorbance spectra of the dispersion displaying dominant peak features at 340 nm, 650 nm, and 1033 nm characteristic of a water-filled (7,5) SWCNT dispersed with DOC. Insets: photograph of the (7,5) dispersion and absorbance-scaled CD spectra. B. 2D excitation – emission plot of fluorescence from the (7,5) dispersion. Intensity peaks are attributable to SWCNT species of the closest labelled points. The plot reflects a highly enriched (7,5) population (peak value = 10) with a lesser concentration of the (8,4), (peak value < 2) and significantly lesser of the (9,4) and (11,1) species. The contour plot is presented on a scale from 0 – 5 to enable visual identification of the minor SWCNT species, as their contributions are not discerable at a full 0 – 10 intensity scale range. A log scale intensity plot is presented in the SI.
Figure 3.
Figure 3.
A. Fluorescence intensity line scan for 637 nm laser excitation of the (7,5) sample at the same SWCNT concentration as dispersed in 10.0 g/L DOC and 10.0 g/L SDS at 20 °C. B. Maximum PL intensity as a function of the SDS concentration for the (7,5) SWCNT in the presence of a constant concentration of PEG and DOC. The data displays transitions consistent with an interpretation of an exchange of the adsorbed surfactant on each SWCNT at an (n,m) specific critical surfactant concentration ratio. The curve is a double finite-width Heaviside fit to the data. Dashed lines represent the calculated PCCC values for the (−)(7,5) and (+)(7,5), respectively.
Figure 4.
Figure 4.
A.Representative radial concentration profiles (every other) of the (7,5) SWCNT in 10.0 g/L DOC, 35 g/L PEG in H2O as measured via absorbance optics as a function of time (points) during sedimentation and the calculated profiles from Lamm equation modelling. B. The best fit sedimentation coefficient distribution for the data in panel A; the width is primarily reflective of a polydisperse length distribution. The signal-weighted average sedimentation coefficient value, <s>, is marked by a vertical line. C. Viscosity corrected <s> values plotted versus solution density for measurements in different isotopic mixtures of H2O:D2O. The best fit linear extrapolation yields the anhydrous density, defined as the density value at which <s> = 0. Reducing the DOC concentration to ATPE conditions increases the anhydrous particle density; changing the sole dispersant to SDS dramatically reduces it.
Figure 5.
Figure 5.
A. Schematic of the composition space locations for anhydrous densimetry measurements compared to the PCCC value for the (7,5) SWCNT. B. Viscosity corrected <s> values plotted versus solution density and best linear extrapolation to the anhydrous density for the two surfactant concentrations above and below the PCCC values. Vertical lines (short dashes = SDS, long dashes DOC) highlight the intercepts observed for 10 g/L SDS and 0.5 g/L DOC in the single surfactant experiments of Figure 4C. The intercept for the condition below the PCCC (4.5 g/L SDS, 0.5 g/L DOC) is close to the SDS free (7,5) anhydrous density; the intercept for the condition above the PCCC (10 g/L SDS, 0.5 g/L DOC) is similarly comparable to the SDS (DOC free) measurement.
Figure 6.
Figure 6.
Intercomparison of the orthogonal results from AUC sedimentation velocity and fluorescence spectroscopy intensity measurements on the transition of the dominant surfactant species, DOC or SDS, adsorbed to the (7,5) SWCNT interface as a function of SDS solution concentration. Lines are Heaviside fits to the data (PL data in red, AUC data in dashed black), colored regions are eye guides for the offered interpretation. With the confirmation from anhydrous densimetry that compositions above and below the transition region reflect strongly dominated adsorption to the SWCNT by a single surfactant, both data sets independently imply a strongly direct exchange from one coating to the other at the PCCC value.

References

    1. He X; Hartmann NF; Ma X; Kim Y; Ihly R; Blackburn JL; Gao W; Kono J; Yomogida Y; Hirano A; et al. Tunable room-temperature single-photon emission at telecom wavelengths from sp3 defects in carbon nanotubes. Nat. Photonics 2017, 11 (9), 577–582. DOI: 10.1038/nphoton.2017.119. - DOI
    1. Kim M; Chen C; Wang P; Mulvey JJ; Yang Y; Wun C; Antman-Passig M; Luo H-B; Cho S; Long-Roche K; et al. Detection of ovarian cancer via the spectral fingerprinting of quantum-defect-modified carbon nanotubes in serum by machine learning. Nat. Biomed. Eng 2022, 6 (3), 267–275. DOI: 10.1038/s41551-022-00860-y. - DOI - PMC - PubMed
    1. De los Santos ZA; Lin Z; Zheng M. Optical Detection of Stereoselective Interactions with DNA-Wrapped Single-Wall Carbon Nanotubes. Journal of the American Chemical Society 2021, 143 (49), 20628–20632. DOI: 10.1021/jacs.1c11372. - DOI - PubMed
    1. Zhao M; Chen Y; Wang K; Zhang Z; Streit JK; Fagan JA; Tang J; Zheng M; Yang C; Zhu Z; et al. DNA-directed nanofabrication of high-performance carbon nanotube field-effect transistors. Science 2020, 368 (6493), 878–881. DOI: 10.1126/science.aaz7435 (acccessed 2023/09/26). - DOI - PubMed
    1. Franklin AD; Hersam MC; Wong HSP Carbon nanotube transistors: Making electronics from molecules. Science 2022, 378 (6621), 726–732. DOI: 10.1126/science.abp8278 (acccessed 2022/11/17). - DOI - PubMed

LinkOut - more resources