

Hic-5 antisense oligonucleotide inhibits advanced hepatic fibrosis and steatosis in vivo
- PMID: 39444410
- PMCID: PMC11497448
- DOI: 10.1016/j.jhepr.2024.101195
Hic-5 antisense oligonucleotide inhibits advanced hepatic fibrosis and steatosis in vivo
Abstract
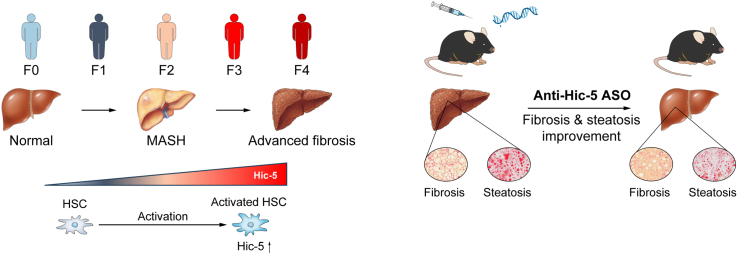
Background & aims: Chronic liver diseases, including metabolic dysfunction-associated steatohepatitis (MASH), pose a significant global health burden. Progressive liver fibrosis can lead to severe outcomes; however, there is a lack of effective therapies targeting advanced fibrosis. Hydrogen peroxide-inducible clone-5 (Hic-5), an adaptor protein in focal adhesion, is critical for promoting liver fibrosis in hepatic stellate cells. This study investigated its clinical applicability by examining hepatic Hic-5 expression in human fibrotic tissues, exploring its association with MASH, and assessing the therapeutic potential of antisense oligonucleotides (ASOs) targeting Hic-5 in a MASH mouse model.
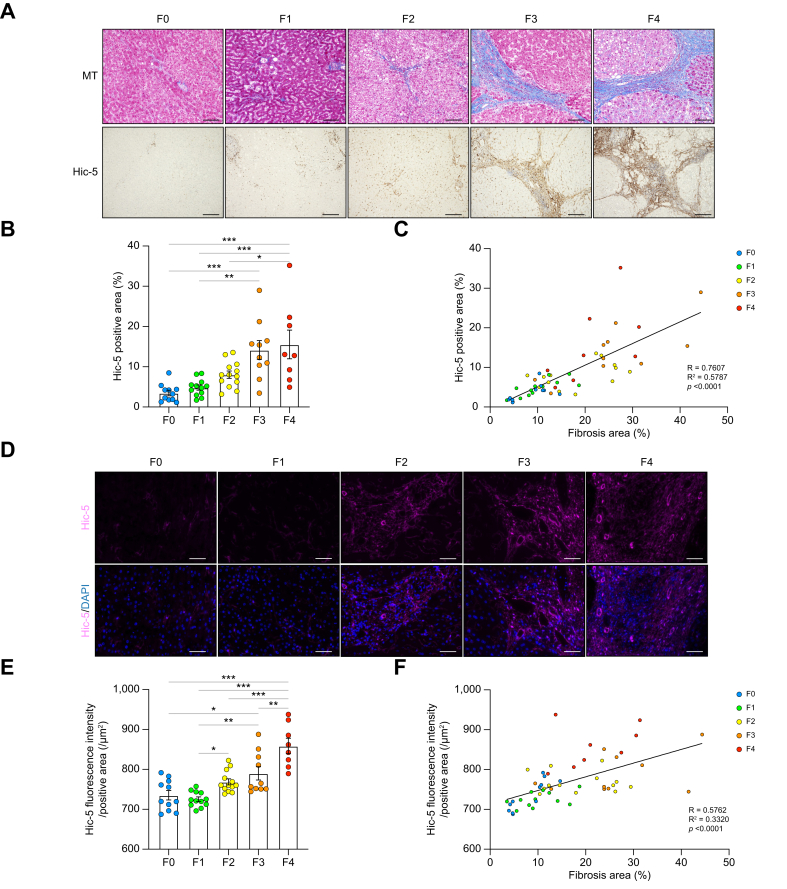
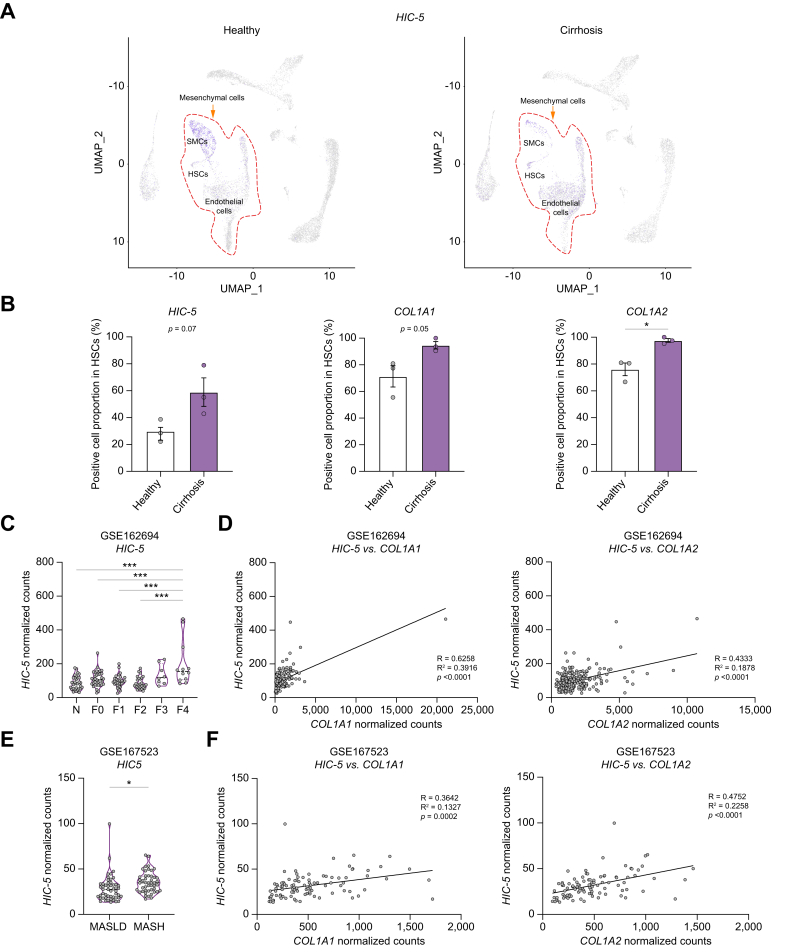
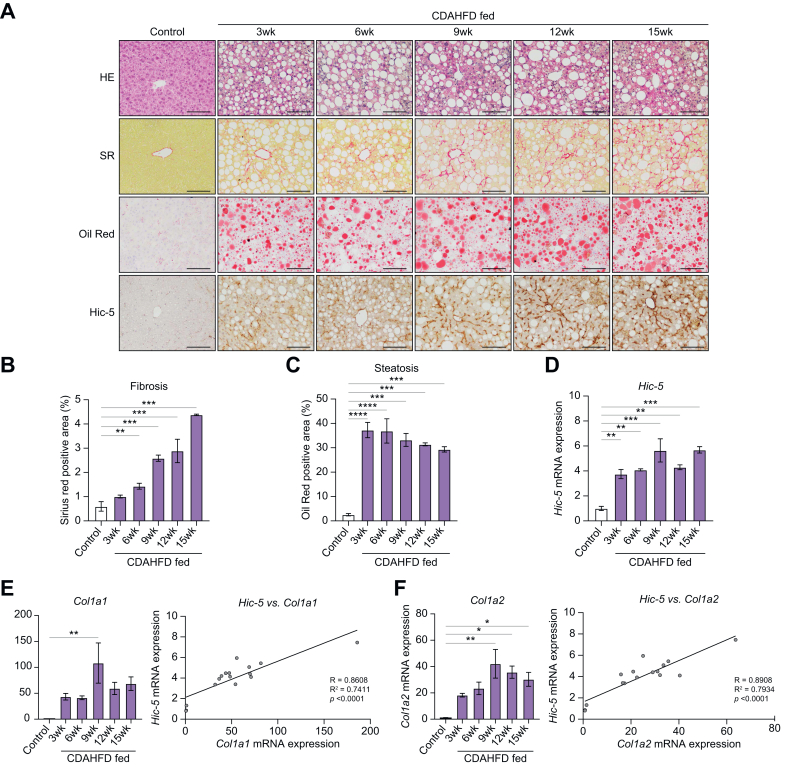
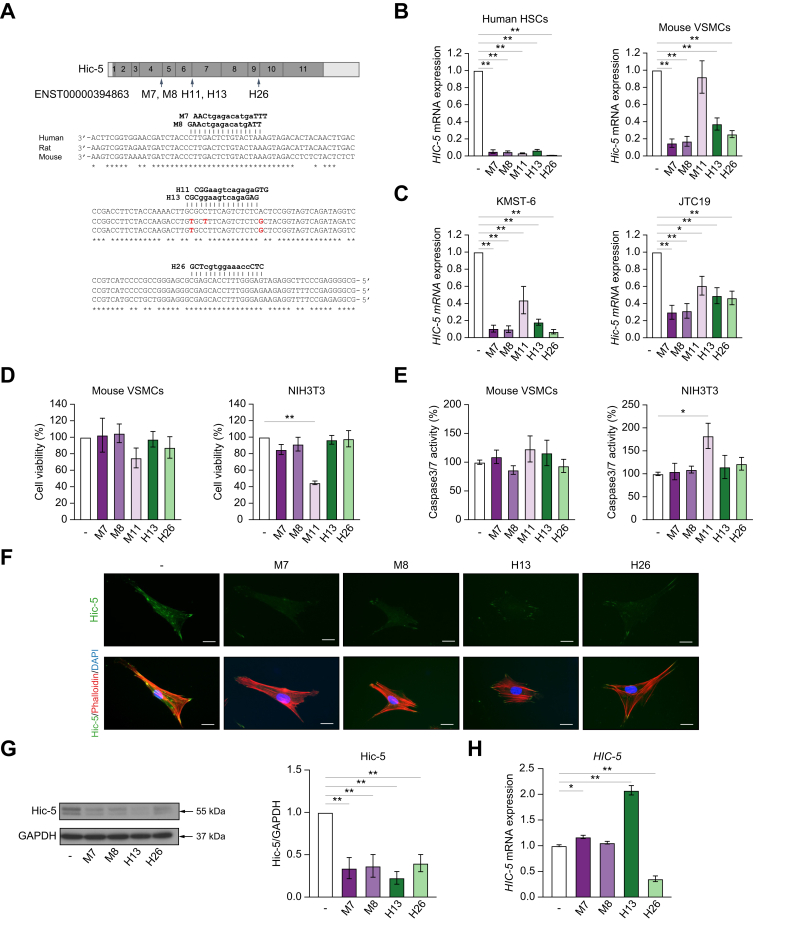
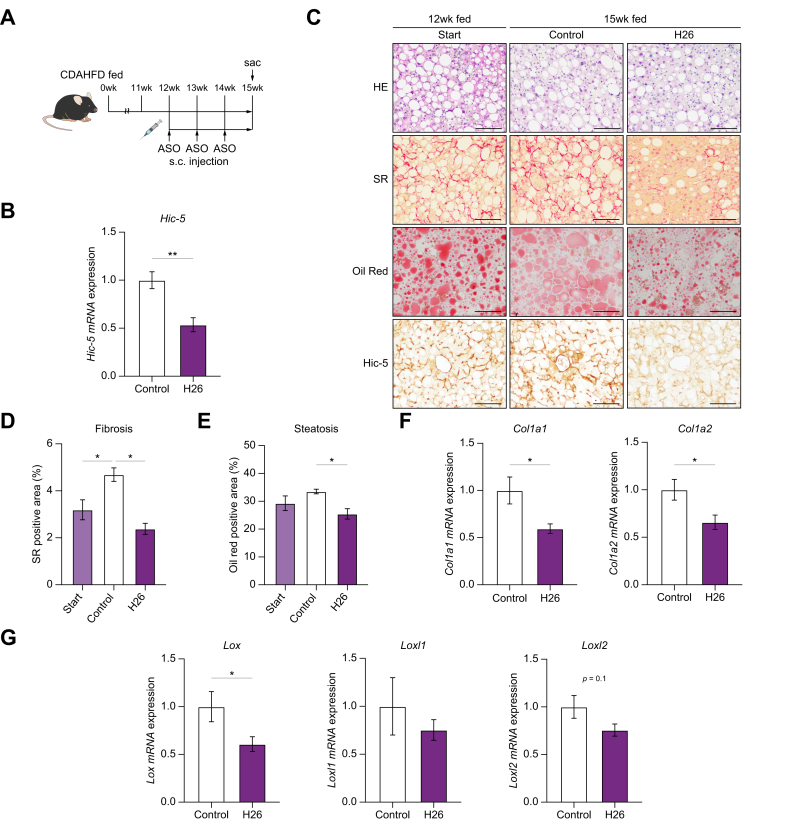
Methods: Hepatic Hic-5 expression in human fibrotic tissues underwent pathological image analysis and single-cell RNA sequencing. ASOs targeting Hic-5 were developed and tested using in vitro cell models. An in vivo MASH mouse model was used to evaluate the effects of anti-Hic-5 ASOs on advanced fibrosis and steatosis.
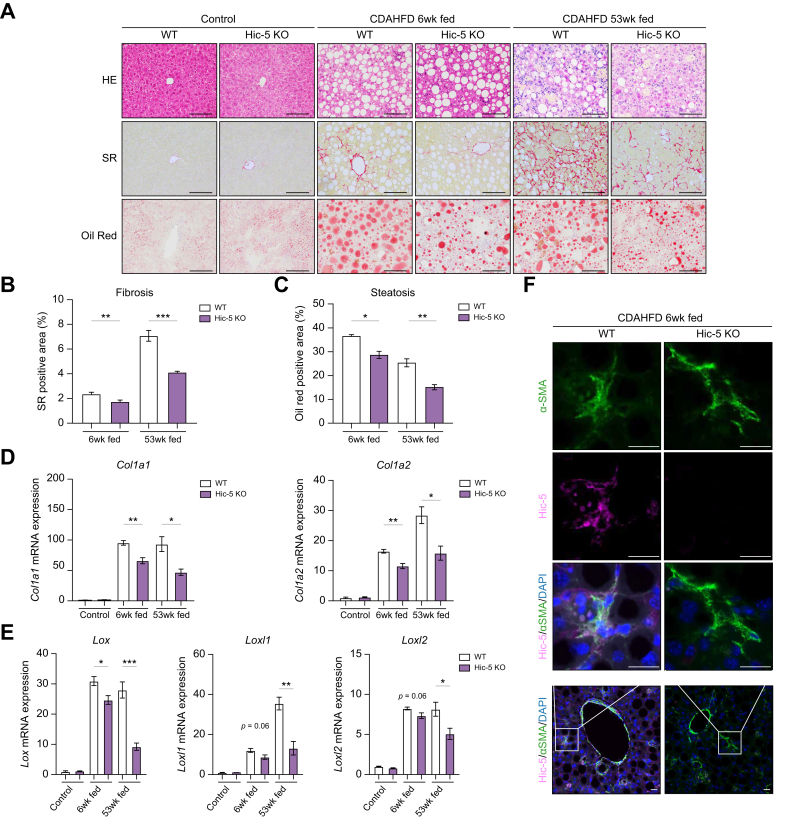
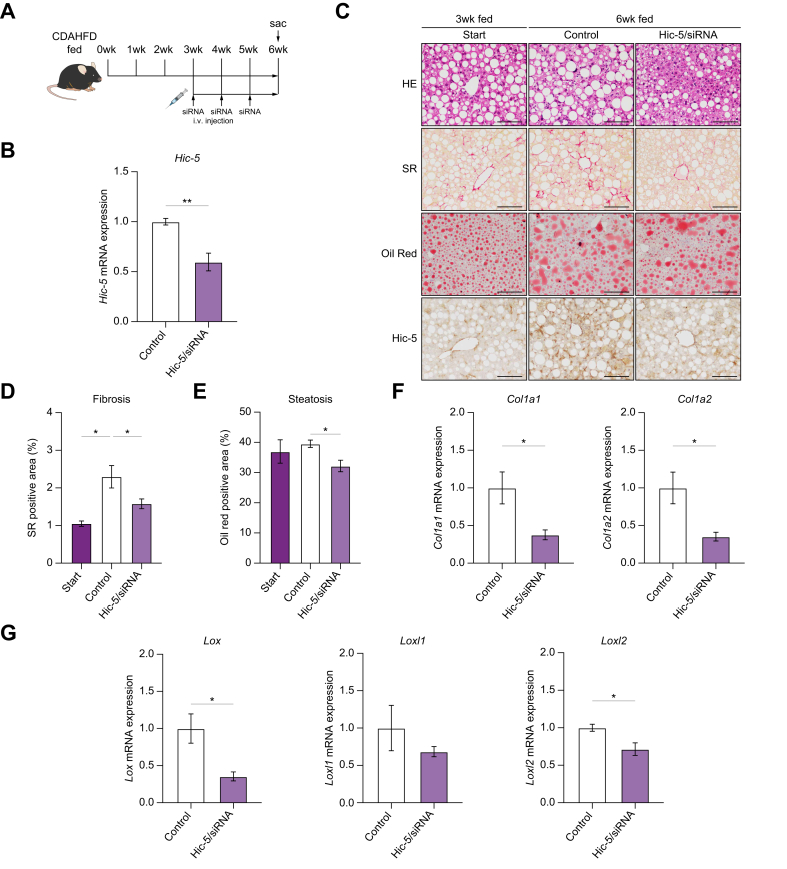
Results: Hepatic Hic-5 expression increased with the progression of fibrosis, particularly in advanced stages. Single-cell RNA sequencing revealed Hic-5 expression primarily in hepatic stellate cells. In MASH-associated fibrosis, Hic-5 expression correlated with the expression of fibrotic genes. In the MASH mouse model, hepatic Hic-5 expression increased with disease progression. Anti-Hic-5 ASOs effectively suppressed Hic-5 expression in vitro and attenuated advanced fibrosis and steatosis in vivo, indicating their therapeutic potential.
Conclusions: Hepatic Hic-5 expression is associated with advanced liver fibrosis and MASH. Anti-Hic-5 ASOs are promising therapeutic interventions for MASH accompanied by advanced fibrosis. These findings provide valuable insights into potential clinical treatments for advanced liver fibrosis.
Impact and implications: This study investigated the role of Hic-5 in liver fibrosis and steatohepatitis, highlighting its potential as a therapeutic target. We developed an antisense oligonucleotide (ASO) that was particularly transportable to the liver, and targeted Hic-5. Anti-Hic-5 ASO exhibited therapeutic efficacy for liver fibrosis and steatosis in vivo, indicating its therapeutic potential for liver fibrosis and steatosis. ASOs have already achieved dramatic therapeutic effects as approved nucleic acid drugs. Thus, anti-Hic-5 ASO is expected to lead the direct generation of seed compounds for the clinical development of drugs for liver fibrosis and steatosis.
Keywords: ASO; Extracellular matrix; Hic-5; Liver fibrosis; MASH.
© 2024 The Authors.
Figures
Similar articles
-
Periostin antisense oligonucleotide prevents hepatic steatosis and fibrosis in a mouse model of non-alcoholic steatohepatitis.J Gastroenterol Hepatol. 2020 Dec;35(12):2140-2150. doi: 10.1111/jgh.15088. Epub 2020 May 13. J Gastroenterol Hepatol. 2020. PMID: 32365405
-
Evaluation of antisense oligonucleotide therapy targeting Hsd17b13 in a fibrosis mice model.J Lipid Res. 2024 Mar;65(3):100514. doi: 10.1016/j.jlr.2024.100514. Epub 2024 Feb 2. J Lipid Res. 2024. PMID: 38309418 Free PMC article.
-
Prevent and Reverse Metabolic Dysfunction-Associated Steatohepatitis and Hepatic Fibrosis via mRNA-Mediated Liver-Specific Antibody Therapy.ACS Nano. 2024 Dec 17;18(50):34375-34390. doi: 10.1021/acsnano.4c13404. Epub 2024 Dec 5. ACS Nano. 2024. PMID: 39639502
-
NAFLD (MASLD)/NASH (MASH): Does It Bother to Label at All? A Comprehensive Narrative Review.Int J Mol Sci. 2024 Aug 2;25(15):8462. doi: 10.3390/ijms25158462. Int J Mol Sci. 2024. PMID: 39126031 Free PMC article. Review.
-
Regulation of Hepatic Stellate Cell Phenotypes in Metabolic Dysfunction-Associated Steatohepatitis.Gastroenterology. 2025 Mar 20:S0016-5085(25)00528-1. doi: 10.1053/j.gastro.2025.03.010. Online ahead of print. Gastroenterology. 2025. PMID: 40120772 Review.
Cited by
-
Scaffold Proteins in Fibrotic Diseases of Visceral Organs.Biomolecules. 2025 Mar 16;15(3):420. doi: 10.3390/biom15030420. Biomolecules. 2025. PMID: 40149956 Free PMC article. Review.
References
-
- Wong V.W.-S., Ekstedt M., Wong G.L.-H., et al. Changing epidemiology, global trends and implications for outcomes of NAFLD. J Hepatol. 2023;79:842–852. - PubMed
-
- Hagström H., Nasr P., Ekstedt M., et al. Fibrosis stage but not NASH predicts mortality and time to development of severe liver disease in biopsy-proven NAFLD. J Hepatol. 2017;67:1265–1273. - PubMed
LinkOut - more resources
Full Text Sources
