

Diagnostic and prognostic performance of the LiverRisk score in tertiary care
- PMID: 39444411
- PMCID: PMC11497454
- DOI: 10.1016/j.jhepr.2024.101169
Diagnostic and prognostic performance of the LiverRisk score in tertiary care
Abstract
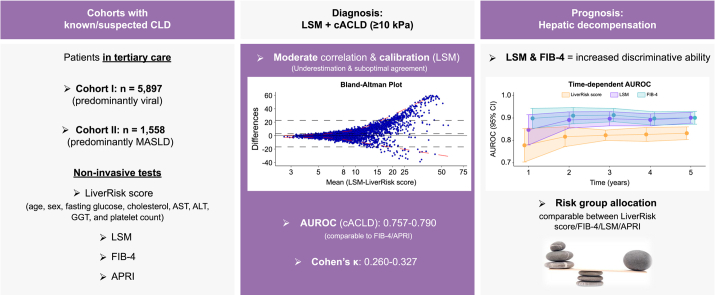
Background & aims: The LiverRisk score has been proposed as a blood-based tool to estimate liver stiffness measurement (LSM), thereby stratifying the risk of compensated advanced chronic liver disease (cACLD, LSM ≥10 kPa) and liver-related events in patients without known chronic liver disease (CLD). We aimed to evaluate its diagnostic/prognostic performance in tertiary care.
Methods: Patients referred to two hepatology outpatient clinics (cohort I, n = 5,897; cohort II, n = 1,558) were retrospectively included. Calibration/agreement of the LiverRisk score with LSM was assessed, and diagnostic accuracy for cACLD was compared with that of fibrosis-4 (FIB-4)/aspartate aminotransferase-to-platelet ratio index (APRI). The prediction of hepatic decompensation and utility of proposed cut-offs were evaluated.
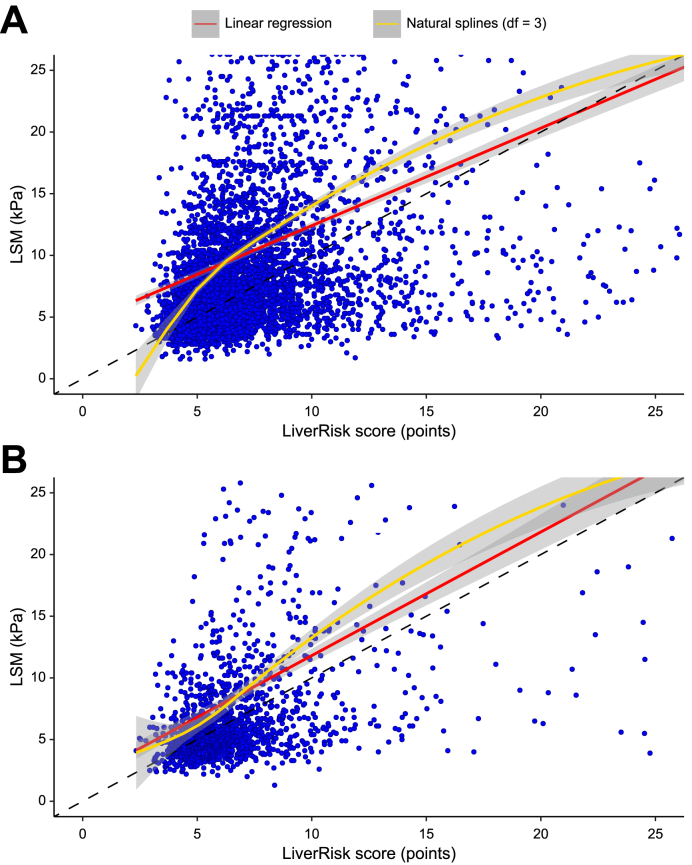
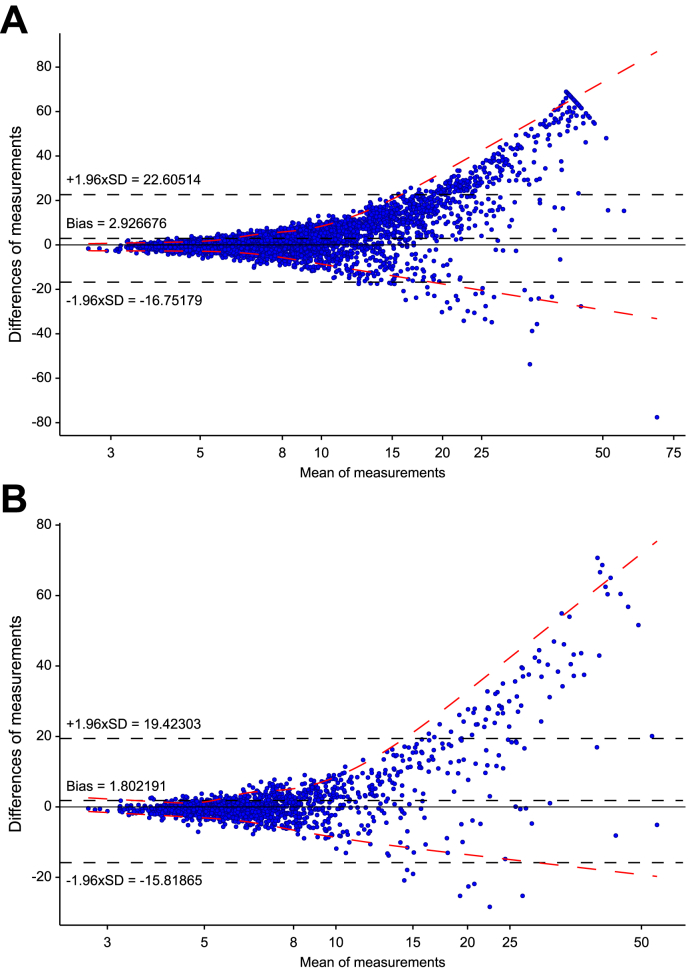
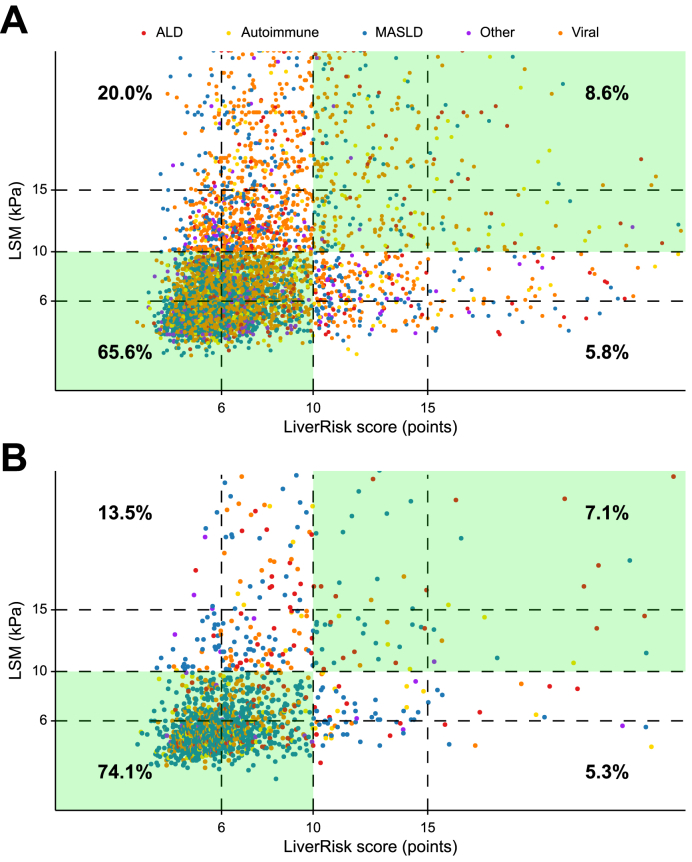
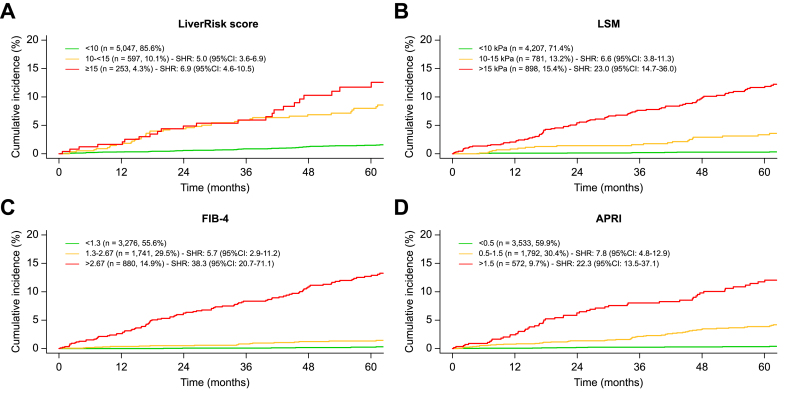
Results: In cohort I/II, mean age was 48.3/51.8 years, 44.2%/44.7% were female, predominant etiologies were viral hepatitis (51.8%)/metabolic dysfunction-associated steatotic liver disease (63.7%), median LSM was 6.9 (IQR 5.1-10.9)/5.8 (IQR 4.5-8.8) kPa, and 1,690 (28.7%)/322 (20.7%) patients had cACLD.Despite a moderate correlation (Pearson's r = 0.325/0.422), the LiverRisk score systematically underestimated LSM (2.93/1.80 points/kPa lower), and range of agreement was wide, especially at higher values.The diagnostic accuracy of the LiverRisk score for cACLD (area under the receiver operator characteristics curve [AUROC] 0.757/0.790) was comparable to that of FIB-4 (AUROC 0.769/0.813) and APRI (AUROC 0.747/0.765). The proposed cut-off of 10 points yielded an accuracy of 74.2%/81.2%, high specificity (91.9%/93.4%), but low negative predictive value (76.6%/84.5%, Cohen's κ = 0.260/0.327).In cohort I, 208 (3.5%) patients developed hepatic decompensation (median follow-up 4.7 years). The LiverRisk score showed a reasonable accuracy for predicting hepatic decompensation within 1-5 years (AUROC 0.778-0.832). However, it was inferior to LSM (AUROC 0.847-0.901, p <0.001) and FIB-4 (AUROC 0.898-0.913, p <0.001). Similar to the strata of other non-invasive tests, the proposed LiverRisk groups had distinct risks of hepatic decompensation.
Conclusions: The LiverRisk score did not improve the diagnosis of cACLD or prediction of hepatic decompensation in the tertiary care setting.
Impact and implications: The LiverRisk score has been proposed as a non-invasive tool to estimate liver stiffness measurement and thus the risk of compensated advanced chronic liver disease and liver-related events. As automatic implementation into lab reports is being discussed, the question of its applicability outside of opportunistic screening in the general population arises. In two large cohorts of patients referred to hepatology outpatient clinics, the LiverRisk score did not accurately predict liver stiffness, did not improve cACLD identification, and had a lower predictive performance for hepatic decompensation as compared with FIB-4. Although it represents a major step forward for screening patients without known liver disease in primary care, our findings indicate that the LiverRisk score does not improve patient management outside the primary care setting, that is, in cohorts with a higher pre-test probability of cACLD.
Keywords: Chronic liver disease; FIB-4; LSM; Liver stiffness measurement; cACLD.
© 2024 The Author(s).
Figures
References
-
- Karlsen T.H., Sheron N., Zelber-Sagi S., et al. The EASL–Lancet Liver Commission: protecting the next generation of Europeans against liver disease complications and premature mortality. Lancet. 2022;399:61–116. - PubMed
-
- D'Amico G., Garcia-Tsao G., Pagliaro L. Natural history and prognostic indicators of survival in cirrhosis: a systematic review of 118 studies. J Hepatol. 2006;44:217–231. - PubMed
-
- European Association for the Study of the Liver EASL Clinical Practice Guidelines on non-invasive tests for evaluation of liver disease severity and prognosis—2021 update. J Hepatol. 2021;75:659–689. - PubMed
LinkOut - more resources
Full Text Sources
Research Materials
Miscellaneous
