. 2024 Oct 16:2024:9066326.
doi: 10.1155/2024/9066326. eCollection 2024.

To Develop Biomarkers for Diabetic Nephropathy Based on Genes Related to Fibrosis and Propionate Metabolism and Their Functional Validation

Affiliations

To Develop Biomarkers for Diabetic Nephropathy Based on Genes Related to Fibrosis and Propionate Metabolism and Their Functional Validation

Sha Li et al. J Diabetes Res. .

Abstract

Propionate metabolism is important in the development of diabetes, and fibrosis plays an important role in diabetic nephropathy (DN). However, there are no studies on biomarkers related to fibrosis and propionate metabolism in DN. Hence, the current research is aimed at evaluating biomarkers associated with fibrosis and propionate metabolism and to explore their effect on DN progression. The GSE96804 (DN : control = 41 : 20) and GSE104948 (DN : control = 7 : 18) DN-related datasets and 924 propionate metabolism-related genes (PMRGs) and 656 fibrosis-related genes (FRGs) were acquired from the public database. First, DN differentially expressed genes (DN-DEGs) between the DN and control samples were sifted out via differential expression analysis. The PMRG scores of the DN samples were calculated based on PMRGs. The samples were divided into the high and low PMRG score groups according to the median scores. The PM-DEGs between the two groups were screened out. Second, the intersection of DN-DEGs, PM-DEGs, and FRGs was taken to yield intersected genes. Random forest (RF) and recursive feature elimination (RFE) analyses of the intersected genes were performed to sift out biomarkers. Then, single gene set enrichment analysis was conducted. Finally, immunoinfiltrative analysis was performed, and the transcription factor (TF)-microRNA (miRNA)-mRNA regulatory network and the drug-gene interaction network were constructed. There were 2633 DN-DEGs between the DN and control samples and 515 PM-DEGs between the high and low PMRG score groups. In total, 10 intersected genes were gained after taking the intersection of DN-DEGs, PM-DEGs, and FRGs. Seven biomarkers, namely, SLC37A4, ACOX2, GPD1, angiotensin-converting enzyme 2 (ACE2), SLC9A3, AGT, and PLG, were acquired via RF and RFE analyses, and they were found to be involved in various mechanisms such as glomerulus development, fatty acid metabolism, and peroxisome. The seven biomarkers were positively correlated with neutrophils. Moreover, 8 TFs, 60 miRNAs, and 7 mRNAs formed the TF-miRNA-mRNA regulatory network, including USF1-hsa-mir-1296-5p-AGT and HIF1A-hsa-mir-449a-5p-ACE2. The drug-gene network contained UROKINASE-PLG, ATENOLOL-AGT, and other interaction relationship pairs. Via bioinformatic analyses, the risk of fibrosis and propionate metabolism-related biomarkers in DN were explored, thereby providing novel ideas for research related to DN diagnosis and treatment.


Conflict of interest statement

The authors declare no conflicts of interest.

Figures
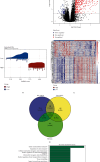
Figure 1
Figure 1
Differential expression analysis and functional enrichment analysis. (a) The volcano map and heat map of differentially expressed genes (DEGs) between diabetic nephropathy (DN) and control samples. (b) The raincloud plot of propionate metabolism-related genes (PMRGs) score. (c) The volcano map and heat map of 515 propionate metabolism-related DEGs (PM-DEGs). (d) The Venn diagram of 10 intersected genes obtained by overlapping DN-DEGs, PM-DEGs, and fibrosis-related genes (FRGs). (e, f) The Gene Ontology (GO) terms and Kyoto Encyclopedia of Genes and Genomes (KEGG) pathways enriched in intersected genes. BP, biological progress; CC, cellular component; MF, molecular function (MF). (g) The protein–protein interaction (PPI) network of intersected genes.
Figure 2
Figure 2
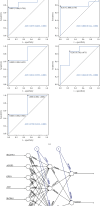
Identification of biomarkers. (a, b) The accuracy and importance ranking of feature gene in random forest (RF) model. (c) The receiver operating characteristic (ROC) curves of 5x cross-validated. AUC, area under the curve. (d) The artificial neural network (ANN) model of biomarkers. (e) The importance of each gene to the model prediction outcome.
Figure 3
Figure 3
Functional enrichment analysis. (a) The boxplot of the GO semantic similarity of the key genes. (b–d) Gene Set Enrichment Analysis (GSEA) of (b) ACE2, (c) ACOX2, and (d) AGT.
Figure 4
Figure 4
Functional enrichment analysis. (a–d) GSEA analysis of GPD1, PLG, SLC9A3, and SLC37A4.
Figure 5
Figure 5
Identification of biomarkers and exploration of their clinical significance. (a) The multivariate logistic regression model of 7 biomarkers. (b) The nomogram was constructed to predict the odd ratio of DN based on the biomarkers. (c) The calibration curve of the nomogram. (d) The ROC curves of logistic regression model in the GSE96804 and GSE104948 datasets. (e) The decision curve analysis (DCA) curve of the nomogram.
Figure 6
Figure 6
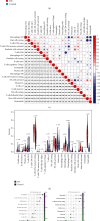
Immune infiltration analysis. (a, b) The bar graph and heat map of the proportion of immune cells in DN and control samples. (c) The relevance of immune cells. (d) Discrepancies of the fraction of immune cells in DN and control samples. (e) The relevance of biomarkers to differential immune cells.
Figure 7
Figure 7
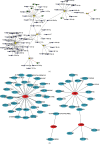
Construction of the regulatory network and drugs prediction. (a) The network established based on biomarkers, microRNAs (miRNAs), and transcription factors (TFs). Blue diamonds represent miRNAs; yellow circles represent biomarkers; green circles represent TFs. (b) The drug-biomarker interaction network. Red represents biomarkers and biue represents drugs.

Similar articles

Cited by

References

    1. Yin S., Li W., Wang J., Wu H., Hu J., Feng Y. Screening of key genes associated with m6A methylation in diabetic nephropathy patients by CIBERSORT and weighted gene coexpression network analysis. American Journal of Translational Research . 2022;14(4):2280–2290. - PMC - PubMed
    1. Alicic R. Z., Rooney M. T., Tuttle K. R. Diabetic kidney disease: challenges, progress, and possibilities. Clinical Journal of the American Society of Nephrology . 2017;12(12):2032–2045. doi: 10.2215/cjn.11491116. - DOI - PMC - PubMed
    1. Li Z., Feng J., Zhong J., Lu M., Gao X., Zhang Y. Screening of the key genes and signalling pathways for diabetic nephropathy using bioinformatics analysis. Frontiers in Endocrinology . 2022;13, article 864407 doi: 10.3389/fendo.2022.864407. - DOI - PMC - PubMed
    1. Spears J. W., Lloyd K. E., Pickworth C. A., et al. Chromium propionate in broilers: human food and broiler safety. Poultry Science . 2019;98(12):6579–6585. doi: 10.3382/ps/pez444. - DOI - PMC - PubMed
    1. Xu Y. X., Zhang S. H., Luan J. L., et al. The food preservative sodium propionate induces hyperglycaemic state and neurological disorder in zebrafish. Neurotoxicology and Teratology . 2022;93, article 107123 doi: 10.1016/j.ntt.2022.107123. - DOI - PubMed

LinkOut - more resources