. 2024 Oct 21;5(12):1232-1247.
doi: 10.1039/d4cb00184b. Online ahead of print.

Induced degradation of SNAP-fusion proteins

Affiliations

Induced degradation of SNAP-fusion proteins

Savina Abraham Pol et al. RSC Chem Biol. .

Abstract

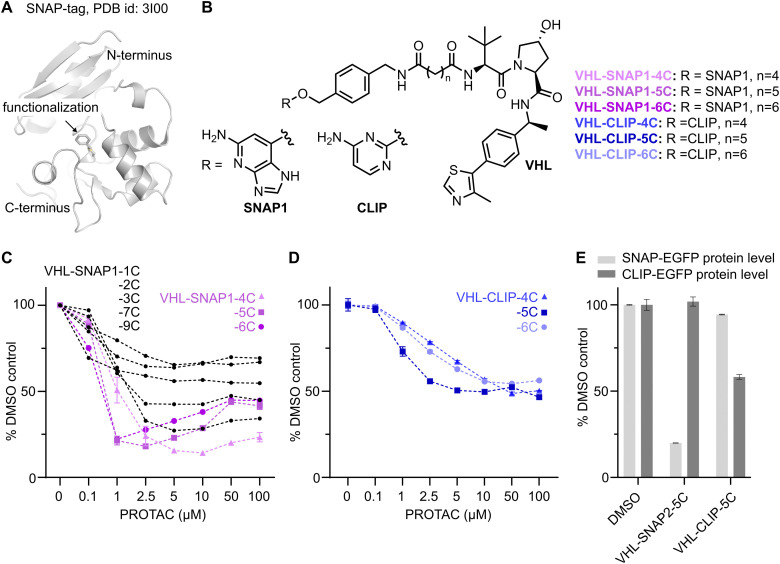
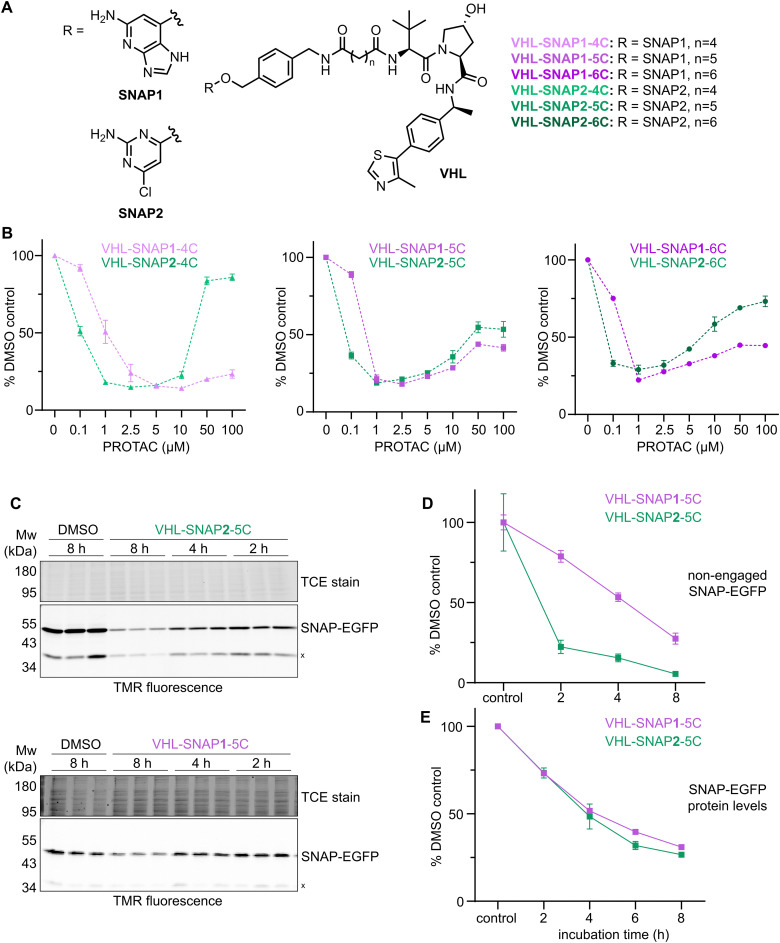
Self-labeling protein tags are an efficient means to visualize, manipulate, and isolate engineered fusion proteins with suitable chemical probes. The SNAP-tag, which covalently conjugates to benzyl-guanine and -chloropyrimidine derivatives is used extensively in fluorescence microscopy, given the availability of suitable SNAP-ligand-based probes. Here, we extend the applicability of the SNAP-tag to targeted protein degradation. We developed a set of SNAP PROteolysis TArgeting Chimeras (SNAP-PROTACs), which recruit the VHL or CRBN-ubiquitin E3 ligases to induce the degradation of SNAP-fusion proteins. Endogenous tagging enabled the visualization and the selective depletion of a SNAP-clathrin light chain fusion protein using SNAP-PROTACs. The addition of PROTACs to the SNAP-tag reagent toolbox facilitates the comprehensive analysis of protein function with a single gene tagging event.


Conflict of interest statement

There are no conflicts of interest to declare.

Figures

Fig. 1
Fig. 1. Development of VHL-recruiting SNAP- and CLIP-tag targeting PROTACs. (A) Crystal structure of benzylated SNAP-tag. (B) Chemical structures of selected PROTACs comprising the SNAP1- or CLIP ligands, linker, and VHL-recruiting ligand (related to Scheme S1, ESI†). (C) Flow cytometry analysis of SNAP-EGFP levels in HEK293 SNAP-EGFP cells treated with different concentrations of VHL-SNAP1-PROTACs for 24 h. (D) Flow cytometry analysis of CLIP-EGFP levels in HEK293 CLIP-EGFP cells treated with different concentrations of VHL-CLIP-PROTACs for 24 h. (E) Analysis of cross-reactivity of SNAP- and CLIP-targeting PROTACs. HEK293 cells expressing either SNAP-EGFP or CLIP-EGFP were treated for 24 h with 2.5 μM VHL-CLIP-5C or 1 μM VHL-SNAP2-5C. Decrease in EGFP-levels was measured by flow cytometry (n = 3, data represent mean ± s.d.).
Fig. 2
Fig. 2. Optimization of the SNAP-tag recruiting ligand. (A) Structure of the SNAP2 ligand. (B) Chemical structures of the 15 chloropyrimidine-based SNAP ligands considered in this study. Ligands 1n and 1o were never synthesized. (C) SDS-PAGE of HEK293 SNAP-EGFP cells treated with SNAP1- or SNAP2 ligand for 15 min. Non-engaged SNAP-EGFP was labeled with SNAP-TMR dye to indirectly assess binding of the ligands. TCE signal was used as a loading control. (D) Quantification of the TMR-signal in HEK293 SNAP-EGFP cells treated for 15 min with the SNAP ligands shown in B (n = 4, data represent mean ± s.d.).
Fig. 3
Fig. 3. Optimization of VHL-SNAP-PROTACs. (A) Chemical structures of PROTACs comprising SNAP1 or SNAP2-ligands, aliphatic linkers, and VHL recruiting ligand. (B) Dose response of VHL-SNAP1- or -SNAP2-based PROTACs in HEK293 SNAP-EGFP cells treated for 24 h. SNAP-EGFP levels were quantified by flow cytometry (n = 3, data represent mean ± s.d.). (C) SDS-PAGE of HEK293 SNAP-EGFP cells after time course with either 1 μM VHL-SNAP2-5C or 2.5 μM VHL-SNAP1-5C. Non-engaged SNAP-EGFP was labeled with SNAP-TMR dye. (D) Quantification of non-engaged SNAP-EGFP from (C). (E) Quantification of SNAP-EGFP protein levels by flow cytometry after time course treatment with either 1 μM VHL-SNAP2-5C or 2.5 μM VHL-SNAP1-5C (n = 3, data represent mean ± s.d.).
Fig. 4
Fig. 4. Development of CRBN-recruiting PROTACs and mode of action analysis. (A) Chemical structure of thalidomide (left panel) with the positions for the two different exit vector attachment points indicated. Chemical structures of selected CRBN-recruiting PROTACs (right panel). (B) Dose response and (C) time course analysis of CRBN5-SNAP2-0C/1C-PIP in HEK293 SNAP-EGFP cells. SNAP-EGFP levels were quantified by flow cytometry (n = 3, data represent mean ± s.d.). ‘x’ marks concentrations were cell death was observed. (D) Comparison of SNAP-EGFP degradation by active PROTACs or control compounds that do not recruit VHL or CRBN. HEK293 SNAP-EGFP cells were treated with 1 μM compound for 24 h and SNAP-EGFP levels were assessed by flow cytometry (n = 3, data represent mean ± s.d.). (E) Flow cytometry analysis of SNAP-EGFP levels in HEK293 SNAP-EGFP cells treated with 1 μM VHL-SNAP2-5C for 8 h or 1 μM CRBN5-SNAP2-0C-PIP for 24 h. Cells were co-treated with 10 μM MG-132 or DMSO.
Fig. 5
Fig. 5. Degradation of endogenously tagged SNAP-CLCa. (A) (left) Western blot of HAP1 SNAP-CLCaEN and parental HAP1 cells. CLC signal was detected with a pan-CLC antibody. (right) Confocal images of HAP1 SNAP-CLCaEN cells labeled with SNAP-TMR dye. Scale bars are 10 μm. Dose response of VHL-SNAP2-5C (B) or CRBN5-SNAP2-1C-PIP (C) in HAP1 SNAP-CLCaEN cells for 24 h (top) and 2 h (bottom). Non-engaged SNAP-CLCa was assessed with TMR-labeling. (D) Time course analysis of HAP1 SNAP-CLCaEN cells treated with 1 μM VHL-SNAP2-5C. Western blots in B–D show technical duplicates.
Fig. 6
Fig. 6. Characterization of SNAP-CLCaEN depletion. Mass spectrometry analysis of cell lysates from HAP1 SNAP-CLCaEN cells treated with 1 μM VHL-SNAP2-5C for 6 h (top) or 24 h (bottom). Volcano plots show effect of VHL-SNAP2-5C on protein levels in HAP1 SNAP-CLCaEN cells relative to DMSO control. Labeled in red are clathrin chains and myosin light chain 1 (MYL1). Green labels show subunits of the Prefoldin complex. Orange labels show ER protein homeostasis factors and labeled in grey are other hits that are significantly in- or decreased upon PROTAC treatment. Each experiment with four technical replicates, each data point represents mean value. Statistical significance was determined using a two-sided Student's t test.

References

    1. Vandemoortele G. Eyckerman S. Gevaert K. Pick a Tag and Explore the Functions of Your Pet Protein. Trends Biotechnol. 2019;37(10):1078–1090. doi: 10.1016/j.tibtech.2019.03.016. - DOI - PubMed
    1. Johnsson N. Johnsson K. A fusion of disciplines: chemical approaches to exploit fusion proteins for functional genomics. ChemBioChem. 2003;4(9):803–810. doi: 10.1002/cbic.200200603. - DOI - PubMed
    1. Hoelzel C. A. Zhang X. Visualizing and Manipulating Biological Processes by Using HaloTag and SNAP-Tag Technologies. ChemBioChem. 2020;21(14):1935–1946. doi: 10.1002/cbic.202000037. - DOI - PMC - PubMed
    1. Bukhari H. Muller T. Endogenous Fluorescence Tagging by CRISPR. Trends Cell Biol. 2019;29(11):912–928. doi: 10.1016/j.tcb.2019.08.004. - DOI - PubMed
    1. Doudna J. A. Charpentier E. Genome editing. The new frontier of genome engineering with CRISPR-Cas9. Science. 2014;346(6213):1258096. doi: 10.1126/science.1258096. - DOI - PubMed

LinkOut - more resources