. 2024 Oct 9:5:1428494.
doi: 10.3389/fgwh.2024.1428494. eCollection 2024.

Estradiol and progesterone from pregnancy to postpartum: a longitudinal latent class analysis

Affiliations

Estradiol and progesterone from pregnancy to postpartum: a longitudinal latent class analysis

Jelena Dukic et al. Front Glob Womens Health. .

Abstract

Introduction: During the peripartum, women undergo significant hormonal changes that are crucial for fetal development and a healthy pregnancy and postpartum period for mother and infant. Although several studies have determined healthy norm ranges of estradiol and progesterone, there are discrepancies among the reports, rendering it unclear which hormone levels are linked to adverse health outcomes. To account for the impact of sex steroid patterns on health outcomes in mothers and children, a longitudinal assessment of different parameters is needed.

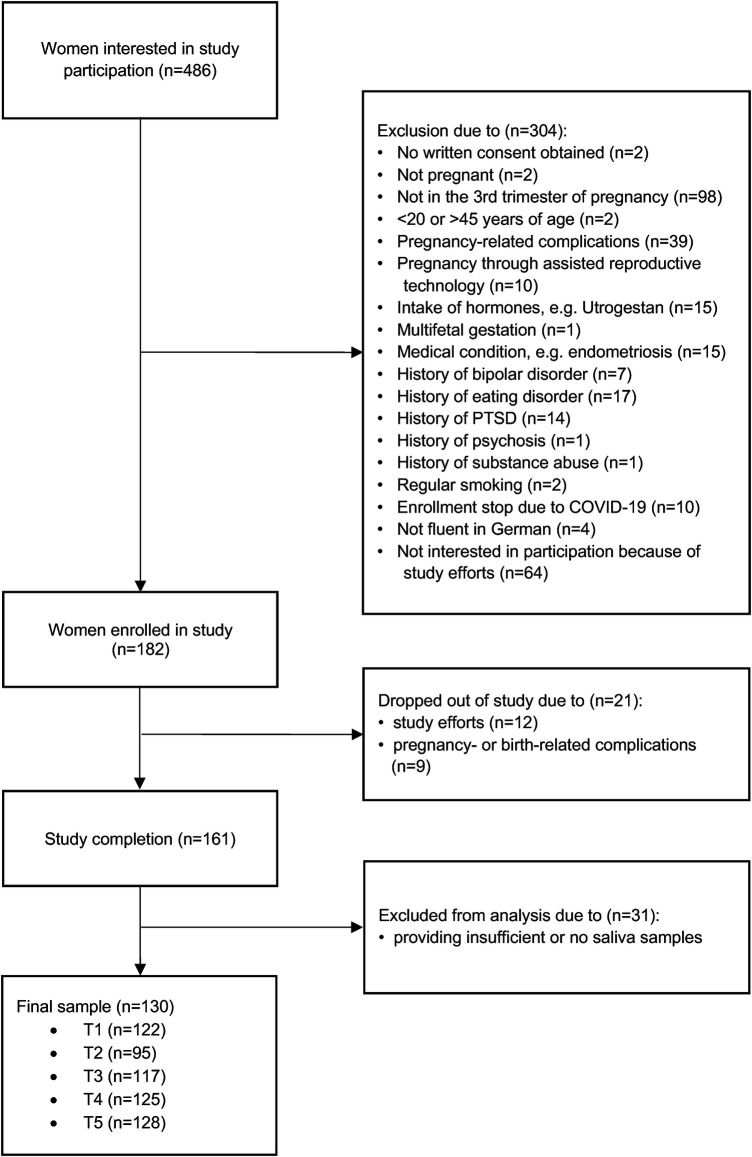
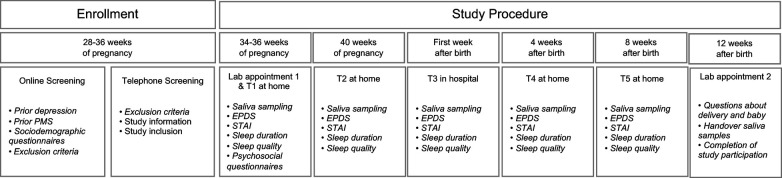
Materials and methods: We longitudinally assessed a cohort of 130 women over five months during pregnancy and postpartum. The women provided saliva samples and completed psychosocial questionnaires. Hormone analyses were conducted using enzyme-linked immunosorbent assay (ELISA). Different parameters of estradiol and progesterone were analyzed and evaluated in relation to psychometric variables. To examine the presence of heterogenous hormonal trajectories in the peripartum, we applied group-based trajectory modelling as a special case of latent-class group analysis.

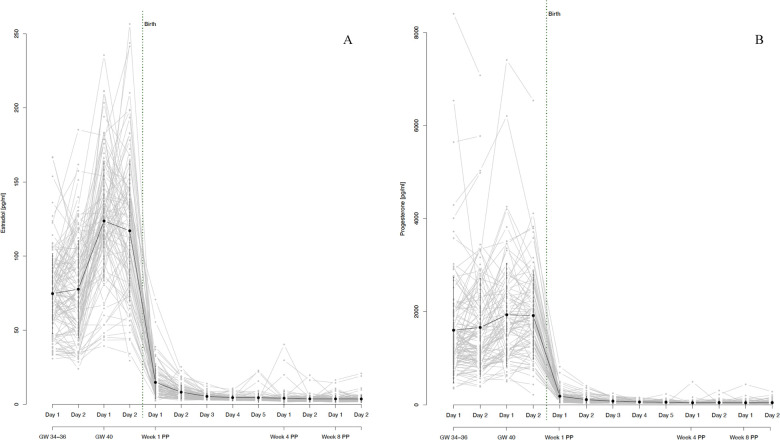
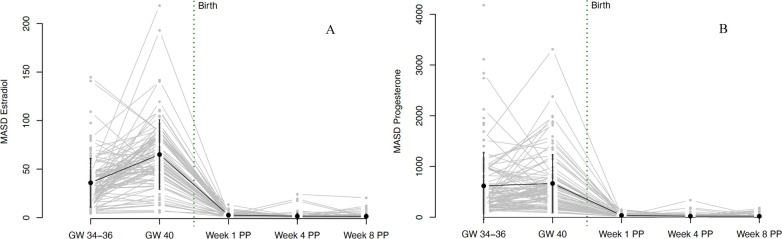
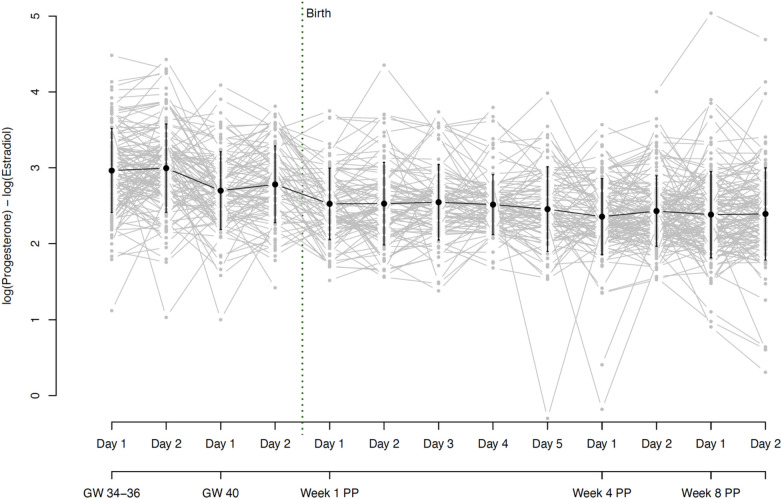
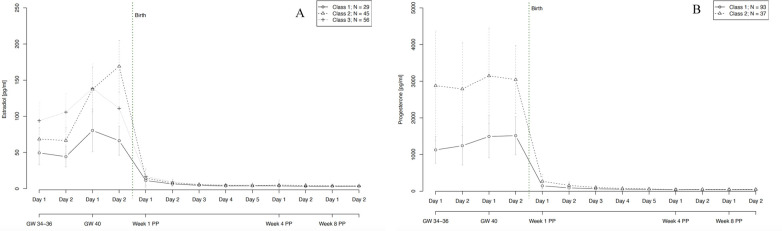
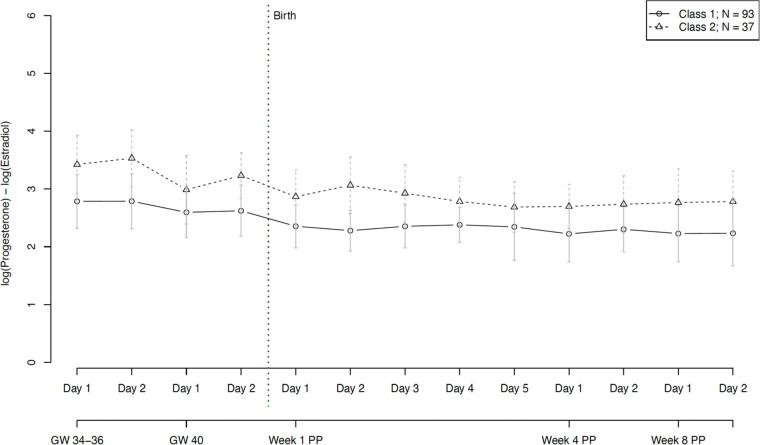
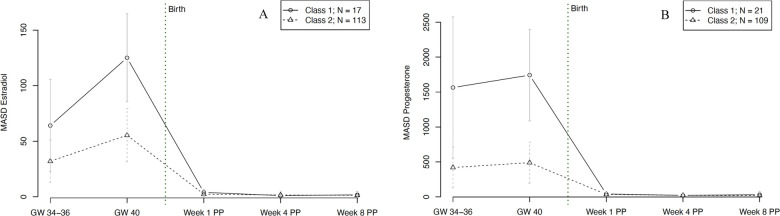
Results: Estradiol and progesterone levels rose towards the end of pregnancy and dropped sharply after birth, with considerable individual variation, particularly during pregnancy. However, their ratio remained stable. We identified three estradiol trajectory subgroups and two progesterone subgroups. Age influenced progesterone levels, with older pregnant women having higher levels than younger women. Anxiety and depressive symptoms had a predictive value for trajectories of specific subgroups of women. The study also revealed two distinct subgroups regarding the course of estradiol and progesterone fluctuations as well as their ratio.

Conclusion: This study provides insights into the course and fluctuation of salivary estradiol and progesterone levels among healthy women during the peripartum period, highlighting significant variations in hormone levels but stability in their ratio during this time. The finding of distinct sex steroid courses in the peripartum is new and suggests the need for further research to explore their impact on health outcomes. Our preliminary results suggest that hormonal fluctuations at the end of pregnancy appear to be a normal occurrence and might even be a protective factor for associated psychological symptoms and sleep disturbances in women.

Keywords: estradiol; hormones; latent-class group analysis; peripartum; postpartum; pregnancy; progesterone; sex steroids.


Conflict of interest statement

The authors declare that the research was conducted in the absence of any commercial or financial relationships that could be construed as a potential conflict of interest.

Figures

Figure 1
Figure 1
Flow diagram of participants recruited for this study. A total of 486 women were interested in participating in the study. Of these, 304 were excluded because they did not meet the inclusion criteria and 21 dropped out because they found the effort of participating in the study was too high or because of complications during pregnancy or after childbirth. A further 31 were excluded because they provided insufficient or no saliva samples, resulting in a final sample of 130 women.
Figure 2
Figure 2
Study procedure. Women who were interested in participating in the study were screened for eligibility using an online questionnaire. Eligible women underwent a telephone interview to confirm the inclusion criteria and finalize enrolment. At 34–36 weeks of gestation, each participant was invited to our laboratory, where a strictly standardized protocol took place. Among multiple psychometric questionnaires, participants received instructions on saliva sampling, and were asked to independently collect saliva samples at home over the course of study participation (at 34–36 weeks of gestation, at 40 weeks of gestation, in the first week after birth, 4 weeks after birth, and 8 weeks after birth). Finally, the second lab appointment was scheduled around 8–12 weeks after giving birth. During this appointment, the same parameters as during the first lab appointment were re-assessed, birth-related information was included, and participants handed over their saliva samples. EPDS, Edinburgh Postnatal Depression Scale; STAI, State-Trait Anxiety Inventory; PMS, German PMS Inventory; MRS = Menopause Rating Scale-II.
Figure 3
Figure 3
(A) salivary estradiol and (B) progesterone levels during pregnancy and postpartum. The grey dots and lines represent the mean and progressions of individual participants’ hormone levels for the respective sex steroid and time point. The black dot indicates the mean and the black line the standard deviation of all participants for the respective time point. Mean values and standard deviations for E2: GW 34-36, day 1 74.66 pg/ml (27.02), GW 34–36, day 2 77.66 pg/ml (32.84), GW 40, day 1 123.68 pg/ml (40.44), GW 40, day 2 117.05 pg/ml (46.96), Week 1 PP, day 1 14.88 pg/ml (10.95), Week 1 PP, day 2 8.27 pg/ml (4.62), Week 1 PP, day 3 5.44 pg/ml (2.03), Week 1 PP, day 4 4.59 pg/ml (1.72), Week 1 PP, day 5 4.54 pg/ml (3.19), Week 4 PP, day 1 4.19 pg/ml (4.46), Week 4 PP, day 2 3.75 pg/ml (2.14), Week 8 PP, day 1 3.73 pg/ml (2.13), Week 8 PP, day 2 3.69 pg/ml (2.46). Mean values and standard deviations for P4: GW 34–36, day 1 1,599.95 pg/ml (1,138.52), GW 34–36, day 2 1,658.98 pg/ml (1,051.58), GW 40, day 1 1,932.16 pg/ml (1,106.90), GW 40, day 2 1,914.03 pg/ml (935.67), Week 1 PP, day 1 184.06 pg/ml (133.76), Week 1 PP, day 2 109.59 pg/ml (76.20), Week 1 PP, day 3 76.87 pg/ml (45.67), Week 1 PP, day 4 59.92 pg/ml (29.18), Week 1 PP, day 5 55.25 pg/ml (32.02), Week 4 PP, day 1 43.53 pg/ml (44.85), Week 4 PP, day 2 46.99 pg/ml (36.39), Week 8 PP, day 1 43.77 pg/ml (43.16), Week 8 PP, day 2 45.04 pg/ml (36.42). GW, gestational week; PP, postpartum.
Figure 4
Figure 4
Fluctuations in (A) estradiol and (B) progesterone levels during pregnancy and postpartum. Fluctuations were operationalized as mean absolute successive difference (MASD). The grey dots and lines represent the mean and progression of individual participants’ fluctuations (operationalized as MASD) for the respective sex steroid. The black dot indicates the mean and the black line the standard deviation of all participants for the respective time point. Mean MASD values of fluctuations and the respective standard deviations for E2: GW 34–36 35.97 (25.1), GW 40 65.04 (35.82), Week 1 PP 2.6 (2.14), Week 4 PP 1.55 (3.16), Week 8 PP 1.41 (2.42). Mean values of fluctuations and the respective standard deviations for P4: GW 34–36 618.8 (655.01), GW 40 666.57 (568.09), Week 1 PP 36.89 (31.28), Week 4 PP 21.49 (38.99), Week 8 PP 20.72 (31.2). GW, gestational week; MASD, mean absolute successive difference; PP, postpartum.
Figure 5
Figure 5
Hormone ratio of estradiol and progesterone (Log (P4/E2) = log (P4) - log (E2)) based on daily mean hormone levels. The grey dots and lines represent the individual participants’ hormone ratio for the respective time point. The black dot indicates the mean and the black line the standard deviation of all participants for the respective time point. Mean ratios and standard deviations: GW 34–36, day 1 2.96 (0.56), GW 34–36, day 2 3.00 (0.58), GW 40, day 1 2.70 (0.51), GW 40, day 2 2.78 (0.51), Week 1 PP, day 1 2.53 (0.47), Week 1 PP, day 2 2.53 (0.54), Week 1 PP, day 3 2.55 (0.50), Week 1 PP, day 4 2.52 (0.40), Week 1 PP, day 5 2.46 (0.56), Week 4 PP, day 1 2.36 (0.50), Week 4 PP, day 2 2.43 (0.46), Week 8 PP, day 1 2.38 (0.57), Week 8 PP, day 2 2.39 (0.61). GW, gestational week; PP, postpartum.
Figure 6
Figure 6
Trajectory groups according to the best-fitting prediction model of (A) estradiol and (B) progesterone courses during pregnancy and postpartum. The best-fitting model for estradiol (A) identified three significantly distinct trajectory groups: class 1 (⦵, n = 29, 22% of women), class 2 (∆, n = 45, 35% of women) and class 3 (+, n = 56, 43% of women). The best-fitting model for progesterone (B) identified two significantly distinct trajectory groups: class 1 (⦵, n = 93, 72% of women) and class 2 (∆, n = 37, 28% of women). GW, gestational week; PP, postpartum.
Figure 7
Figure 7
Trajectory groups according to the best-fitting prediction model of the hormone ratio of estradiol and progesterone (Log (P4/E2)). The best-fitting model for the progesterone ratio identified two significantly distinct trajectory groups: class 1 (⦵, n = 93, 72% of women) and class 2 (∆, n = 37, 28% of women). GW, gestational week; PP, postpartum.
Figure 8
Figure 8
Trajectory groups according to the best-fitting prediction model of (A) fluctuations in estradiol and (B) fluctuations in progesterone levels during pregnancy and postpartum. Fluctuations were operationalized as mean absolute successive difference (MASD). The best-fitting model for estradiol fluctuations (A) identified two significantly distinct trajectory groups: class 1 (⦵, n = 17, 13% of women) and class 2 (∆, n = 113, 87% of women). The best-fitting model for progesterone fluctuations (B) identified two significantly distinct trajectory groups: class 1 (⦵, n = 21, 16% of women) and class 2 (∆, n = 109, 84% of women). GW, gestational week; MASD, mean absolute successive difference; PP, postpartum.
Figure 9
Figure 9
Overview of all mediation models tested: 1a relationship between mean levels of E2 and P4 and the EPDS score, mediated by history of depression (NS). 1b Relationship between fluctuations of E2 and P4 (via MASD) and the EPDS score, mediated by history of depression (NS). 2a1 Relationship between mean levels of E2 and P4 and the EPDS score, mediated by sleep duration (NS). 2a2 Relationship between fluctuations of E2 and P4 (via MASD) and the EPDS score, mediated by sleep quality (significant effect of subjective sleep quality on EPDS, b = −2.20, p = 0.028). 2b1 Relationship between fluctuations of E2 and P4 (via MASD) and the EPDS score, mediated by sleep duration (NS). 2b2 Relationship between fluctuations of E2 and P4 (via MASD) and the EPDS score, mediated by sleep quality (significant effect of subjective sleep quality on EPDS, b = −1.97, p = 0.049). EPDS, Edinburgh Postnatal Depression Scale; MASD, mean absolute successive difference.

Similar articles

Cited by

References

    1. Burton GJ, Jauniaux E. What is the placenta? Am J Obstet Gynecol. (2015) 213(4):S6–e1. 10.1016/j.ajog.2015.07.050 - DOI - PubMed
    1. Costa MA. The endocrine function of human placenta: an overview. Reprod Biomed Online. (2016) 32(1):14–43. 10.1016/j.rbmo.2015.10.005 - DOI - PubMed
    1. Tal R, Taylor HS. Endocrinology of pregnancy. In: Feingold KR, Anawalt B, Blackman MR, Boyce A, Chrousos G, Corpas E, de Herder WW, et al., editors. Endotext [Internet]. South Dartmouth (MA): MDText.com, Inc. (2000). Bookshelf ID: NBK278962.
    1. Shynlova O, Tsui P, Jaffer S, Lye SJ. Integration of endocrine and mechanical signals in the regulation of myometrial functions during pregnancy and labour. Eur J Obstetr Gynecol Reprod Biol. (2009) 144:S2–10. 10.1016/j.ejogrb.2009.02.044 - DOI - PubMed
    1. Makieva S, Saunders PTK, Norman JE. Androgens in pregnancy: roles in parturition. Hum Reprod Update. (2014) 20(4):542–59. 10.1093/humupd/dmu008 - DOI - PMC - PubMed

LinkOut - more resources